Market
DeFi Technologies Adopts Bitcoin as Treasury Reserve

DeFi Technologies Inc., a leading Canadian financial technology (fintech) company, has embraced Bitcoin (BTC) as its primary treasury reserve asset. This strategic move involves an initial purchase of 110 BTC, which signifies the company’s integration of traditional capital markets with decentralized finance (DeFi).
The decision aligns with the broader trend of companies seeking portfolio diversification and alternative revenue streams amid changing economic conditions.
DeFi Technologies Invests in Bitcoin as a Hedge Against Inflation
Recognizing Bitcoin as a major asset class with a market value surpassing $1 trillion, DeFi Technologies considers it an effective inflation hedge. Bitcoin’s scarcity, finite nature, digital resilience, and architectural stability make it a more attractive option than traditional assets. Olivier Roussy Newton, CEO of DeFi Technologies, expressed the company’s confidence in Bitcoin.
“We have adopted Bitcoin as our primary treasury reserve asset, reflecting our confidence in its role as a hedge against inflation and a safe haven from monetary debasement. As the best-performing asset over the past decade, Bitcoin offers significant short to long-term potential to expand the company’s treasury,” Newton noted.
Read more: 7 Best Platforms To Buy Bitcoin (BTC) With Canadian Dollars
DeFi Technologies’ latest venture has garnered attention from notable figures in the crypto industry. Anthon Pompliano, a prominent Bitcoin advocate and the founder and partner of investment management firm Morgan Creek Digital Assets, shared his thoughts on the company’s move.
“Bitcoin is slowly seeping into public company treasuries around the world. We remain shareholders of DeFi Technologies (DEFTF) and believe the business is still undervalued,” he wrote on X (Twitter).
The decision by DeFi Technologies comes amid significant monetary policy shifts. Recently, the Bank of Canada (BoC) decided to lower its key policy rate from 5% to 4.75%, aiming to ease the burden on highly indebted consumers.
Lower interest rates make borrowing cheaper for both consumers and businesses. This change potentially leads to increased spending and investment.
Lower interest rates can also mean reduced capital costs for companies like DeFi Technologies. Moreover, as returns on safer investments decrease, the attractiveness of alternative assets such as Bitcoin increases.
Matteo Greco, a research analyst at Fineqia, shared his thoughts on this perspective. Greco emphasized Bitcoin’s potential to act as a leveraged version of gold for those who believe in its store-of-value attributes.
Read more: How to Invest in Bitcoin?
According to him, viewing Bitcoin as a store of value makes sense for portfolio allocation. While gold has historically preserved purchasing power with stability, it offers limited performance. Bitcoin, in contrast, can be seen as a leveraged version of gold for those who believe in its store-of-value potential.
“Over the past 15 years, Bitcoin has consistently increased in value against fiat currencies, albeit with higher volatility. Investors who accept the possibility of short-term drawdowns have found Bitcoin to be an extremely valuable mid- to long-term investment,” he told BeInCrypto.
Disclaimer
In adherence to the Trust Project guidelines, BeInCrypto is committed to unbiased, transparent reporting. This news article aims to provide accurate, timely information. However, readers are advised to verify facts independently and consult with a professional before making any decisions based on this content. Please note that our Terms and Conditions, Privacy Policy, and Disclaimers have been updated.
Market
Cardano Whales Accumulation Hits $55 Million: $1 Target Soon?

On November 20, crypto whales offloaded significant amounts of Cardano (ADA), disrupting its bullish momentum. However, the narrative shifted today as the Cardano whales’ accumulation has taken center stage.
This renewed buying activity suggests that ADA’s price might regain its bullish momentum toward $1. But does the data support this bullish outlook?
Cardano Key Investors Change Their Stance
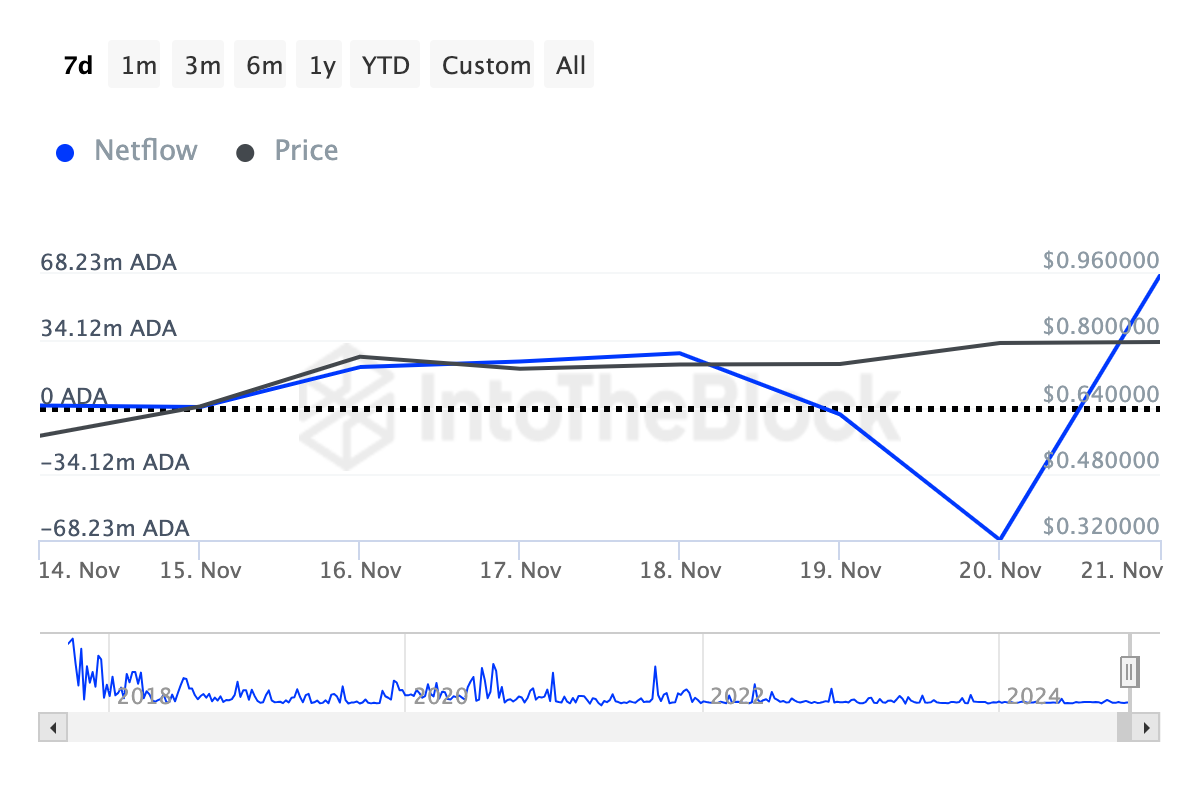
According to IntoTheBlock, Cardano’s large holders’ netflow has surged to 67.51 million ADA, signaling a significant shift in sentiment among crypto whales. The netflow represents the difference between the amount of ADA purchased and sold by large holders over a specific period.
When netflow increases, it indicates that whales are buying more than they are selling. Typically, this is a bullish signal. Conversely, a drop in netflow suggests more selling by whales, which is generally regarded as bearish.
In this case, the recent netflow increase, valued at approximately $55 million, aligns with ADA’s 11% price surge over the last 24 hours. Thus, this Cardano whales accumulation suggests that ADA may be poised for further gains, with the recent uptick serving as a potential foundation for a higher value.
Furthermore, the In/Out of Money Around Price (IOMAP) indicator provides further support for this bullish outlook. For context, the IOMAP analyzes token clusters based on three groups: holders who purchased below the current price (in the money), above the current price (out of the money), and those at breakeven.
This metric is essential for identifying potential support and resistance zones. Specifically, if there is a higher number of tokens “in the money, ” it signifies solid support, as many holders are at a profit and less likely to sell, potentially driving the price higher.
On the other hand, a higher “out of the money,” volume points to resistance, as holders might sell to recover losses, putting downward pressure on the price.

Currently, ADA’s IOMAP shows strong support levels outweighing resistance zones, reinforcing the potential for its price to climb further.
ADA Price Prediction: Move Toward $1 Almost Valid
On the daily chart, ADA’s price has risen above the key Exponential Moving Averages (EMAs). Specifically, the 20-day EMA (blue) and 50 EMA (yellow) are below Cardano’s price. When the price is above the indicator, the trend is bullish.
On the other hand, if the price is below the indicator, the trend is bearish. Therefore, it appears that, with the current trend, ADA could rise higher than $0.87. If this happens, the altcoin might rally toward the $1 mark.
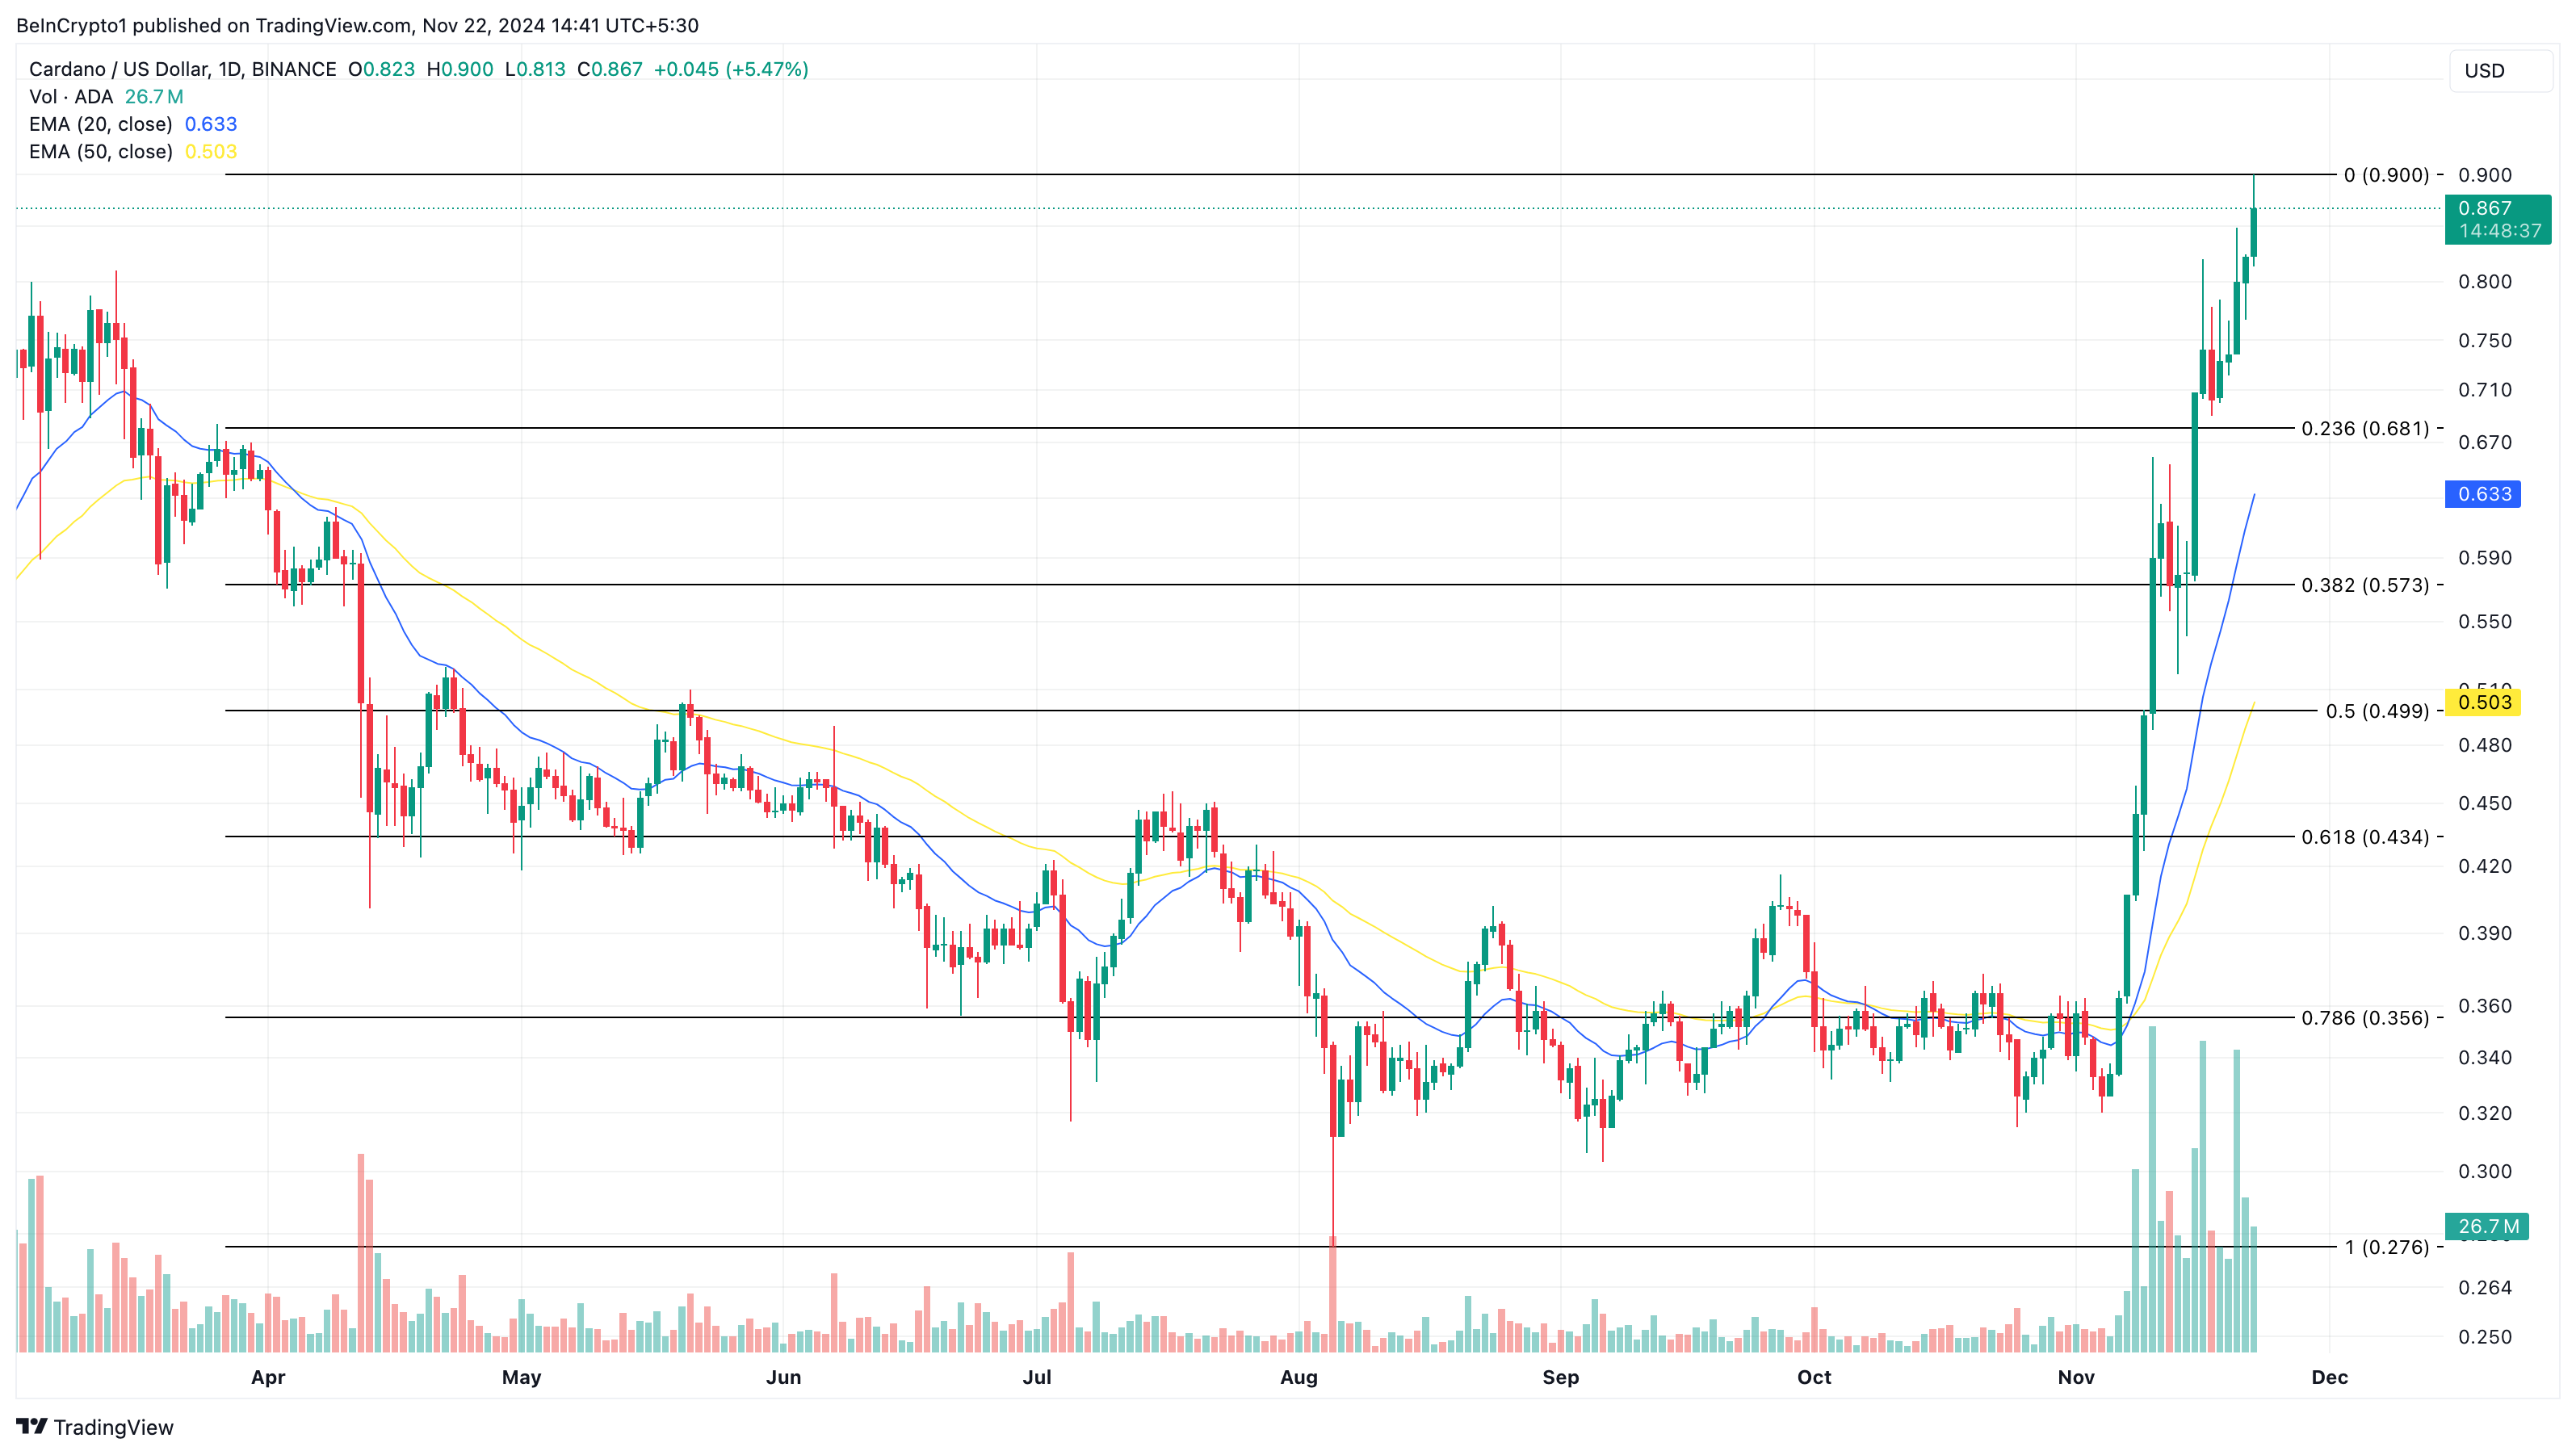
However, if Cardano whales decide to sell and book profits, this prediction might not come to pass. Instead, the price could drop to $0.68.
Disclaimer
In line with the Trust Project guidelines, this price analysis article is for informational purposes only and should not be considered financial or investment advice. BeInCrypto is committed to accurate, unbiased reporting, but market conditions are subject to change without notice. Always conduct your own research and consult with a professional before making any financial decisions. Please note that our Terms and Conditions, Privacy Policy, and Disclaimers have been updated.
Market
Bitcoin Price Approaches $100K: The Countdown Is On

Bitcoin price is rising steadily above the $95,000 zone. BTC is showing positive signs and might soon hit the $100,000 milestone level.
- Bitcoin started a fresh increase above the $95,000 zone.
- The price is trading above $95,000 and the 100 hourly Simple moving average.
- There is a key bullish trend line forming with support at $95,200 on the hourly chart of the BTC/USD pair (data feed from Kraken).
- The pair could continue to rise if it clears the $100,000 resistance zone.
Bitcoin Price Sets Another ATH
Bitcoin price remained supported above the $92,000 level. BTC formed a base and started a fresh increase above the $95,000 level. It cleared the $96,500 level and traded to a new high at $98,999 before there was a pullback.
There was a move below the $98,000 level. However, the price remained stable above the 23.6% Fib retracement level of the upward move from the $91,500 swing low to the $98,990 high. There is also a key bullish trend line forming with support at $95,200 on the hourly chart of the BTC/USD pair.
The trend line is close to the 50% Fib retracement level of the upward move from the $91,500 swing low to the $98,990 high. Bitcoin price is now trading above $96,000 and the 100 hourly Simple moving average.
On the upside, the price could face resistance near the $98,880 level. The first key resistance is near the $99,000 level. A clear move above the $99,000 resistance might send the price higher. The next key resistance could be $100,000.
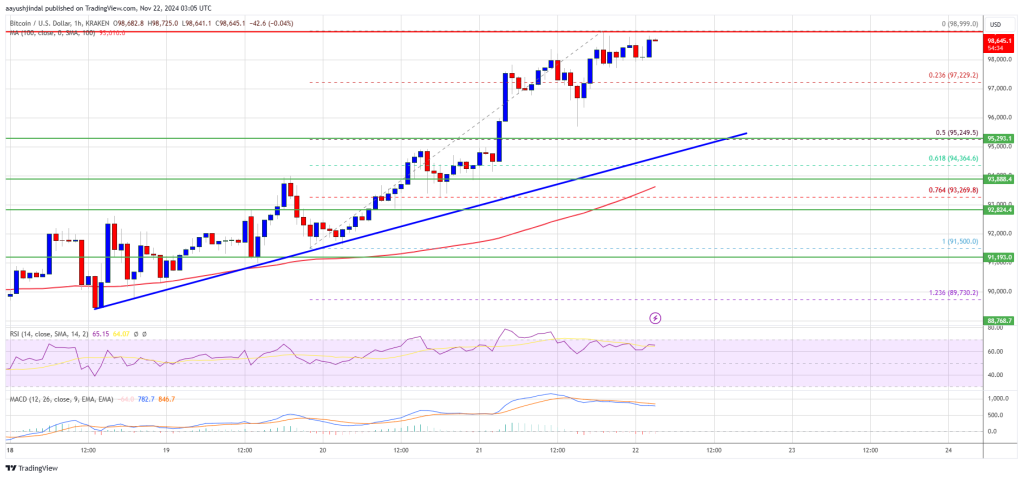
A close above the $100,000 resistance might initiate more gains. In the stated case, the price could rise and test the $102,000 resistance level. Any more gains might send the price toward the $104,500 resistance level.
Downside Correction In BTC?
If Bitcoin fails to rise above the $100,000 resistance zone, it could start a downside correction. Immediate support on the downside is near the $98,000 level.
The first major support is near the $96,800 level. The next support is now near the $95,500 zone and the trend line. Any more losses might send the price toward the $92,000 support in the near term.
Technical indicators:
Hourly MACD – The MACD is now gaining pace in the bullish zone.
Hourly RSI (Relative Strength Index) – The RSI for BTC/USD is now above the 50 level.
Major Support Levels – $96,800, followed by $95,500.
Major Resistance Levels – $99,000, and $100,000.
Market
This Is Why XRP Price Rallied By 25% and Could Soon Hit $2
Ripple’s (XRP) price rallied by 25% in the last 24 hours following Gary Gensler’s announcement that he would resign as the US Securities and Exchange Commission (SEC) chair on January 20, 2025.
This development comes as a relief to the popular “XRP Army,” which has had to deal with suppressed price action due to the Gensler-led SEC’s nonstop petitions against Ripple. But that is not all that happened.
Ripple Bears Face Notable Liquidation Following Gensler’s Notification
Gensler’s announcement appears to be a positive development for the broader crypto market. But XRP holders seemed to benefit the most. This was particularly significant given the unresolved Ripple-SEC legal issues that have persisted throughout the SEC Chair’s tenure.
As a result, it came as no surprise that XRP price rallied and outpaced those of any other cryptocurrency in the top 10. Furthermore, the development triggered liquidations totaling $26.11 million over the last 24 hours.
Liquidation occurs when a trader fails to meet the margin requirements for a leveraged position. This forces the exchange to sell off their assets to prevent further losses. In XRP’s case, the liquidation primarily resulted in a short squeeze.
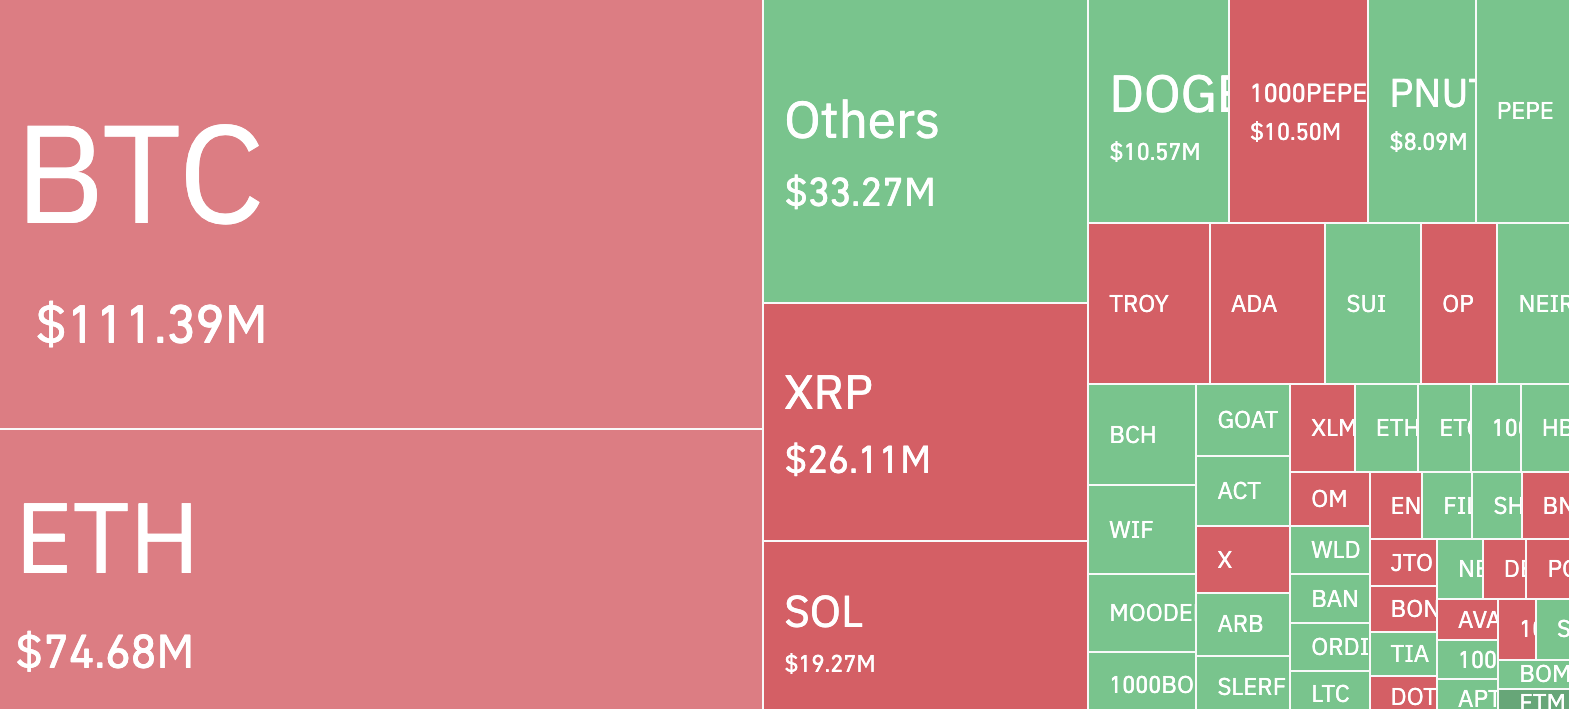
A short squeeze happens when a large number of short positions (traders betting on price declines) are forced to close, driving the price higher as they rush back to buy back the asset.
At press time, XRP trades at $1.40 and currently has a market cap of $80.64 billion. With Gensler almost gone, crypto lawyer John Deaton noted that XRP price gains could be higher, and the market cap could climb to $100 billion.
“XRP soon will achieve a $100B market cap. Times are changing,” Deaton wrote on X.
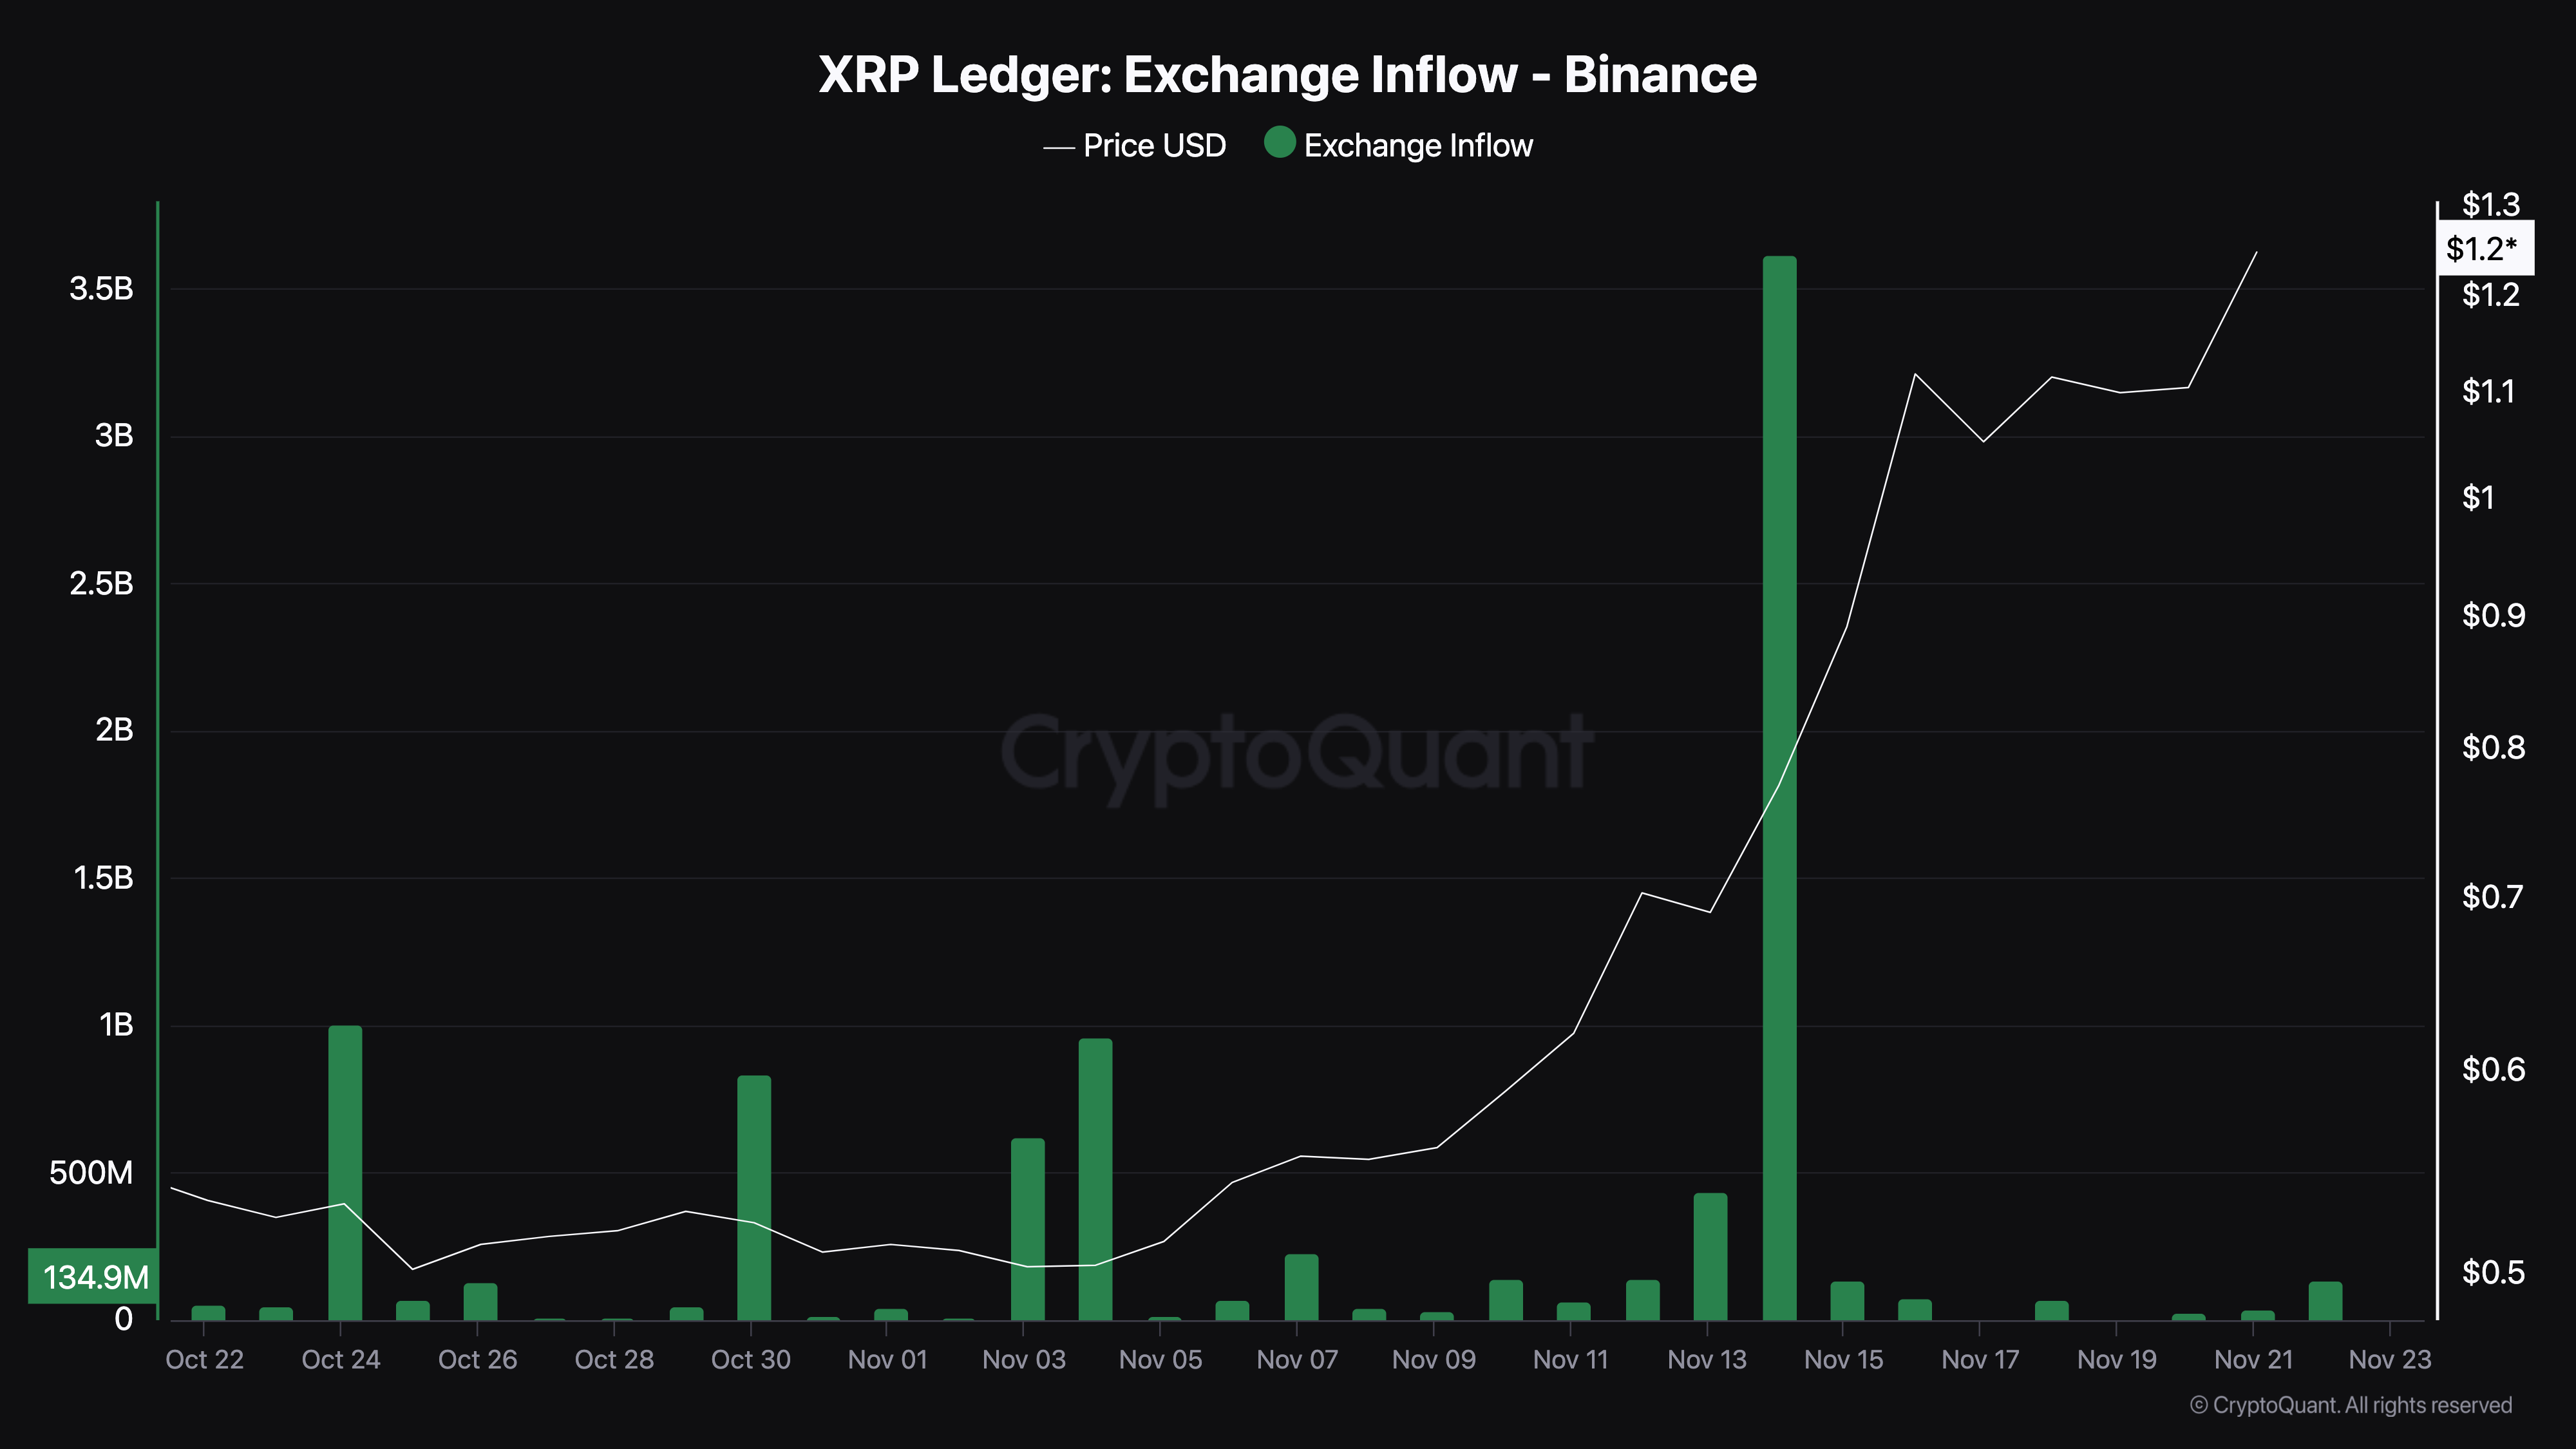
Meanwhile, CryptoQuant data shows that the total number of XRP sent into exchange has significantly decreased. Typically, high values indicate increased selling pressure in the spot market. This is because it suggests that more assets are being offloaded, potentially driving prices lower.
However, since it is low, XRP holders are refraining from selling. If this remains the case, the token’s value could rise higher than $1.40.
XRP Price Prediction: $2 Coming?
According to the 4-hour chart, XRP has been trading within a range of $1.04 to $1.17 since November 18. This sideways movement has resulted in the formation of a bull flag — a bullish chart pattern that signals potential upward momentum.
The bull flag begins with a sharp price surge, forming the flagpole, driven by significant buying pressure that outpaces sellers. This is followed by a consolidation phase, where the price retraces slightly and moves within parallel trendlines, creating the flag structure.
Yesterday, XRP broke out of this pattern, signaling that bulls have seized control of the market. If this momentum persists, XRP’s price could surpass $1.50, potentially approaching the $2 threshold.
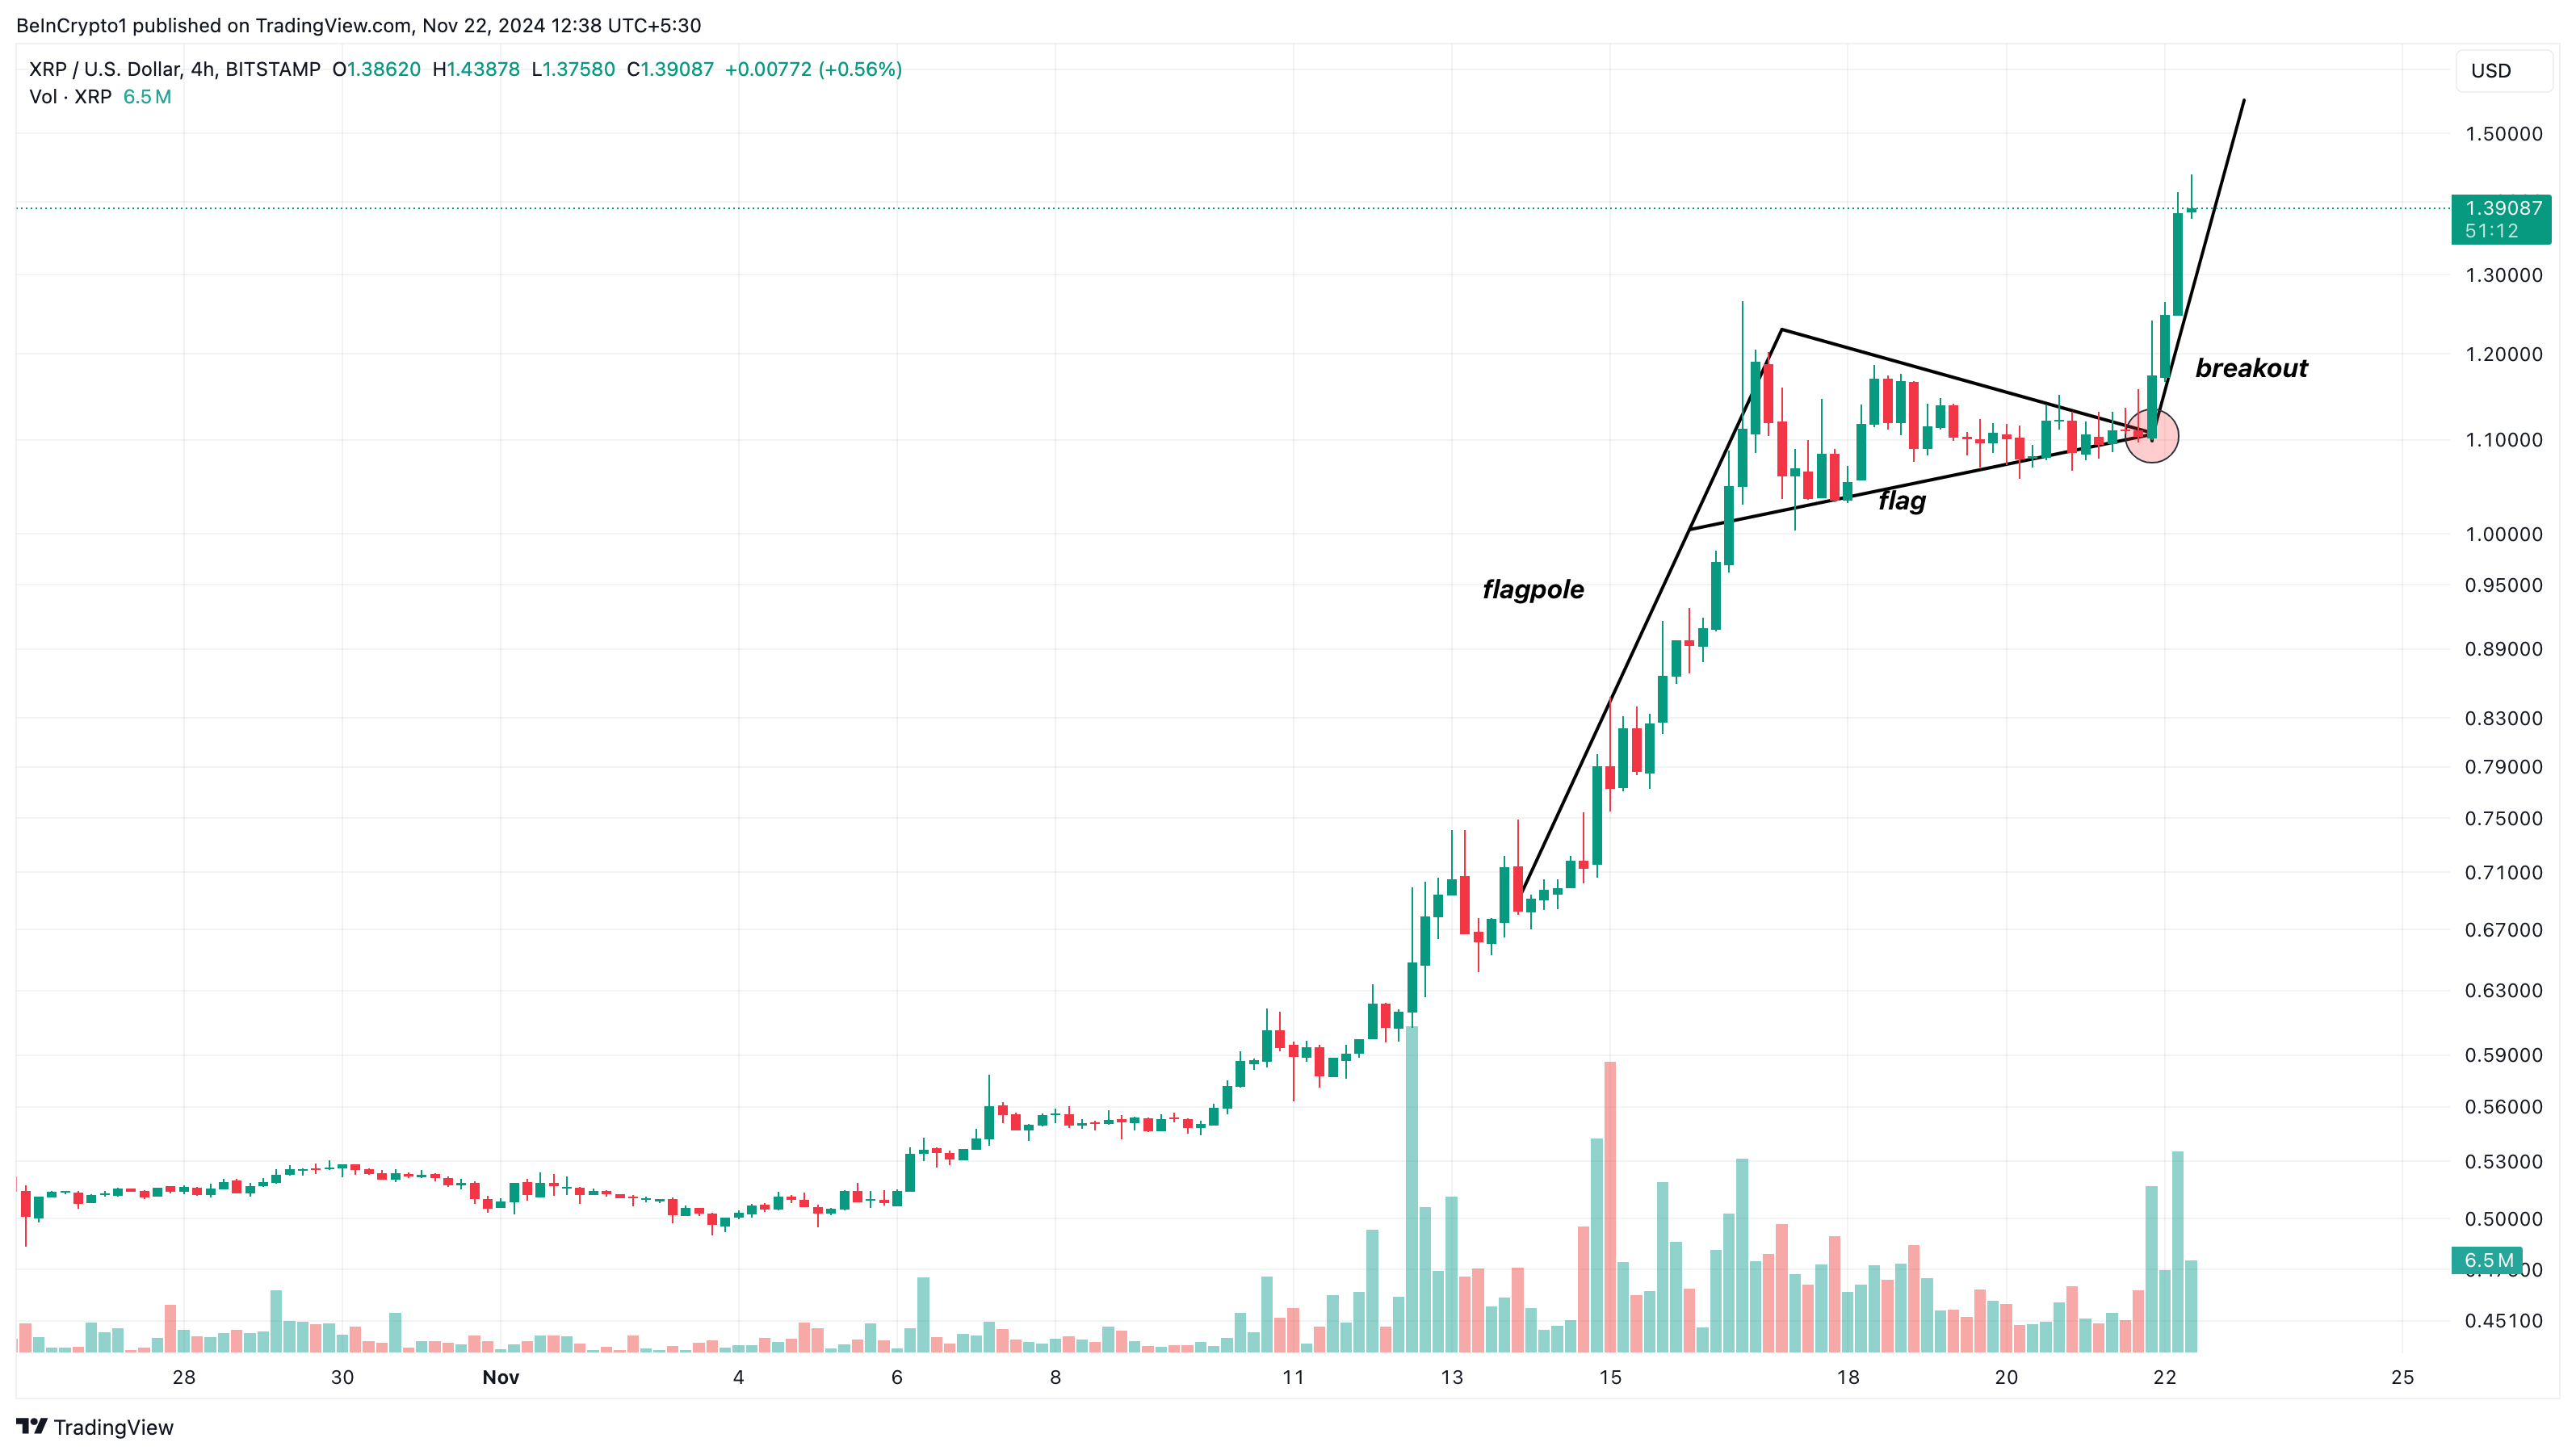
However, this bullish scenario hinges on market behavior. If holders decide to secure profits, selling pressure could push XRP’s price below $1, erasing recent gains.
Disclaimer
In line with the Trust Project guidelines, this price analysis article is for informational purposes only and should not be considered financial or investment advice. BeInCrypto is committed to accurate, unbiased reporting, but market conditions are subject to change without notice. Always conduct your own research and consult with a professional before making any financial decisions. Please note that our Terms and Conditions, Privacy Policy, and Disclaimers have been updated.
-

 Altcoin22 hours ago
Dogecoin Whale Accumulation Sparks Optimism, DOGE To Rally 9000% Ahead?
-

 Bitcoin20 hours ago
Marathon Digital Raises $1B to Expand Bitcoin Holdings
-

 Regulation14 hours ago
UK to unveil crypto and stablecoin regulatory framework early next year
-

 Market20 hours ago
ETH/BTC Ratio Plummets to 42-Month Low Amid Bitcoin Surge
-

 Altcoin23 hours ago
Sui Network Back Online After 2-Hour Outage, Price Slips
-

 Market17 hours ago
Why SUI Network Outage Did Not Cause a Price Crash
-
 Market21 hours ago
Bitcoin Cash (BCH) Price Up, Leads Daily Gains
-

 Market16 hours ago
Cardano (ADA) Price Hits 41% Weekly Growth, $1 Target in Sight


