
Market
Bitcoin (BTC) Resilience Driven by Whale Accumulation and Key Support

Last Friday, Bitcoin’s price fell from $72,000 to $69,000, causing a 10% average drop across many cryptocurrencies.
This sharp decline has caused the market to be concerned, leading to questions about what’s driving these changes and how investors are reacting. To better understand what might happen next, we’re looking at on-chain data for clearer insights.
Bitcoin’s Whale Activity: Insights Into the Market’s Silent Movers
The on-chain data indicates that whales, the large holders of Bitcoin, are not only retaining their holdings but are also increasing their supply. This strategic accumulation during price dips suggests that these influential market players view the current lower prices as favorable buying opportunities.
Their actions can significantly impact market sentiment and price stabilization, hinting that they may foresee a potential rebound or at least do not expect further significant declines in the short term.
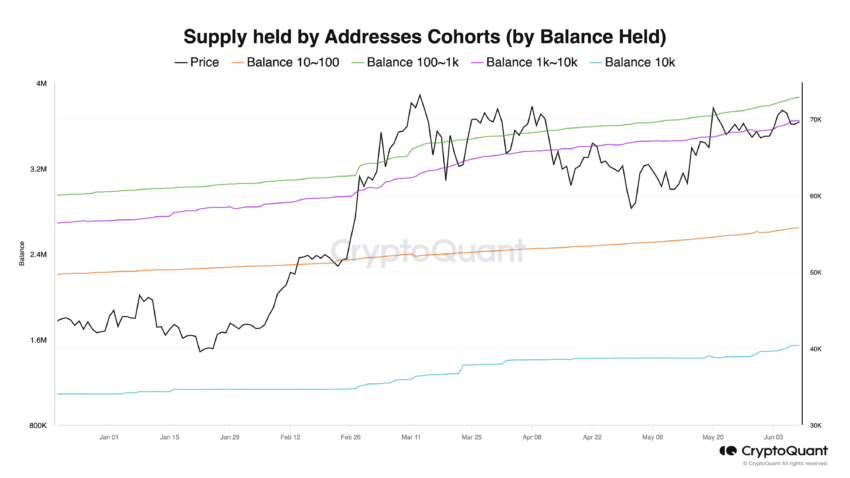
The changes in Bitcoin balance across different cohorts show notable increases.
Specifically, addresses holding 100 to 1,000 BTC saw an increase of 30,601 BTC, those with 1,000 to 10,000 BTC increased by 34,834 BTC, and the largest holders, those with over 10,000 BTC, increased their balances by 24,176 BTC.
These significant increases suggest that larger Bitcoin holders are accumulating more BTC during the recent market correction.
BTC Current Price: Watching the Critical Support Level
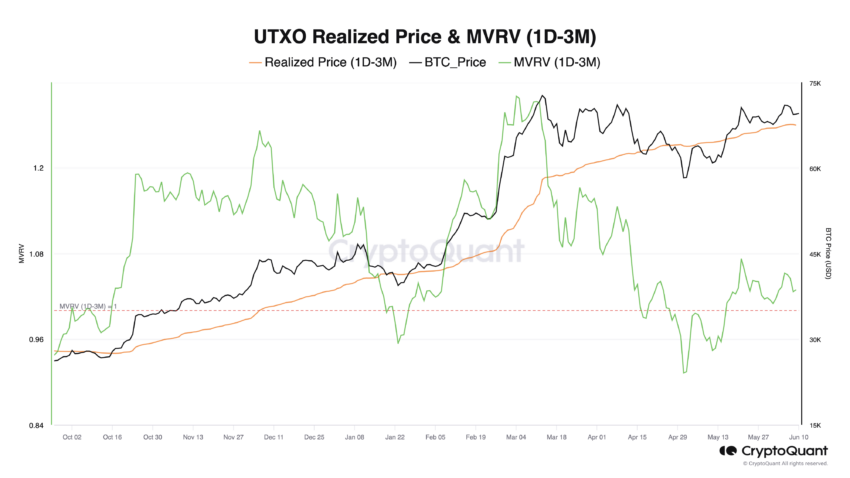
The average acquisition price for Bitcoin bought between one day and three months ago is $67,500. Bitcoins bought within this timeframe account for 17% of the total circulating supply.
Should the price fall below this level, it could potentially initiate a cascade of sell-offs as investors rush to minimize losses.
If the price falls below the $67,500 level, it may find support in the $61,000 – $62,000 range, which aligns with the realized price of significant wallet cohorts.
The “realized price” is a financial metric that estimates the average cost at which all Bitcoins in circulation were last moved or transacted. Unlike the “market price,” which fluctuates based on trading activity, the realized price provides insight into what investors paid for their holdings, aggregating this data across all Bitcoins.
If the market price falls below the realized price, it could indicate that, on average, 17% of the circulating Bitcoin supply is held at a loss. This situation might prompt selling pressure as investors attempt to minimize their losses.
On the other hand, if the market price remains above this realized price, 17% of the Bitcoin supply will be in profit. This incentivizes holders to retain their positions for extended periods, potentially signaling a positive trend for the market.
A price surge toward the $72,000 level could be decisive this time, potentially leading to an all-time high breakout in the mid-term.
As detailed in the analysis, this scenario is plausible if Bitcoin can hold its position above the $67,500 support level.
The post Bitcoin (BTC) Resilience Driven by Whale Accumulation and Key Support appeared first on BeInCrypto.


Reason to trust
![]()
Strict editorial policy that focuses on accuracy, relevance, and impartiality
Created by industry experts and meticulously reviewed
The highest standards in reporting and publishing
Strict editorial policy that focuses on accuracy, relevance, and impartiality
Morbi pretium leo et nisl aliquam mollis. Quisque arcu lorem, ultricies quis pellentesque nec, ullamcorper eu odio.
Ethereum price failed to recover above $1,820 and dropped below $1,650. ETH is now consolidating losses and might face resistance near the $1,675 zone.
- Ethereum failed to stay above the $1,650 and $1,620 levels.
- The price is trading below $1,650 and the 100-hourly Simple Moving Average.
- There was a break below a connecting bullish trend line with support at $1,775 on the hourly chart of ETH/USD (data feed via Kraken).
- The pair remains at risk of more losses below the $1,550 support zone.
Ethereum Price Dips Further
Ethereum price failed to stay above the $1,800 support zone and extended losses, like Bitcoin. ETH declined heavily below the $1,750 and $1,700 levels.
There was a break below a connecting bullish trend line with support at $1,775 on the hourly chart of ETH/USD. The bears even pushed the price below the $1,600 level. A low was formed at $1,537 and the price recently corrected some losses.
There was a move above the $1,580 level. The price tested the 23.6% Fib retracement level of the downward move from the $1,815 swing high to the $1,537 low. However, the bears are active near the $1,600 zone. The price is now consolidating and facing many hurdles.
Ethereum price is now trading below $1,650 and the 100-hourly Simple Moving Average. On the upside, the price seems to be facing hurdles near the $1,600 level.
The next key resistance is near the $1,675 level or the 50% Fib retracement level of the downward move from the $1,815 swing high to the $1,537 low. The first major resistance is near the $1,710 level. A clear move above the $1,710 resistance might send the price toward the $1,820 resistance.

An upside break above the $1,820 resistance might call for more gains in the coming sessions. In the stated case, Ether could rise toward the $1,880 resistance zone or even $1,920 in the near term.
Another Decline In ETH?
If Ethereum fails to clear the $1,600 resistance, it could start another decline. Initial support on the downside is near the $1,550 level. The first major support sits near the $1,535 zone.
A clear move below the $1,535 support might push the price toward the $1,420 support. Any more losses might send the price toward the $1,400 support level in the near term. The next key support sits at $1,350.
Technical Indicators
Hourly MACD – The MACD for ETH/USD is gaining momentum in the bearish zone.
Hourly RSI – The RSI for ETH/USD is now below the 50 zone.
Major Support Level – $1,550
Major Resistance Level – $1,600

Solana (SOL) has faced significant price declines recently, falling below the $100 mark and reaching a 14-month low.
This drop is attributed to broader market bearishness, largely driven by ongoing trade tensions and fears of a financial crisis, often likened to the 1987 “Black Monday.” Despite these challenges, there is potential for SOL to stabilize and recover in the near future.
Solana Investors Stand Strong
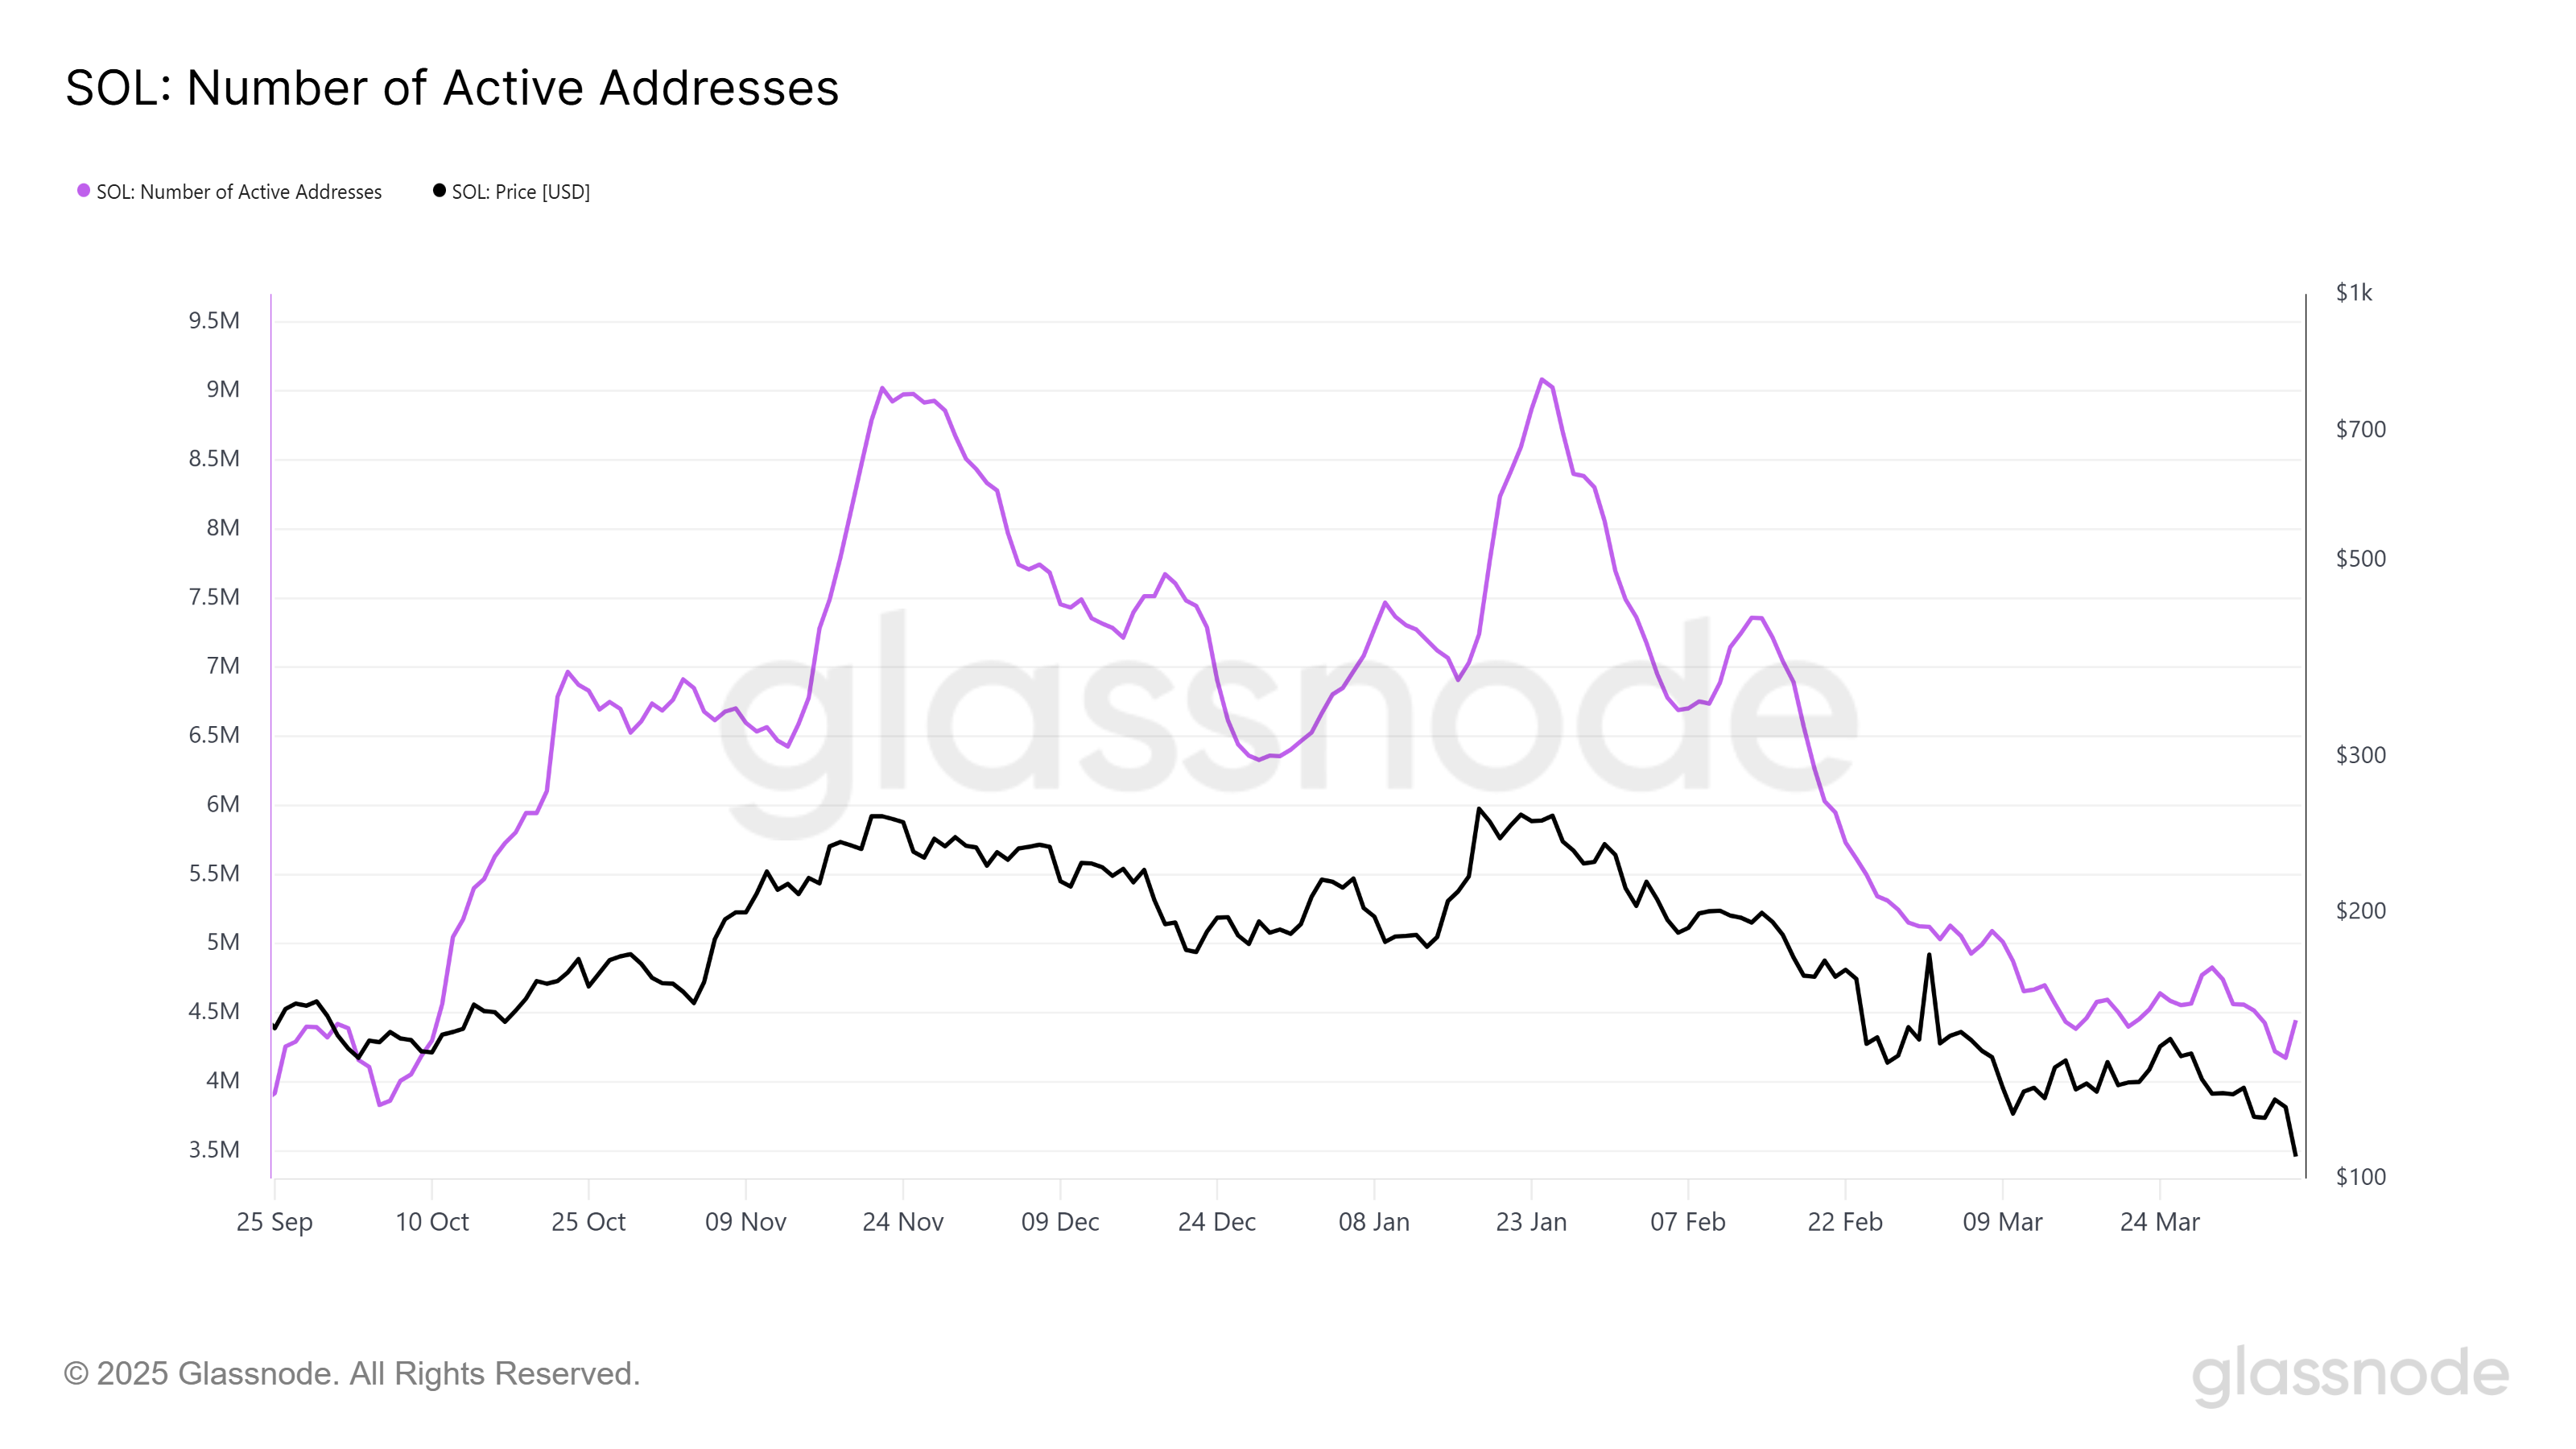
The number of active addresses on the Solana network has recently hit a 6-month low, with around 4.44 million addresses engaging on the platform. While the decline from January’s peak of 9 million addresses might seem concerning, it also indicates that investors are likely waiting for a strong recovery before being more active on the network.
Despite the price downturn, Solana’s loyal investor base continues to hold their positions, signaling potential support that could prevent further price declines. Solana’s investors remain hopeful for a rebound, particularly given the network’s history of bouncing back after downturns.
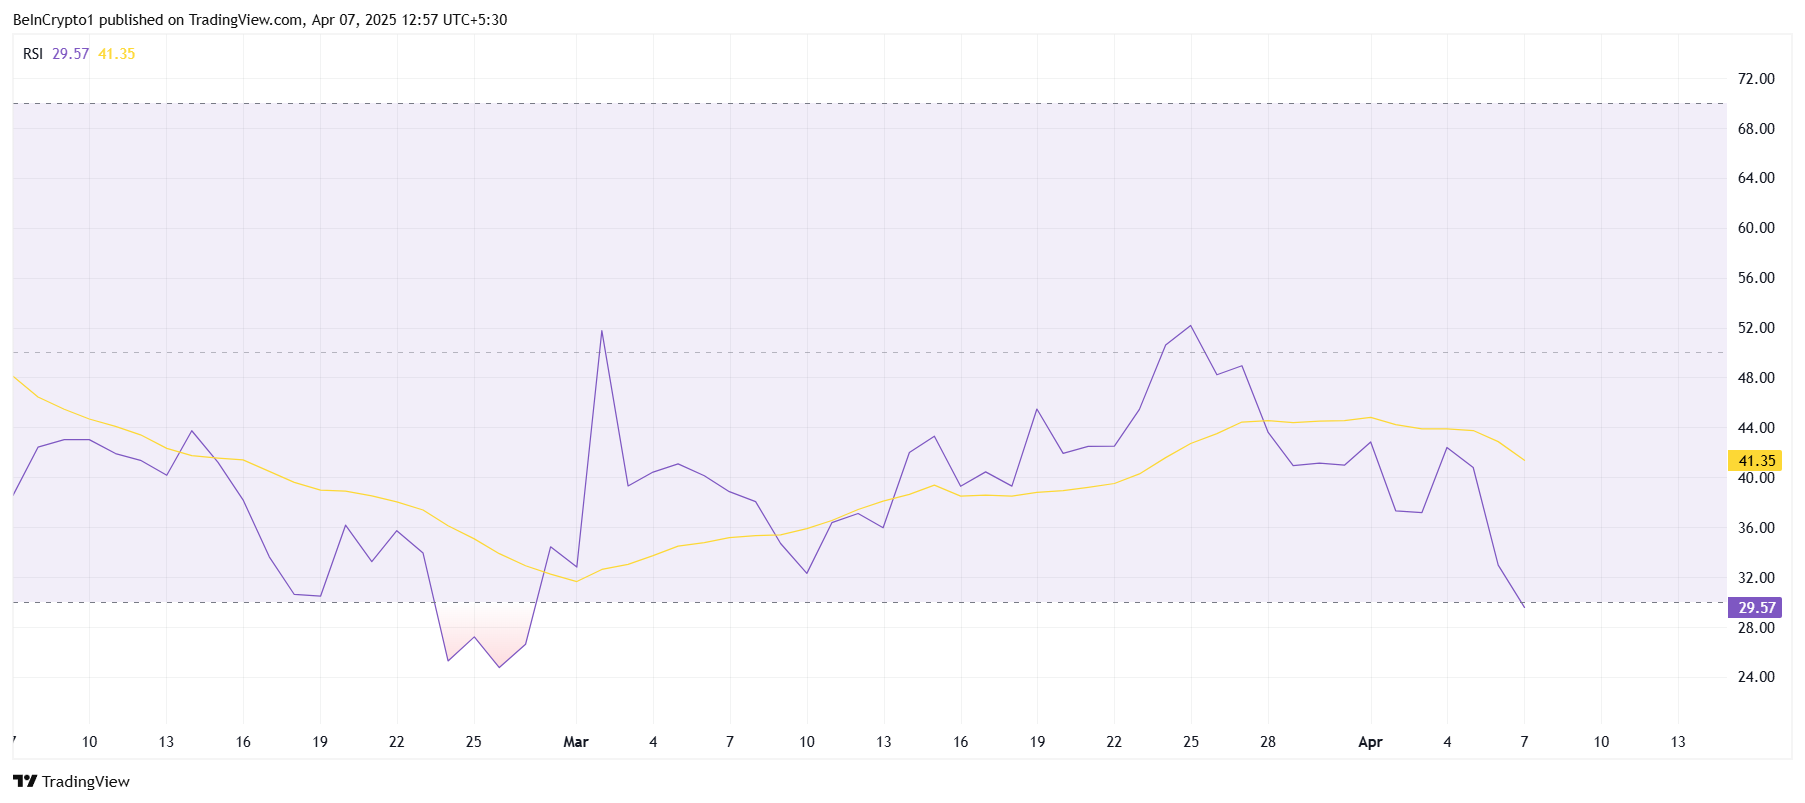
Looking at technical indicators, the Relative Strength Index (RSI) for Solana is currently sitting in the oversold zone, below the critical 30.0 mark. This suggests that the bearish momentum may be nearing its saturation point, with the potential for a reversal in the near future. Historically, when SOL has dipped into the oversold region, the price has rebounded.
The RSI reading suggests that the market may be poised for a short-term recovery if the broader market conditions stabilize. While the global financial climate remains uncertain, the RSI signals that Solana could be on the brink of a price rebound, provided the bearish forces start to subside.
SOL Price May Recover Soon
Solana’s price has dropped 20.8% during the intra-day trading session, reaching $97. The price fall below $100 marks a new low for the asset, driven by a surge in bearish sentiment across the market. As a result, many investors are watching closely to see if Solana can reclaim its previous support levels.
Despite the recent declines, Solana’s recovery potential remains strong. If the price manages to break above the $100 mark and hold it as support, the positive momentum could return. Investors are likely to capitalize on the current 14-month low, injecting new capital into the network and helping to stabilize the price.
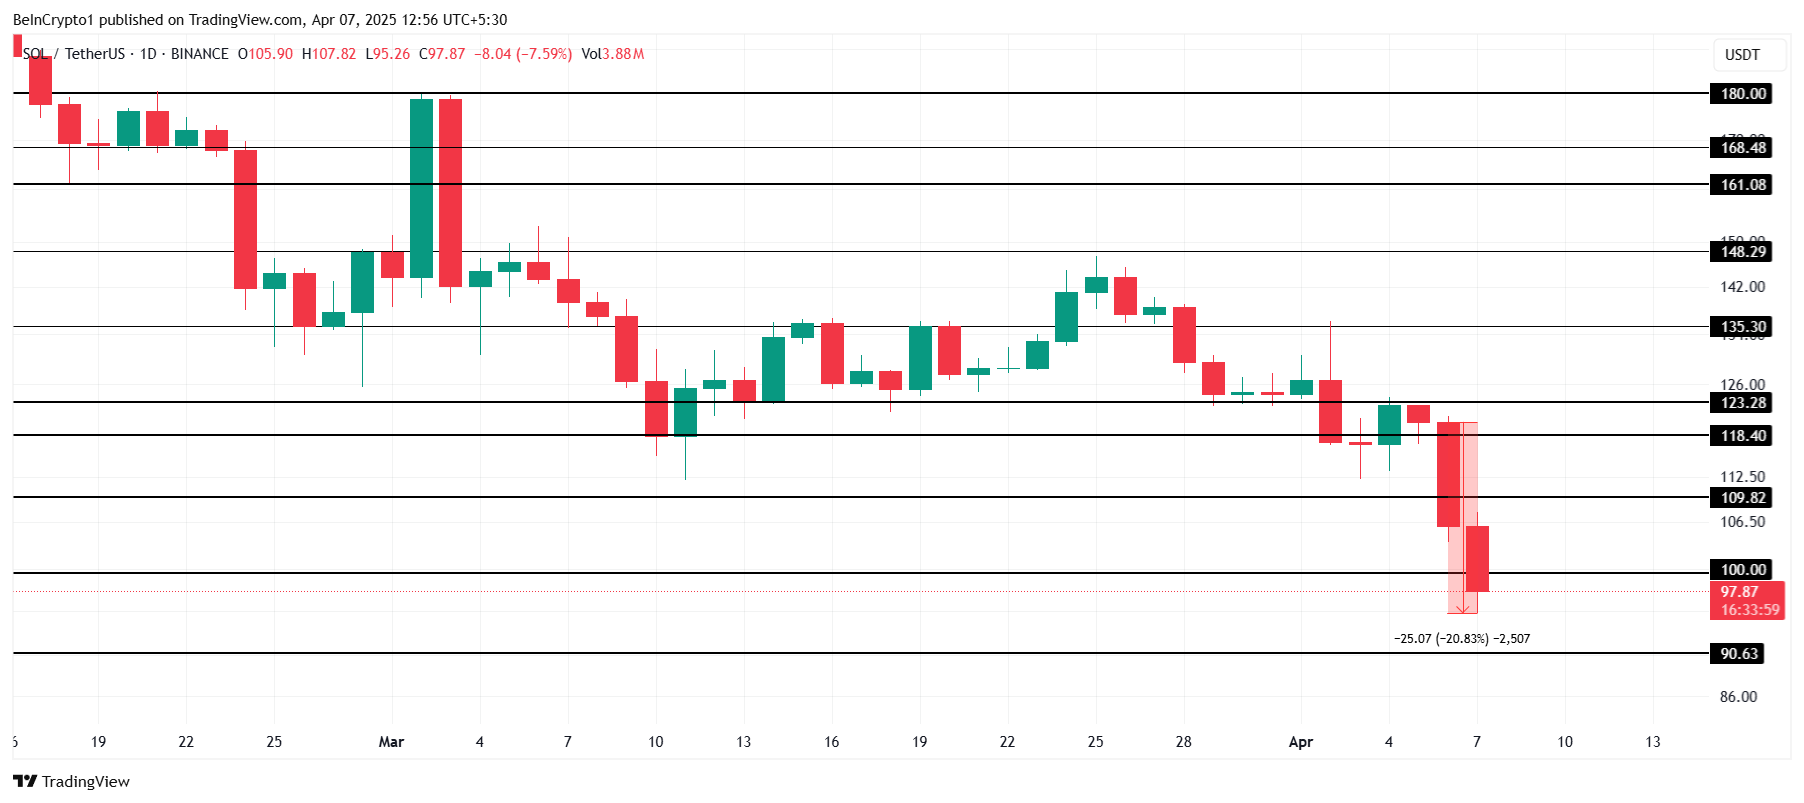
However, if the broader market conditions fail to improve, Solana’s price may continue to struggle. A drop below the $90 support level would invalidate the bullish outlook and extend losses. As a result, SOL may face further downward pressure, especially if negative market trends persist.
Disclaimer
In line with the Trust Project guidelines, this price analysis article is for informational purposes only and should not be considered financial or investment advice. BeInCrypto is committed to accurate, unbiased reporting, but market conditions are subject to change without notice. Always conduct your own research and consult with a professional before making any financial decisions. Please note that our Terms and Conditions, Privacy Policy, and Disclaimers have been updated.
Aayush Jindal, a luminary in the world of financial markets, whose expertise spans over 15 illustrious years in the realms of Forex and cryptocurrency trading. Renowned for his unparalleled proficiency in providing technical analysis, Aayush is a trusted advisor and senior market expert to investors worldwide, guiding them through the intricate landscapes of modern finance with his keen insights and astute chart analysis.
From a young age, Aayush exhibited a natural aptitude for deciphering complex systems and unraveling patterns. Fueled by an insatiable curiosity for understanding market dynamics, he embarked on a journey that would lead him to become one of the foremost authorities in the fields of Forex and crypto trading. With a meticulous eye for detail and an unwavering commitment to excellence, Aayush honed his craft over the years, mastering the art of technical analysis and chart interpretation.
As a software engineer, Aayush harnesses the power of technology to optimize trading strategies and develop innovative solutions for navigating the volatile waters of financial markets. His background in software engineering has equipped him with a unique skill set, enabling him to leverage cutting-edge tools and algorithms to gain a competitive edge in an ever-evolving landscape.
In addition to his roles in finance and technology, Aayush serves as the director of a prestigious IT company, where he spearheads initiatives aimed at driving digital innovation and transformation. Under his visionary leadership, the company has flourished, cementing its position as a leader in the tech industry and paving the way for groundbreaking advancements in software development and IT solutions.
Despite his demanding professional commitments, Aayush is a firm believer in the importance of work-life balance. An avid traveler and adventurer, he finds solace in exploring new destinations, immersing himself in different cultures, and forging lasting memories along the way. Whether he’s trekking through the Himalayas, diving in the azure waters of the Maldives, or experiencing the vibrant energy of bustling metropolises, Aayush embraces every opportunity to broaden his horizons and create unforgettable experiences.
Aayush’s journey to success is marked by a relentless pursuit of excellence and a steadfast commitment to continuous learning and growth. His academic achievements are a testament to his dedication and passion for excellence, having completed his software engineering with honors and excelling in every department.
At his core, Aayush is driven by a profound passion for analyzing markets and uncovering profitable opportunities amidst volatility. Whether he’s poring over price charts, identifying key support and resistance levels, or providing insightful analysis to his clients and followers, Aayush’s unwavering dedication to his craft sets him apart as a true industry leader and a beacon of inspiration to aspiring traders around the globe.
In a world where uncertainty reigns supreme, Aayush Jindal stands as a guiding light, illuminating the path to financial success with his unparalleled expertise, unwavering integrity, and boundless enthusiasm for the markets.

Ethereum Price Tanks Hard—Can It Survive the $1,500 Test?

Solana (SOL) Price Falls Below $100, Crashes To 14-Month Low
$1 Billion in Liquidations Over the Weekend

XRP Price Dives Below $2—Is This the Start of a Bigger Breakdown?

How Privacy Coins Are Outperforming in 2025’s Crypto Chaos

Solana (SOL) Freefall—Can It Hold Above The $100 Danger Zone?

2.52 Million Altcoins Are Ruining Crypto’s Future

Animoca Brands Valuation Tanks 75% In Two Years, Here’s Why

Crypto exchange BingX hacked for $43 million

Are The Big Players Losing Interest?

Hong Kong’s Securities Association Tips Authorities On Crypto Self-Regulation

Coinbase cbBTC Set to go Live on Solana
2.52 Million Altcoins Are Ruining Crypto’s Future
Animoca Brands Valuation Tanks 75% In Two Years, Here’s Why
Crypto exchange BingX hacked for $43 million
Are The Big Players Losing Interest?
Hong Kong’s Securities Association Tips Authorities On Crypto Self-Regulation
Coinbase cbBTC Set to go Live on Solana
-

 Market22 hours ago
HBAR Could Avoid $30 Million Liquidation Thanks to Death Cross
-

 Bitcoin17 hours ago
US Macro Setup To Favour New Bitcoin ATH In The Long Run
-
 Market23 hours ago
SEC Reconsiders Howey Test Use in Crypto Oversight
-

 Bitcoin22 hours ago
Altseason Dead On Arrival? Data Shows Bitcoin Outperforming All Categories
-
 Altcoin15 hours ago
Expert Reveals Decentralized Strategy To Stabilize Pi Network Price
-

 Market21 hours ago
Conor McGregor’s Crypto Token REAL Tanks After Launch
-

 Market20 hours ago
Celestia (TIA) Price’s 30% Crash Prolonging Could Bring Recovery
-

 Market19 hours ago
Ripple Highlights UK’s Potential to Become Global Crypto Hub