
Market
Top Altcoin Gainers in the Past Seven Days

The week so far has been marked by an uptrend in the altcoin market, with many crypto assets reaching new milestones.
JasmyCoin (JASMY), Wormhole (W), and Toncoin (TON) are some of the top altcoins with the highest gains in the past seven days.
JasmyCoin (JASMY) Rallies to a Two-Year High
In the past seven days, the price per JasmyCoin (JASMY) has risen by 46%. Exchanging hands at $0.043 at press time, the altcoin currently trades at a price level last observed in March 2022.
Following an extended trending period within a range, with a relative balance between buying and selling pressures, the bulls emerged dominant on May 14. JASMY’s Elder-Ray Index confirmed this as it has since returned positive values (marked by green bars) since then.
This indicator identifies the direction of an asset’s price trends and potential buying or selling opportunities in the market. When its value is positive, it is a bullish signal, which suggests that token accumulation outpaces distribution.
As of this writing, JASMY’s Elder-Ray Index was 0.014.
Further, readings from its Moving Average Convergence Divergence (MACD) showed its MACD line (orange) positioned above its signal (blue) and zero lines at press time.
This indicator also measures an asset’s price trends and potential changes in direction. It is considered a bullish signal when its lines are set up this way, as buying momentum is higher than selling pressure.
If this trend is maintained, JASMY’s value may rally to exchange hands at $0.055, a price it last traded at on March 18, 2022.
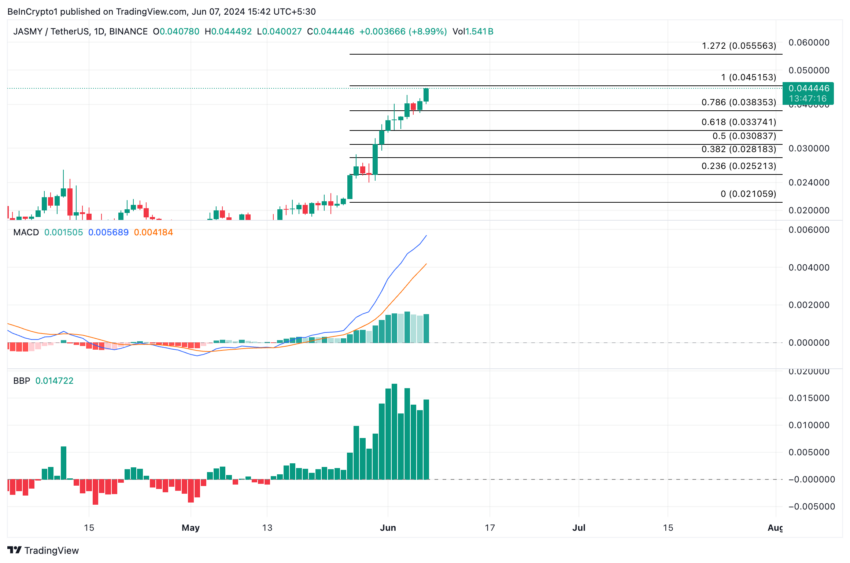
However, if buyer exhaustion sets in, the token’s value may fall to $0.058
Wormhole (W) Puts Holders in Profit
W, the native token of the cross-chain bridge Wormhole, has seen its value climb by 30% in the past seven days. That period also saw a significant spike in the token’s daily trading volume. For example, at press time, W’s trading volume totaled $238 million, its highest in over 30 days.
W’s positive Chaikin Money Flow (CMF) buttresses the point above, confirming the uptick in capital inflow into the W market. As of this writing, the indicator’s value was 0.03.
W’s CMF tracks how money flows into and out of the market. With a CMF value above zero, the W market sees more liquidity inflow than capital outflows. This bullish signal is interpreted as a sign that altcoin will continue its uptrend.
If this continues, W might surge to exchange hands at $0.68 if this continues.
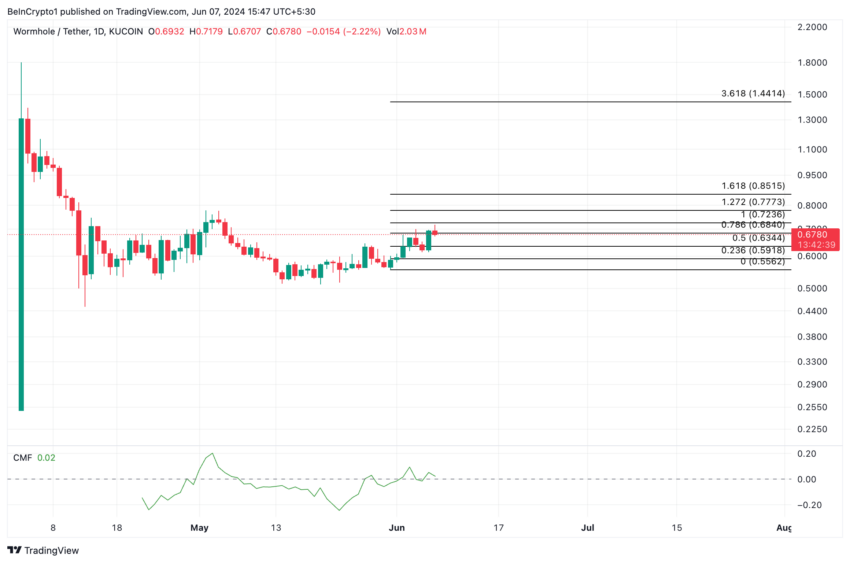
However, if invalidated, it will dip to sell at $0.63.
Toncoin (TON) Reaches For Resistance
Rising by 16% in the past seven days, Toncoin (TON) is attempting to break above the upper line of its ascending channel. It has trended within this channel since May 2.
An ascending channel forms when an asset’s price consistently makes higher highs and higher lows over a period of time. The channel typically indicates a bullish trend, which suggests that buyers are in control and the asset’s price is likely to continue rising.
The fact that TON trades above its 20-day Exponential Moving Average lends credence to this. This moving average tracks an asset’s average price over the past 20 days.
When the price trades above it, it means that the current value of an asset is higher than its average price in the past 20 days. This bullish sign shows buying activity is higher than selling pressure.
If TON bulls maintain this trend, the token’s price might rally past $7.74 and toward a new all-time high at $7.80.
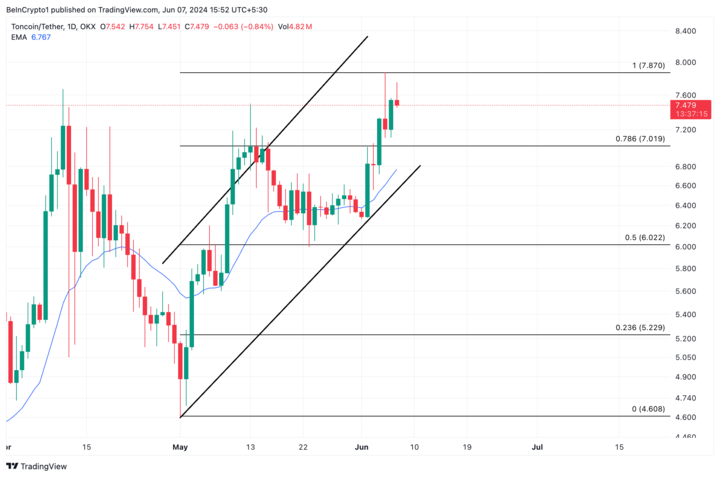
However, if they fail and allow the bears to regain control, selling pressure may push the altcoin’s value down to $7.01.
Disclaimer
In line with the Trust Project guidelines, this price analysis article is for informational purposes only and should not be considered financial or investment advice. BeInCrypto is committed to accurate, unbiased reporting, but market conditions are subject to change without notice. Always conduct your own research and consult with a professional before making any financial decisions. Please note that our Terms and Conditions, Privacy Policy, and Disclaimers have been updated.


Stellar (XLM) is down more than 5% on Thursday, with its market capitalization dropping to $8 billion. XLM technical indicators are flashing strong bearish signals, suggesting continued downward momentum that could test critical support levels around $0.22.
While a reversal scenario remains possible with resistance targets at $0.27, $0.29, and $0.30, such an upside move would require a substantial shift in market sentiment.
XLM RSI Shows Sellers Are In Control
Stellar’s Relative Strength Index (RSI) has dropped sharply to 38.99, down from 59.54 just two days ago—signaling a notable shift in momentum.
The RSI is a widely used momentum oscillator that measures the speed and magnitude of recent price changes, typically ranging between 0 and 100.
Readings above 70 suggest overbought conditions, while levels below 30 indicate oversold territory. A reading between 30 and 50 often reflects bearish momentum but is not yet extreme enough to trigger an immediate reversal.
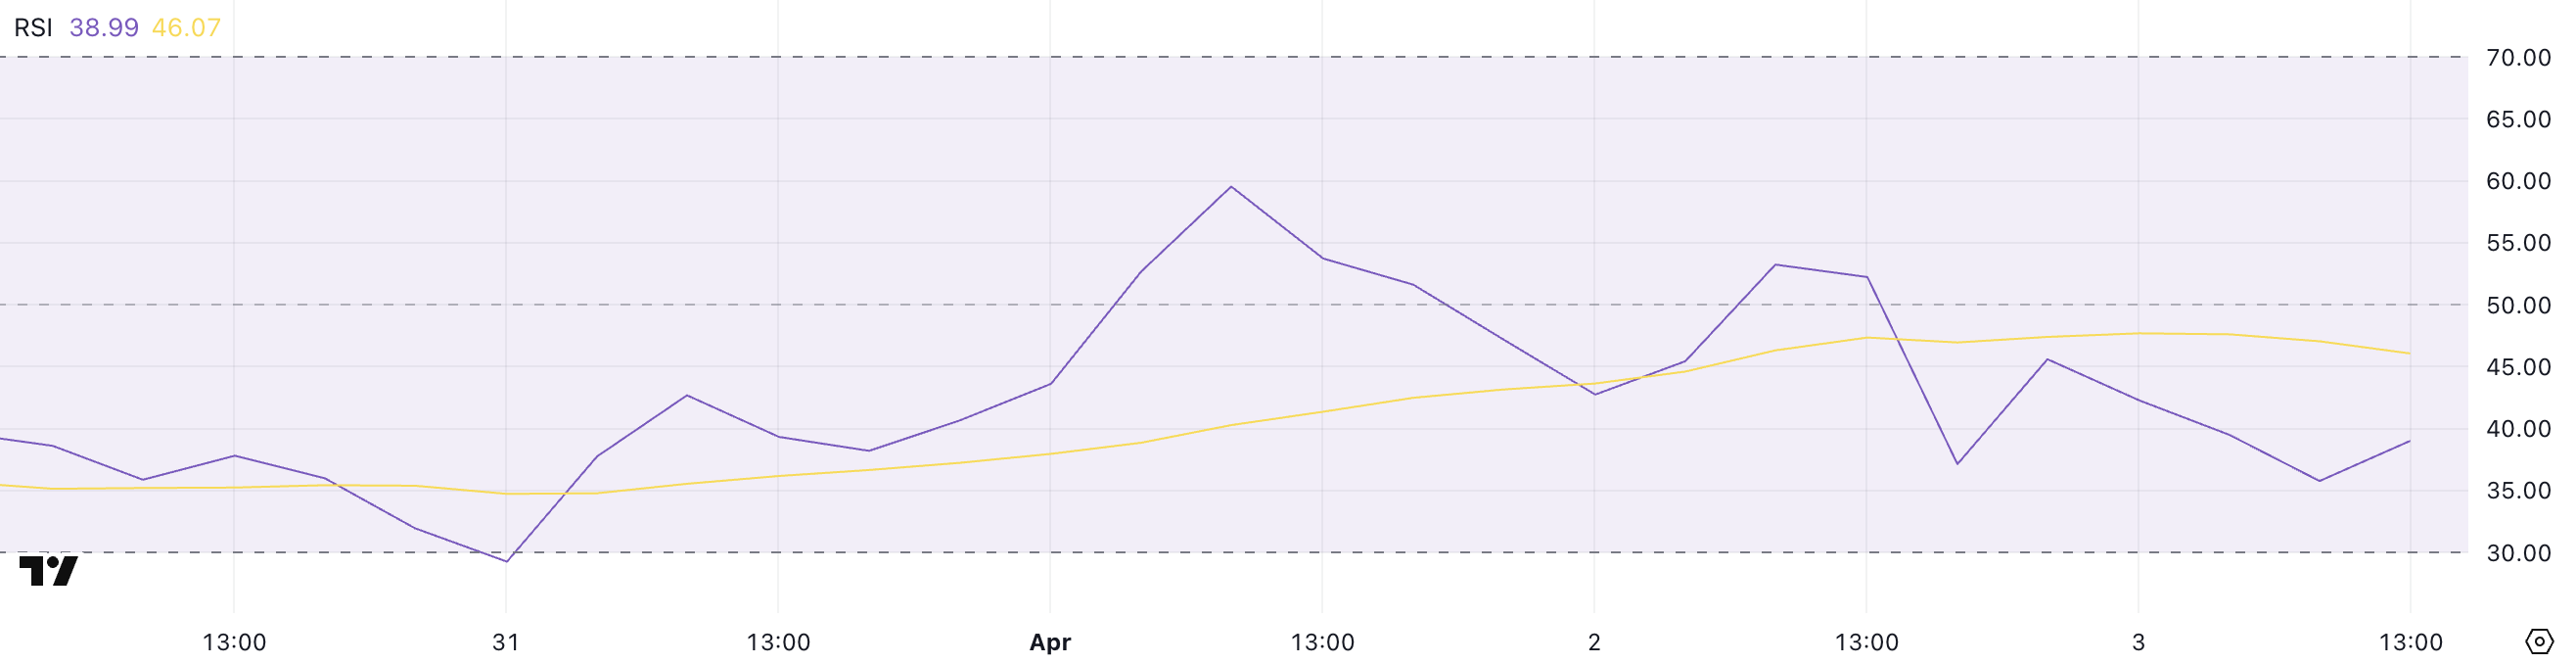
With Stellar’s RSI now below the key midpoint of 50 and approaching the oversold threshold, the current reading of 38.99 suggests that sellers are gaining control.
While it’s not yet in oversold territory, it does signal weakening buying pressure and increasing downside risk.
If the RSI continues to fall, XLM could face further price declines unless buyers step in soon to stabilize the trend and prevent a slide into more deeply oversold levels.
Stellar CMF Heavily Dropped Since April 1
Stellar’s Chaikin Money Flow (CMF) has plunged to -10, a sharp decline from 0.19 just two days ago, signaling a significant shift in capital flow dynamics.
The CMF is an indicator that measures the volume-weighted average of accumulation and distribution over a set period—essentially tracking whether money is flowing into or out of an asset.
Positive values suggest buying pressure and accumulation, while negative values point to selling pressure and capital outflow.
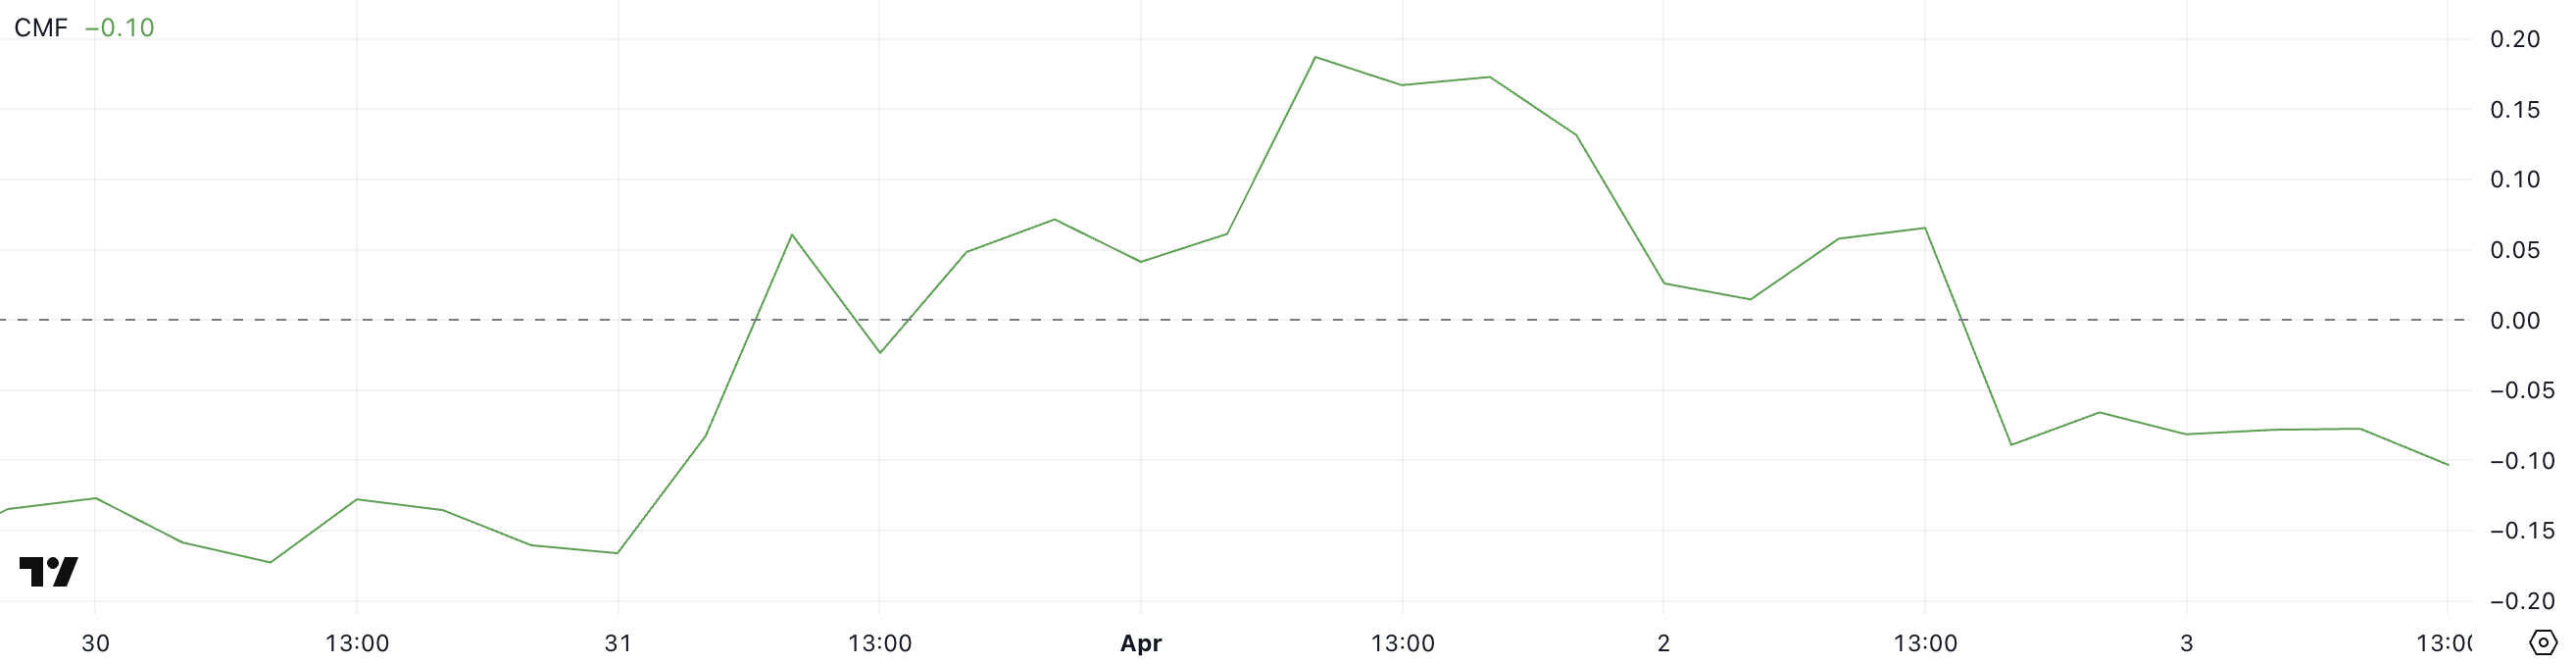
With XLM’s CMF now deep in negative territory at -10, it indicates that sellers are firmly in control and substantial capital is leaving the asset.
This level of negative flow can put downward pressure on price, especially if it aligns with other bearish technical signals. Unless buying volume returns to offset this outflow, XLM could continue to weaken in the near term.
Will Stellar Fall To Five-Month Lows?
Stellar price action presents concerning signals as EMA indicators point to a strong bearish trend with significant downside potential.
Technical analysis suggests this downward momentum could push XLM to test critical support around $0.22. It could breach this level and fall below the psychologically important $0.20 threshold—a price not seen since November 2024.
This technical deterioration warrants caution from traders and investors as selling pressure appears to be intensifying.
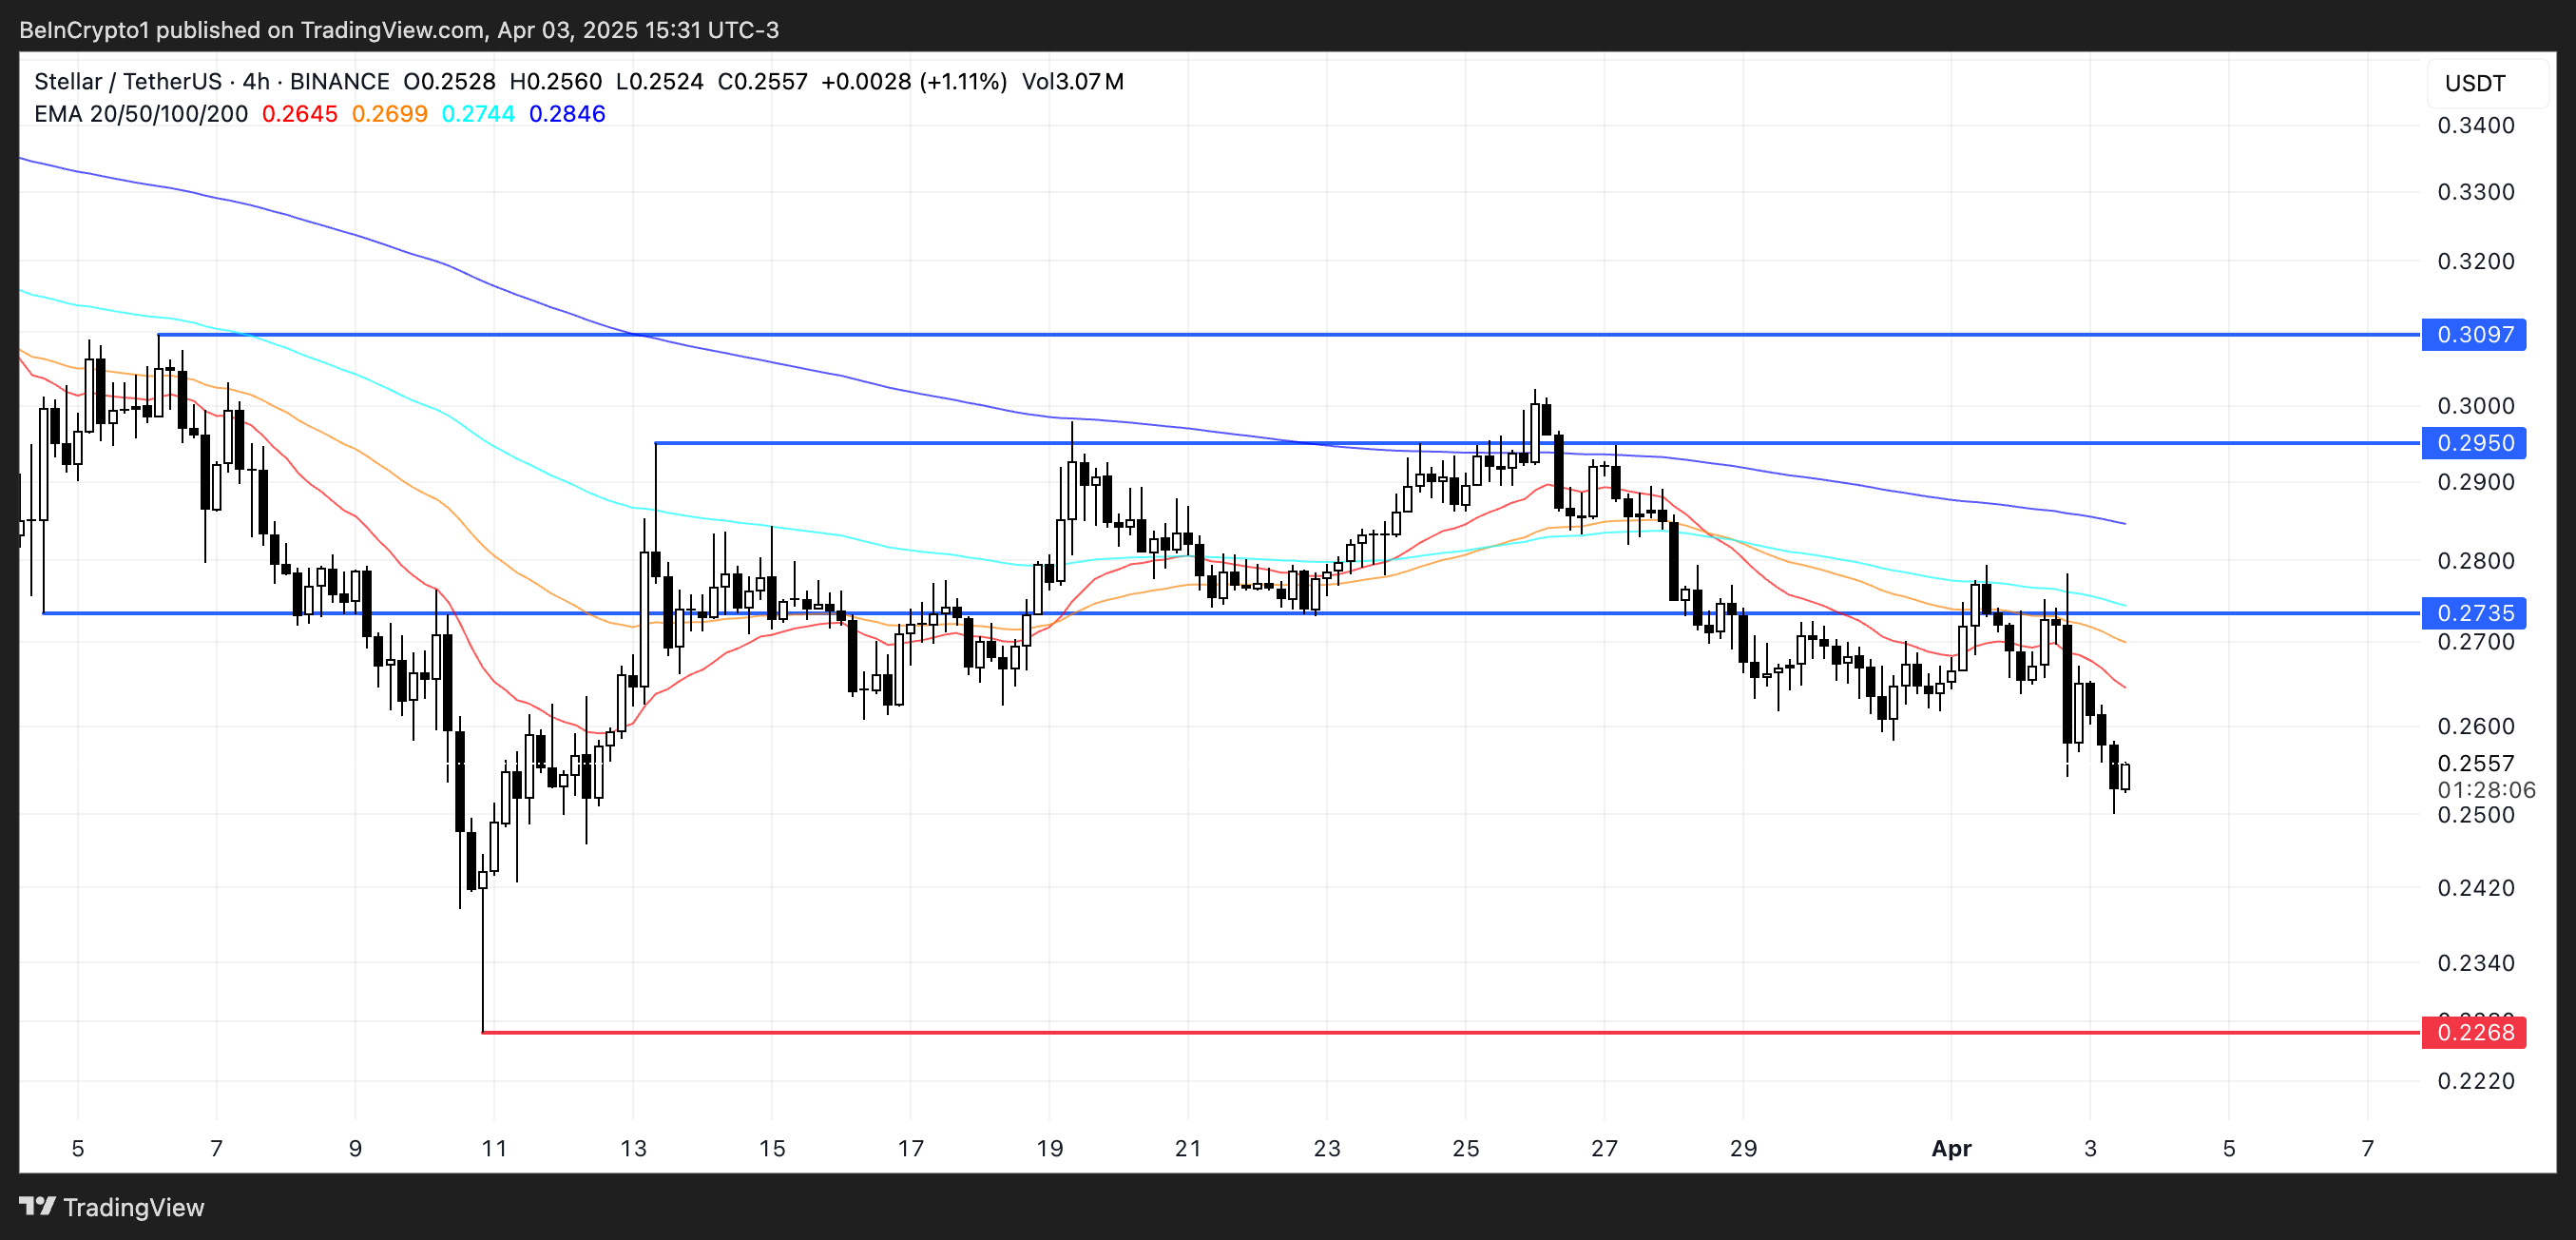
Conversely, a trend reversal scenario would require a substantial shift in market sentiment. Should bulls regain control, XLM could challenge the immediate resistance at $0.27, with further upside targets at $0.29 and the key $0.30 level.
However, this optimistic outlook faces considerable obstacles, as only a dramatic sentiment shift coupled with the emergence of a powerful uptrend would enable such a recovery.
Until clearer bullish signals manifest, the prevailing technical structure continues to favor the bearish case.
Disclaimer
In line with the Trust Project guidelines, this price analysis article is for informational purposes only and should not be considered financial or investment advice. BeInCrypto is committed to accurate, unbiased reporting, but market conditions are subject to change without notice. Always conduct your own research and consult with a professional before making any financial decisions. Please note that our Terms and Conditions, Privacy Policy, and Disclaimers have been updated.

Solana (SOL) is under heavy pressure, with its price down more than 10% in the last 24 hours as bearish momentum intensifies across key indicators. The Ichimoku Cloud, BBTrend, and price structure all point to continued downside risk, with SOL now hovering dangerously close to critical support levels.
Technical signals show sellers firmly in control, while the widening gap from resistance zones makes a near-term recovery increasingly difficult.
Solana’s Ichimoku Cloud chart is currently flashing strong bearish signals. The price has sharply broken below both the Tenkan-sen (blue line) and Kijun-sen (red line), confirming a clear rejection of short-term support levels.
Both of these lines are now angled downward, reinforcing the view that bearish momentum is gaining strength.
The sharp distance between the latest candles and the cloud further suggests that any recovery would face significant resistance ahead.
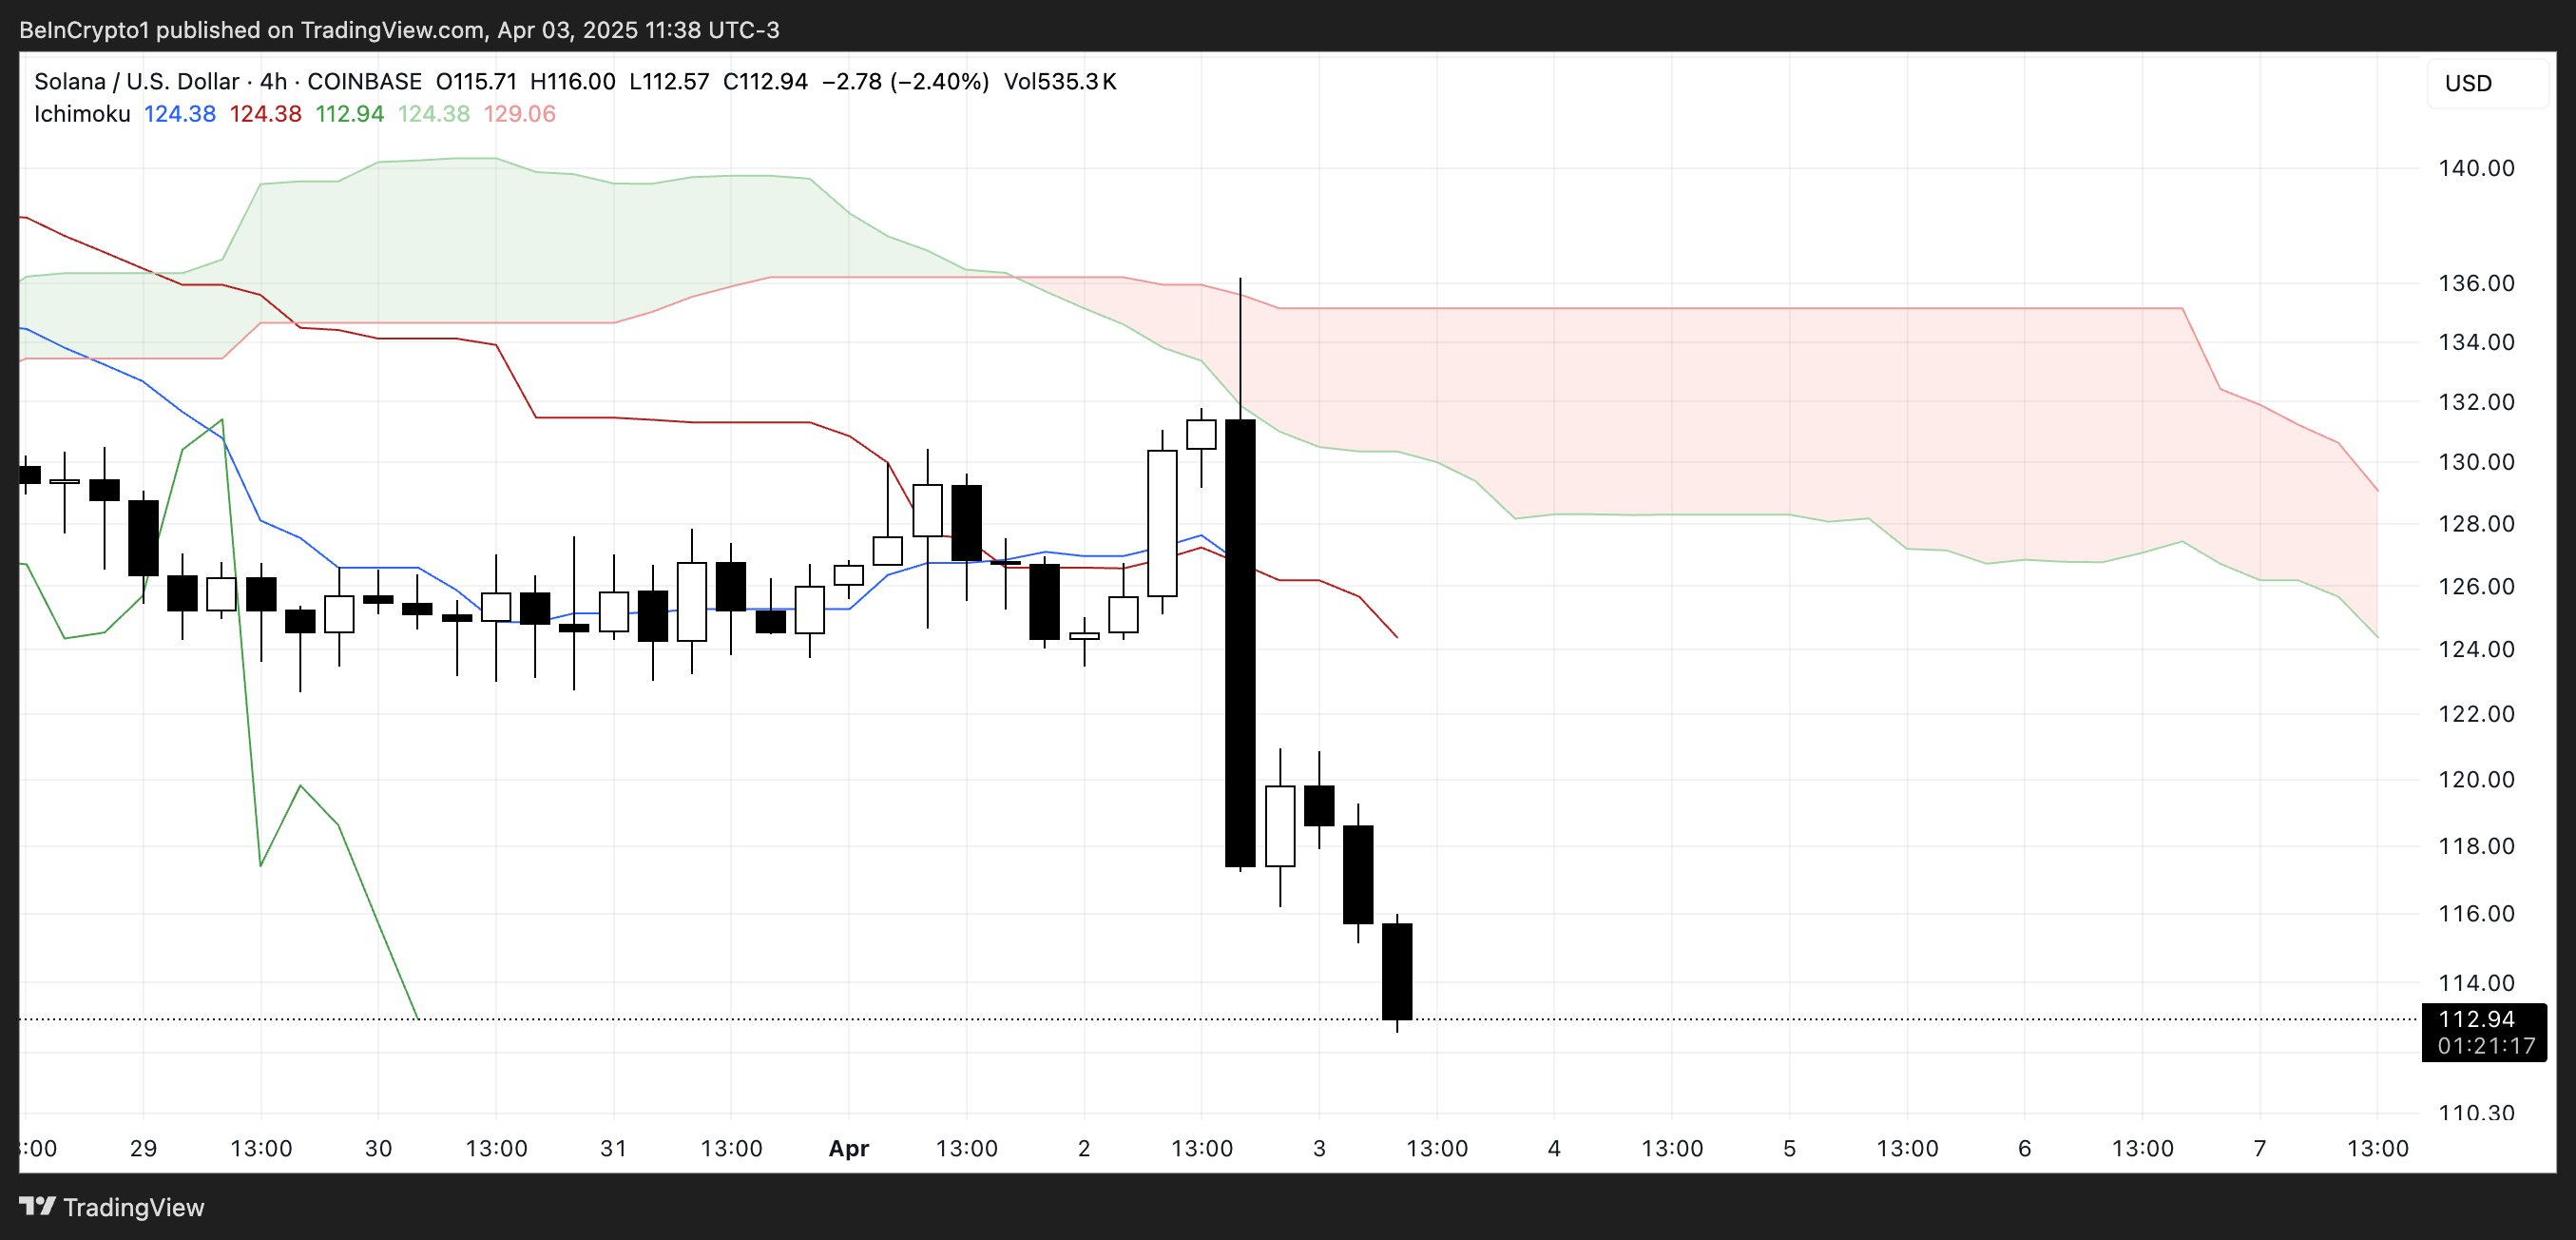
Looking at the Kumo (cloud) itself, the red cloud projected forward is thick and sloping downward, indicating that bearish pressure is expected to persist in the coming sessions.
The price is well below the cloud, which typically means the asset is in a strong downtrend.
For Solana to reverse this trend, it would need to reclaim the Tenkan-sen and Kijun-sen and push decisively through the entire cloud structure—an outcome that looks unlikely in the short term, given the current momentum and cloud formation.
Solana’s BBTrend Signals Prolonged Bearish Momentum
Solana’s BBTrend indicator currently sits at -6, having remained in negative territory for over five consecutive days. Just two days ago, it hit a bearish peak of -12.72, showing the strength of the recent downtrend.
Although it has slightly recovered from that low, the sustained negative reading signals that selling pressure remains firmly in control and that the bearish momentum hasn’t yet been reversed.
The BBTrend (Bollinger Band Trend) measures the strength and direction of a trend using Bollinger Bands. Positive values suggest bullish conditions and upward momentum, while negative values indicate bearish trends.
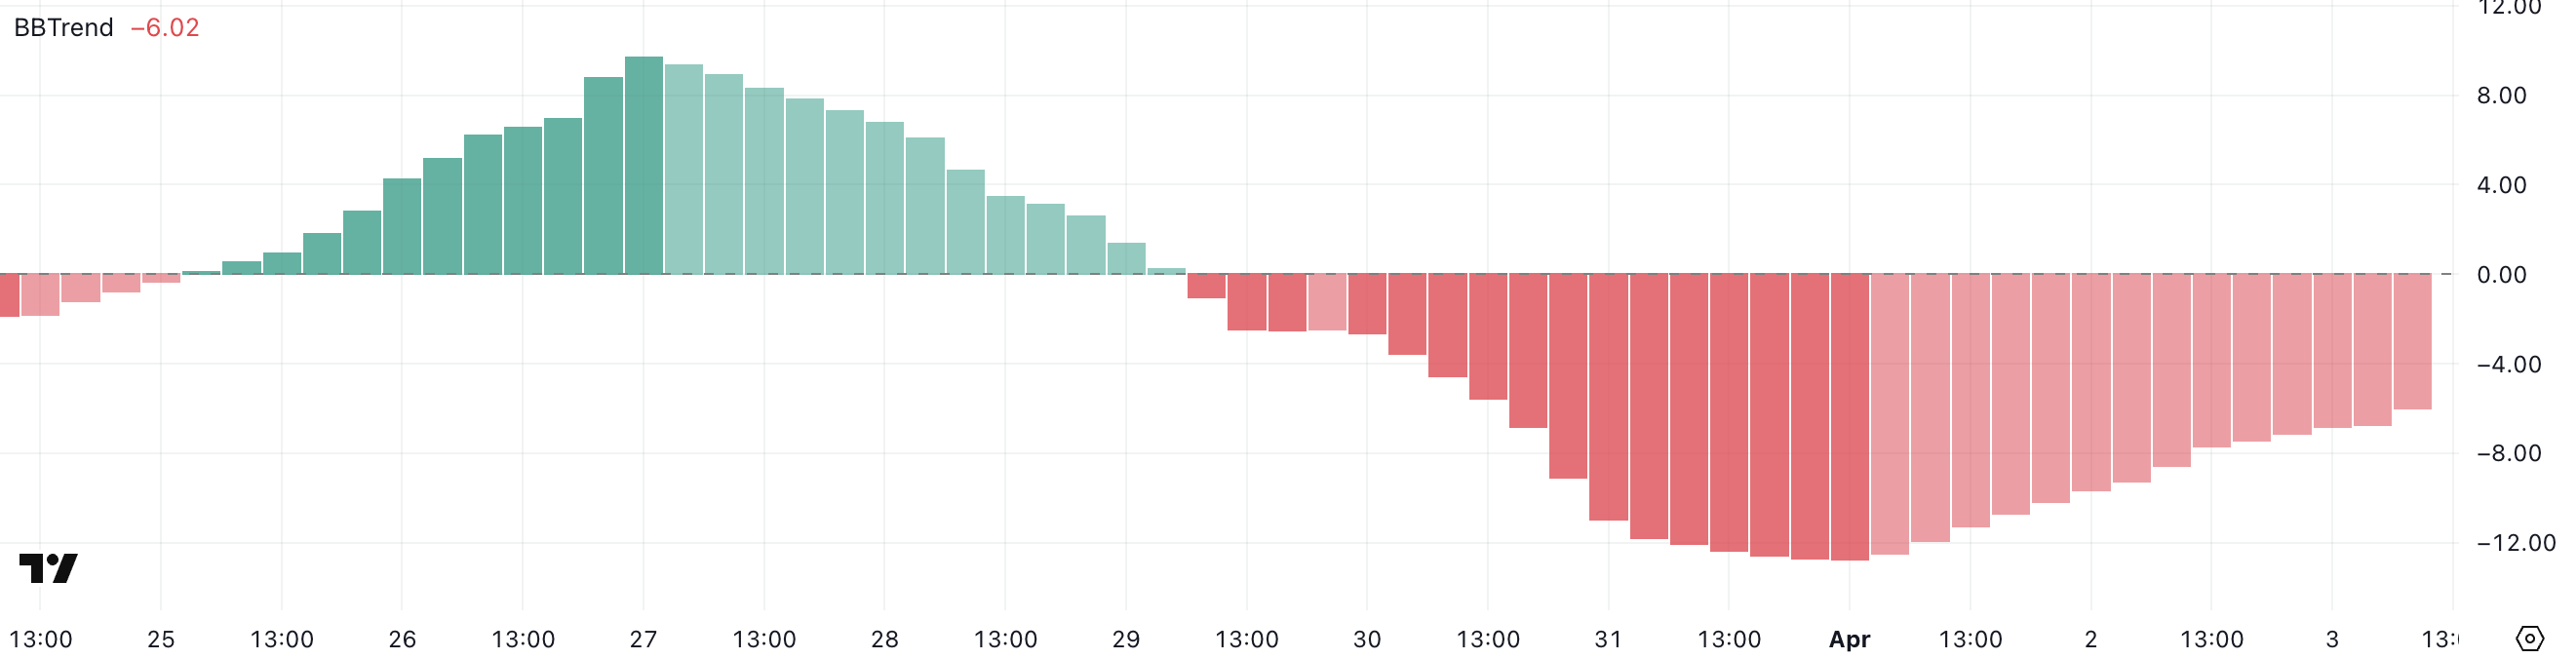
Generally, values beyond 5 are considered strong trend signals. With Solana’s BBTrend still well below -5, it implies that downside risk remains elevated.
Unless a sharp shift in momentum occurs, this persistent bearish reading may continue to weigh on SOL’s price in the near term.
Solana Eyes $112 Support as Bears Test February Lows
Solana’s price has broken below the key $115 level, and the next major support lies around $112. A confirmed move below this threshold could trigger further downside. That could potentially push the price under $110 for the first time since February 2024.
The recent momentum and strong bearish indicators suggest sellers remain in control, increasing the likelihood of testing these lower support levels in the near term.
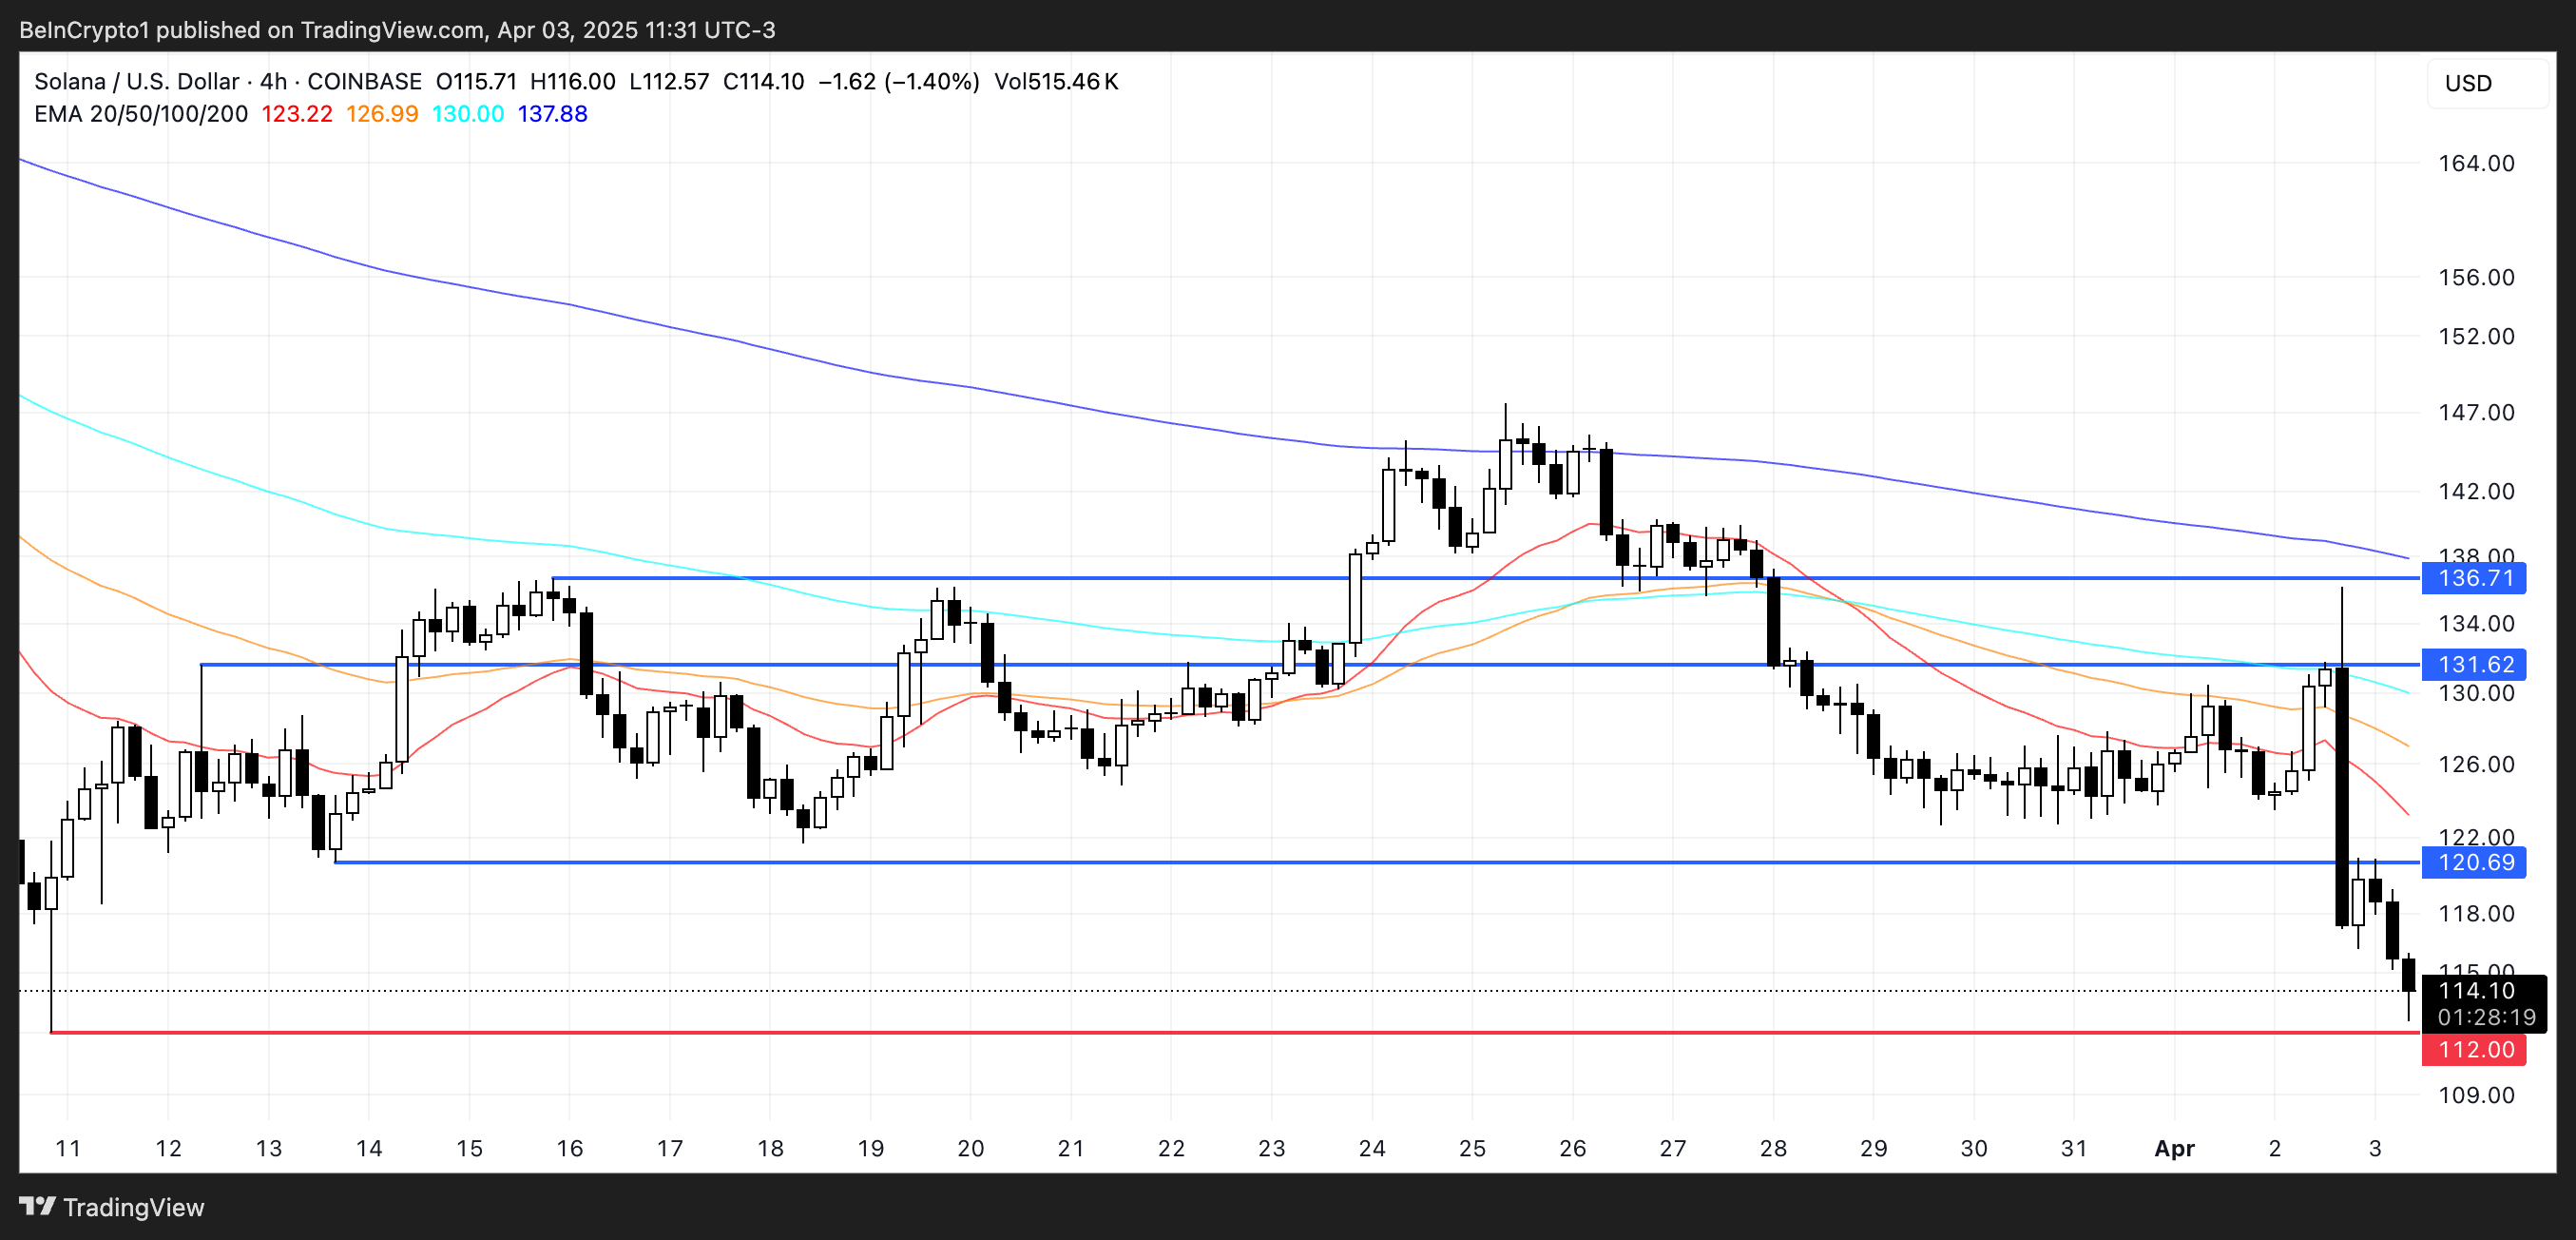
However, if Solana manages to stabilize and reverse its current trajectory, a rebound toward the $120 resistance level could follow.
Breaking above that would be the first sign of recovery, and if bullish momentum accelerates, SOL price could aim for higher targets at $131 and $136.
Disclaimer
In line with the Trust Project guidelines, this price analysis article is for informational purposes only and should not be considered financial or investment advice. BeInCrypto is committed to accurate, unbiased reporting, but market conditions are subject to change without notice. Always conduct your own research and consult with a professional before making any financial decisions. Please note that our Terms and Conditions, Privacy Policy, and Disclaimers have been updated.
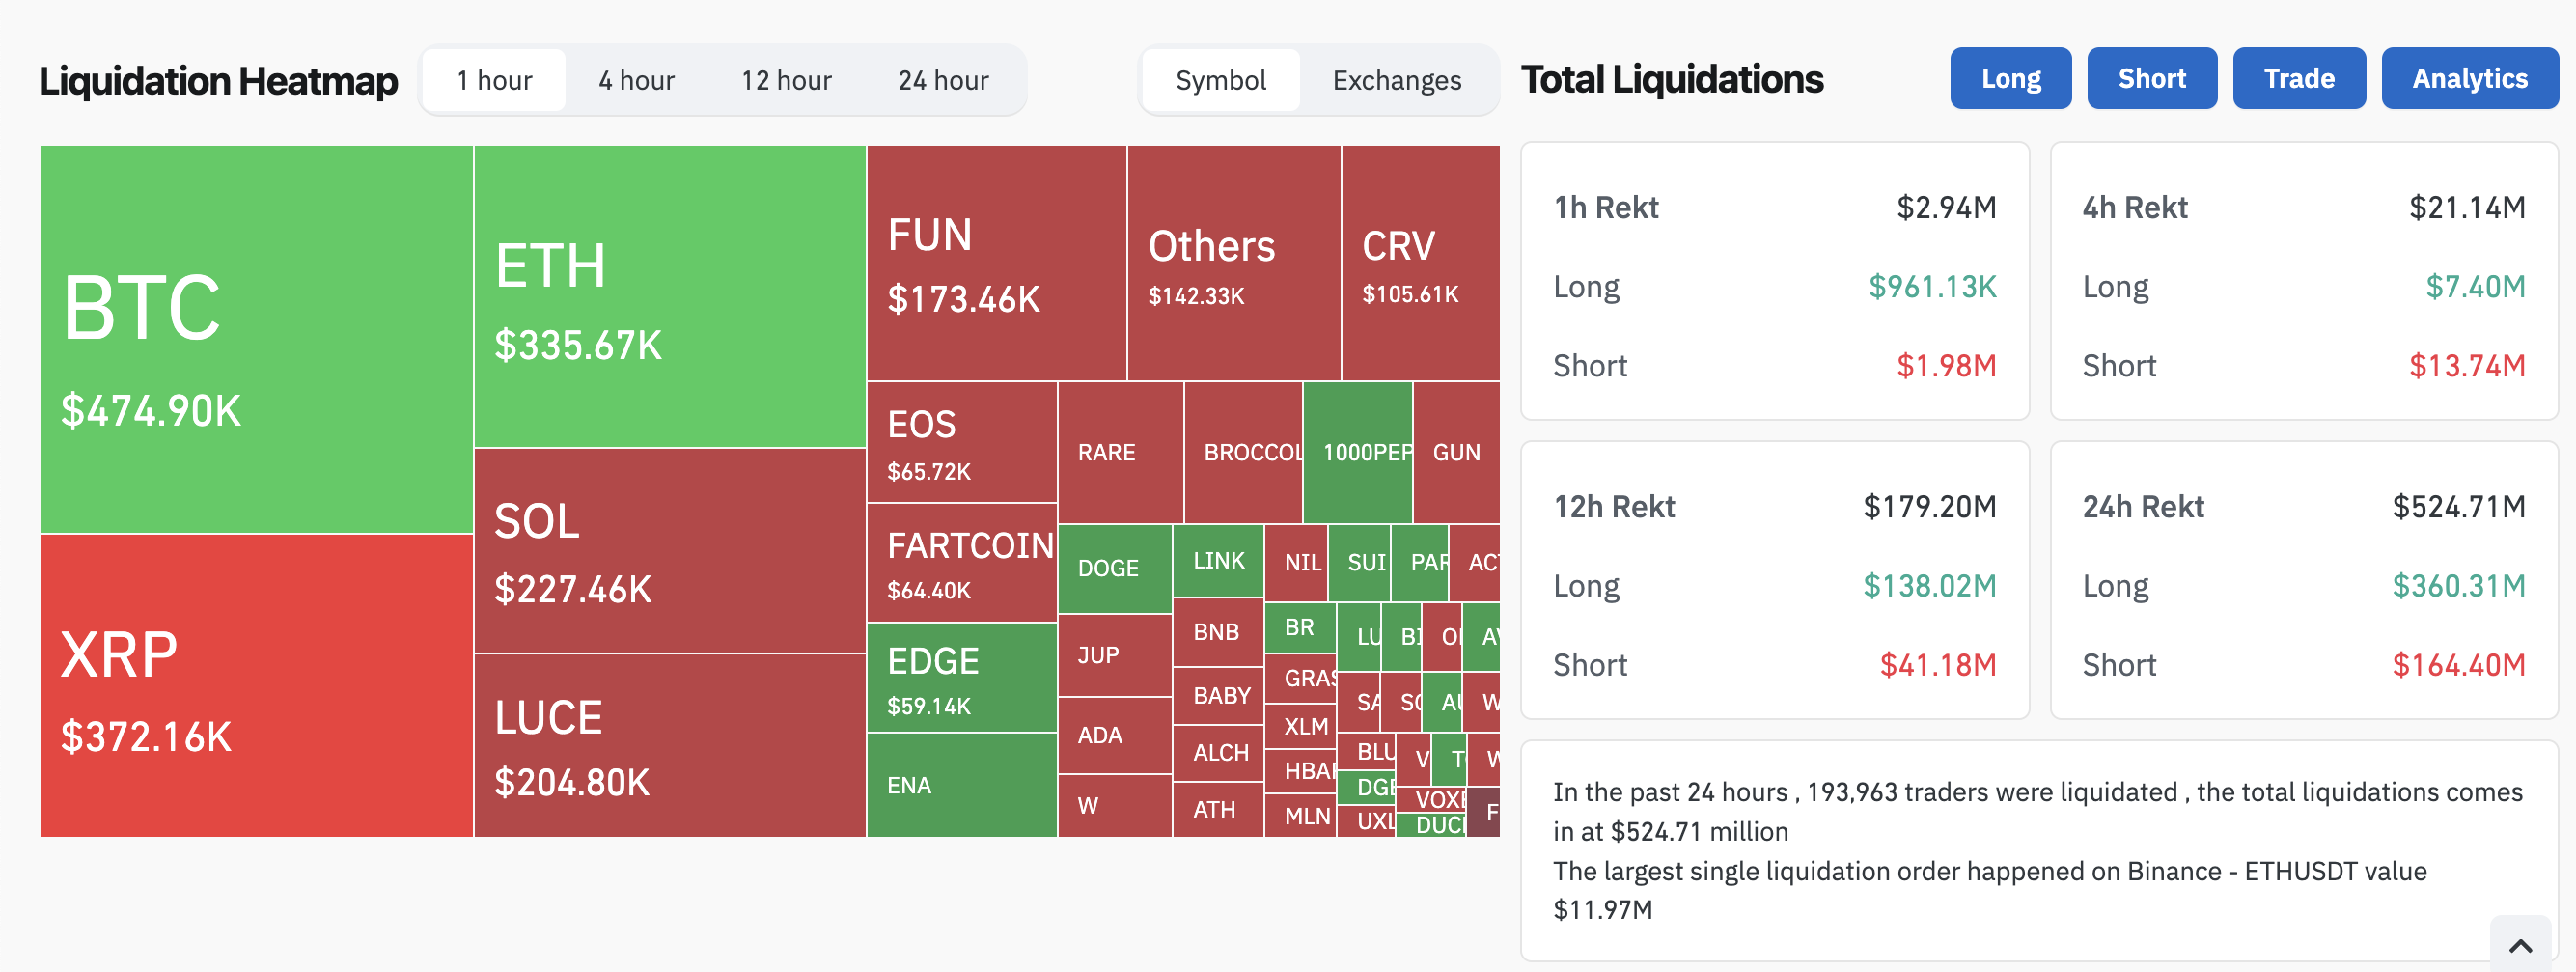
As traditional markets show clear signs of an impending recession, the crypto space is not immune from damage. Liquidations are surging as the overall crypto market cap mirrors declines in the stock market.
Even though the source of these problems is localized to the US, the damage will have global implications. Traders are advised to prepare for a sustained period of trouble.
How Will A Recession Impact Crypto?
Several economic experts have warned that the US market is poised for an impending recession. For all we know, it’s already here.
Since Donald Trump announced his Liberation Day tariffs, all financial markets have taken a real hit. The overall crypto market cap is down nearly 8%, and liquidations in the last 24 hours exceeded $500 million.
A few other key indicators show a similar trend. In late February, the Crypto Fear and Greed Index was at “Extreme Fear.” It recovered in March but fell back down to this category today.
Similarly, checkers adjacent to crypto, such as Polymarket, began predicting that a recession is more likely than not.
Although the crypto industry is closely tied to President Trump’s administration, it is not the driving force behind these recession fears. Indeed, crypto actually seems to be tailing TradFi markets at the moment.
The Dow dropped 1600 points today, and the NASDAQ and S&P 500 both had their worst single-day drops since at least 2020.
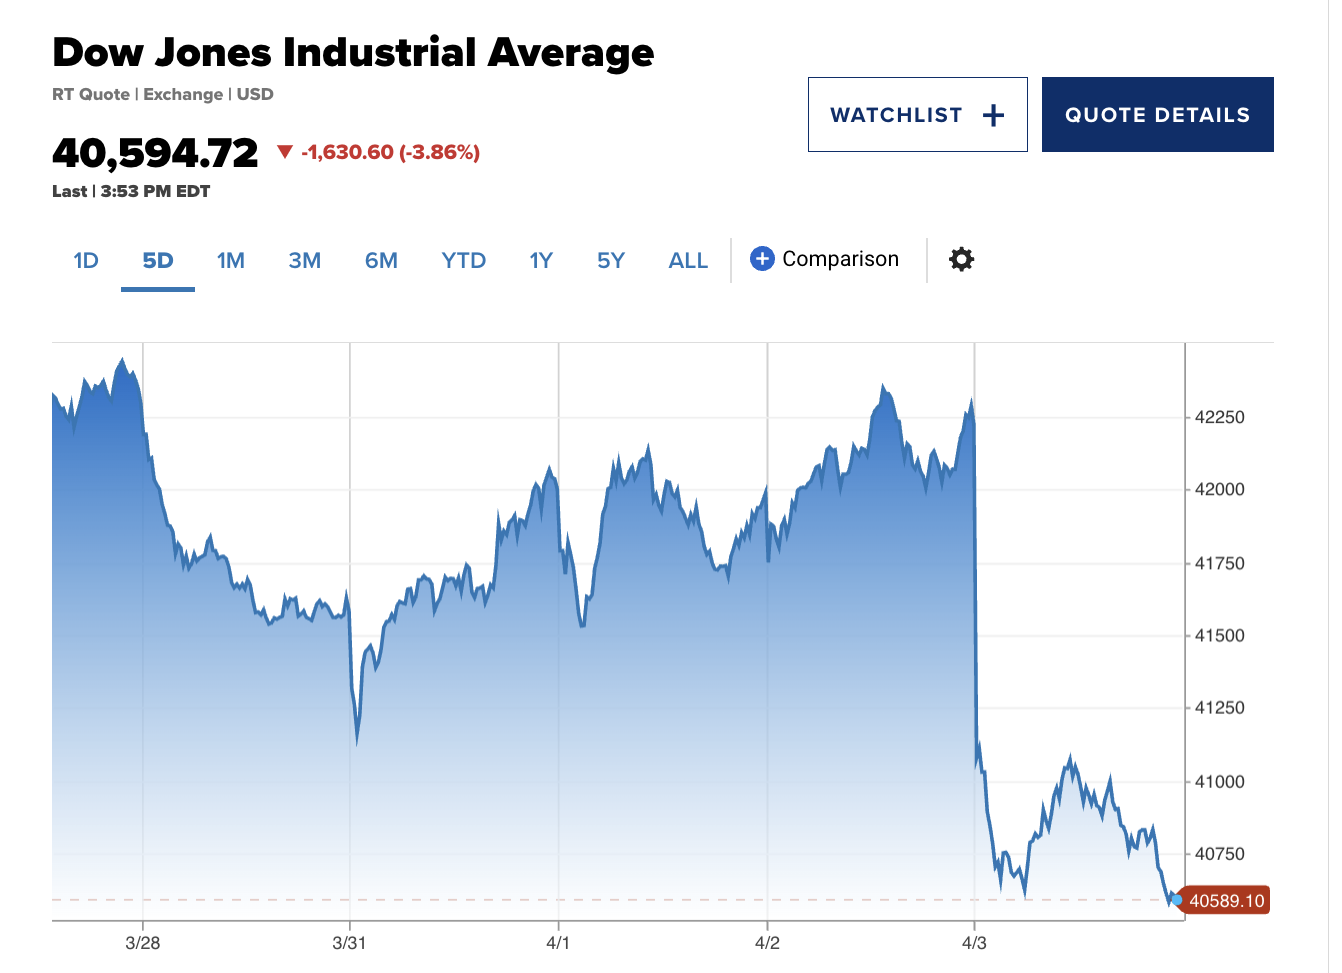
Amidst all these recession fears, it’s been hard to identify an upside for crypto. Bitcoin briefly looked steady, but it fell more than 5% in the last 24 hours.
This doesn’t necessarily reflect its status as a secure store of value, as gold also looked steady before crumbling. To be fair, though, gold has only fallen 1.2% today.
In this environment, crypto enthusiasts worldwide should consider preparing for a recession. Trump’s proposed tariffs dramatically exceeded the worst expectations, and the resultant crisis is centered around the US.
Overall, current projections show that the crypto market will mirror the stock market to some extent. If the Nasdaq and S&P 500 fall further, the implications for risk assets could worsen.
Disclaimer
In adherence to the Trust Project guidelines, BeInCrypto is committed to unbiased, transparent reporting. This news article aims to provide accurate, timely information. However, readers are advised to verify facts independently and consult with a professional before making any decisions based on this content. Please note that our Terms and Conditions, Privacy Policy, and Disclaimers have been updated.

Stellar (XLM) Falls 5% as Bearish Signals Strengthen

Why ETF Issuers are Buying Bitcoin Despite Recession Fears

Solana (SOL) Crashes 11%—Is More Pain Ahead?
Expert Reveals XRP Price Could Drop To $1.90 Before Rally To New Highs

Crypto Market Mirrors Nasdaq and S&P 500 Amid Recession Fears

Here’s Why Is Shiba Inu Price Crashing Daily?

2.52 Million Altcoins Are Ruining Crypto’s Future

Animoca Brands Valuation Tanks 75% In Two Years, Here’s Why

Crypto exchange BingX hacked for $43 million

Are The Big Players Losing Interest?

Hong Kong’s Securities Association Tips Authorities On Crypto Self-Regulation

Coinbase cbBTC Set to go Live on Solana
2.52 Million Altcoins Are Ruining Crypto’s Future
Animoca Brands Valuation Tanks 75% In Two Years, Here’s Why
Crypto exchange BingX hacked for $43 million
Are The Big Players Losing Interest?
Hong Kong’s Securities Association Tips Authorities On Crypto Self-Regulation
Coinbase cbBTC Set to go Live on Solana
-
 Altcoin23 hours ago
Binance Sidelines Pi Network Again In Vote To List Initiative, Here’s All
-
 Altcoin20 hours ago
Analyst Forecasts 250% Dogecoin Price Rally If This Level Holds
-

 Market23 hours ago
XRP Price Reversal Toward $3.5 In The Works With Short And Long-Term Targets Revealed
-

 Market20 hours ago
XRP Price Under Pressure—New Lows Signal More Trouble Ahead
-

 Market15 hours ago
IP Token Price Surges, but Weak Demand Hints at Reversal
-

 Market19 hours ago
Cardano (ADA) Downtrend Deepens—Is a Rebound Possible?
-
 Altcoin17 hours ago
VanEck Seeks BNB ETF Approval—Big Win For Binance?
-

 Market11 hours ago
Bitcoin’s Future After Trump Tariffs