
Market
Strong Technicals and Transactions Up

NEAR is currently trading at just 17% below its local high of $9, which was reached in mid-March.
The price has rebounded impressively by 72% from the local low experienced in mid-April, demonstrating strong price action and a potential trajectory toward reclaiming the $9 mark.
NEAR: Technical Chart Analysis
This analysis will highlight the current support and resistance levels and explore the implications of transactional data trends for Near Protocol’s price movements.
On the daily chart, NEAR is positioned above both the 100 EMA (blue) and the 200 EMA (green). The 100 EMA sits at $6.54, while the 200 EMA is at $5.32, and they provide strong support levels.
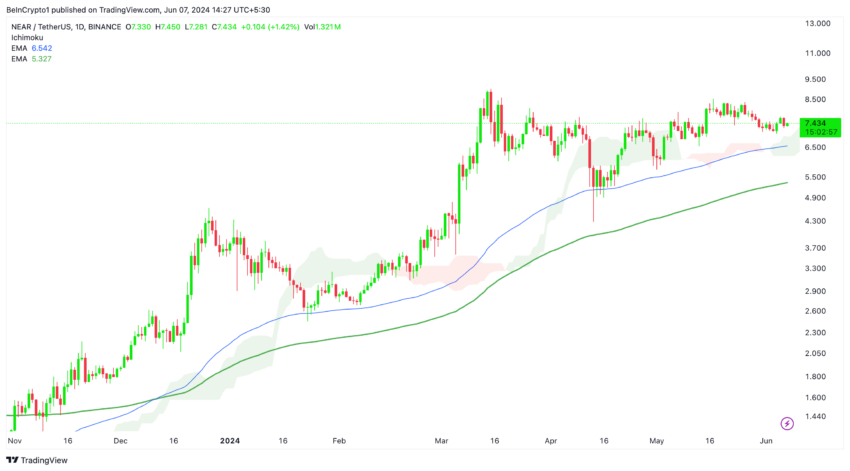
The Ichimoku Cloud on the daily chart acts as a support zone. The price has stayed above the cloud, signaling that the overall trend remains upward.
Read More: What Is NEAR Protocol (NEAR)?
The cloud serves as a dynamic support area, reinforcing the support offered by the EMAs. The bullish outlook is supported as long as the price remains above the cloud and these EMAs.
The price falling below the Ichimoku Cloud could indicate a potential price reversal. Exercise caution in such a bearish scenario.
The 4-hour chart offers a slightly different perspective for the short to mid-term.
This time, the Ichimoku Cloud is acting as resistance. The price is currently testing the lower boundary of the cloud, suggesting some selling pressure at this level. The 100 EMA on the 4-hour chart is $7.50, while the 200 EMA is $7.41. The price hovers around these levels, indicating a potential standoff between buyers and sellers.
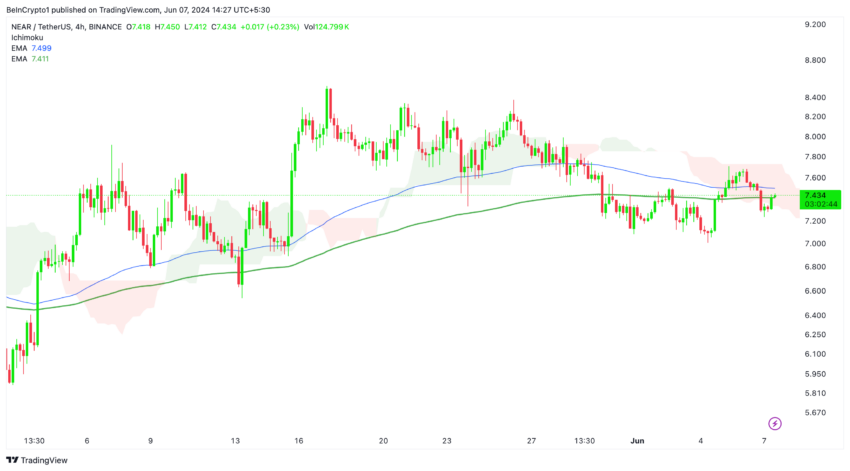
The price needs to break above the 4-hour Ichimoku Cloud decisively for continued upward movement. A successful breakout would indicate a shift in momentum back to the bulls, with resistance levels from the daily chart as the next targets.
However, if the price fails to move above the cloud, it may lead to a period of consolidation or a pullback to the current resistance levels indicated by the 100 and 200 EMAs.
Daily Transaction Volume Decrease on the Near Protocol
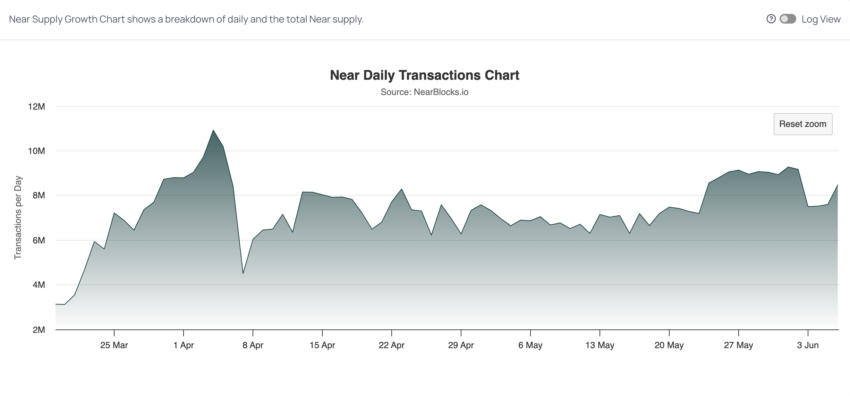
Near’s daily transactions have been experiencing important volatility, with significant drops observed in early April and late May.
During May, daily transactions stabilized at around 6 million. Notably, in late May, there was a significant drop from 9 million to 7 million, but transactions have since rebounded to 8 million. If this metric continues to rise to 10 million daily transactions, it could indicate a highly bullish trend for Near.
On the other side, Near Protocol’s daily transaction volume has experienced a considerable decline.
Important peaks were observed on May 31 and June 3, both reaching $300 million. However, since the peak on June 3, the transaction volume has dropped significantly to $60 million.
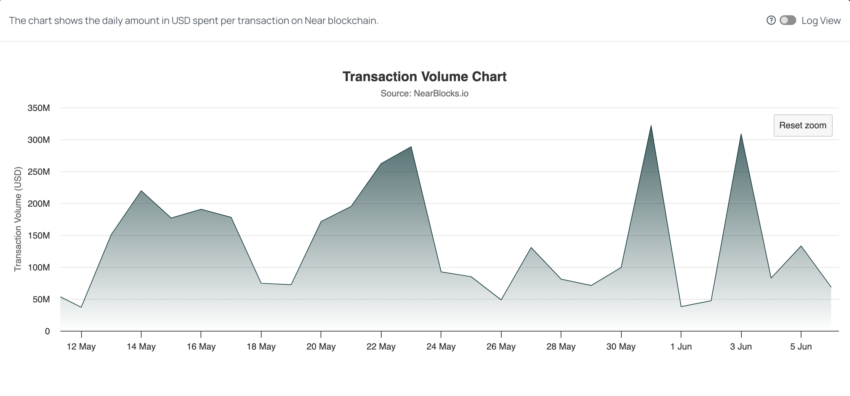
These transaction spikes can indicate rising transactional trends on the Near Protocol, signaling heightened activity and user engagement.
For instance, the peak on June 3rd anticipated a price increase on June 4th, where the value rose from $7.10 to $7.40, marking a 4% increase.
This correlation suggests that transaction volumes could be a leading indicator of price movements.
Strategic Recommendations
Given the current technical setup and transactional trends, NEAR presents promising opportunities for traders and investors.
To capitalize on the bullish outlook:
Consider entering positions near the support levels provided by the 100 EMA and the 200 EMA on the 4H chart. These levels have consistently acted as strong support, indicating active buyer defense.
To manage risk, set stop-loss orders below daily EMAs. This ensures that positions are protected in case of unexpected downside movements.
Read More: Near Protocol (NEAR) Price Prediction for 2024
As long as NEAR remains above the Ichimoku Cloud on the daily chart, maintain a bullish stance. The cloud acts as a dynamic support zone, reinforcing the overall upward trend.
Pay attention to spikes in daily transaction volume, as it can be a precursor to price movements. Significant transaction peaks have previously anticipated price increases.
Disclaimer
In line with the Trust Project guidelines, this price analysis article is for informational purposes only and should not be considered financial or investment advice. BeInCrypto is committed to accurate, unbiased reporting, but market conditions are subject to change without notice. Always conduct your own research and consult with a professional before making any financial decisions. Please note that our Terms and Conditions, Privacy Policy, and Disclaimers have been updated.


Spot Bitcoin exchange-traded funds (ETFs) in the US are nearing a major milestone. They are set to become the biggest BTC holders in the world, even surpassing the amount held by Bitcoin’s creator, Satoshi Nakamoto.
Additionally, they are catching up to gold ETFs in total net assets.
Bitcoin ETFs on The Verge of Surpassing Satoshi Nakamoto’s BTC Stash
Since their launch in January, US spot Bitcoin ETFs have grown significantly. According to crypto analyst HODL15Capital, these funds now hold about 1.081 million Bitcoin, just below Nakamoto’s estimated 1.1 million.
Satoshi Nakamoto, the anonymous creator of Bitcoin, is believed to own approximately 5.68% of the total Bitcoin supply. These holdings, valued at over $100 billion, place Nakamoto among the world’s wealthiest individuals — if they are alive and a single person.
However, Bloomberg’s Senior ETF Analyst, Eric Balchunas, pointed out that ETFs are now 98% of the way to overtaking Nakamoto. He predicted that if the current pace of inflows continues, this could happen by Thanksgiving.
“US spot ETFs now 98% of way there to passing Satoshi as world’s biggest holder. My over/under date of Thanksgiving looking good. If next 3 days are like the past 3 days flow-wise it’s a done deal,” Balchunas stated.
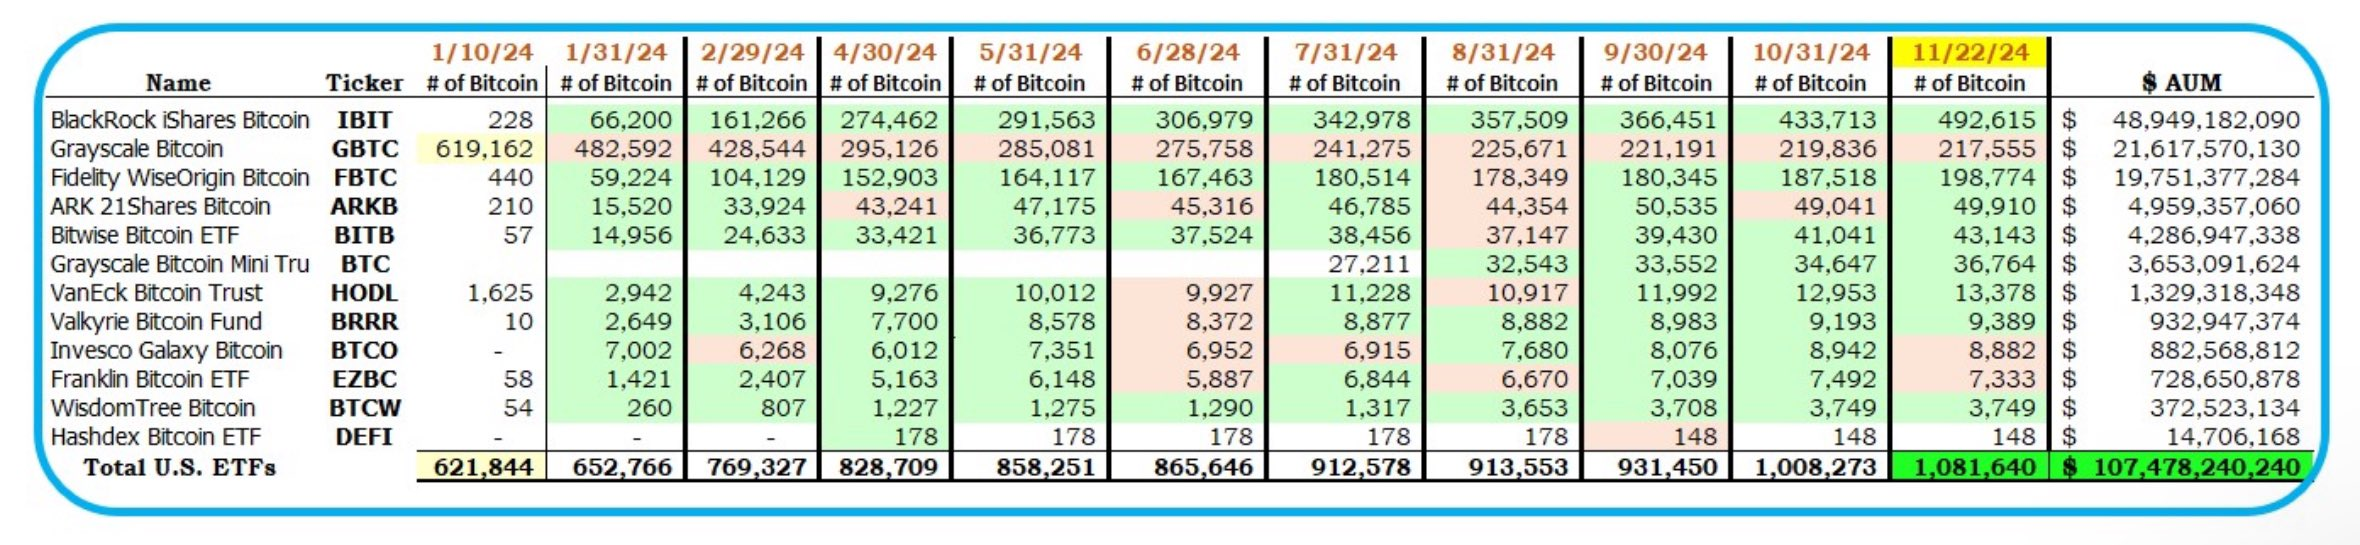
SoSoValue data shows inflows into these ETFs grew by around 97% week-on-week to $3.3 billion over the last five trading days, with BlackRock’s iShares Bitcoin Trust (IBIT) contributing $2 billion. This surge coincides with the introduction of options trading for these products, which many believe is attracting more institutional investors.
Meanwhile, Bitcoin ETFs are also narrowing the gap with gold ETFs, which currently hold $120 billion in assets under management (AUM). According to Balchunas, Bitcoin ETFs manage $107 billion and could overtake gold ETFs by Christmas.
These bullish predictions reflect Bitcoin’s exceptional performance in 2024. The top cryptocurrency has surged nearly 160% since January, trading near the $100,000 landmark. In addition, its $1.91 trillion market capitalization now exceeds that of silver and major corporations like the state-owned oil company Saudi Aramco.
However, BTC still lags behind gold, which remains the world’s largest asset with a market capitalization of more than $18 billion.
Disclaimer
In adherence to the Trust Project guidelines, BeInCrypto is committed to unbiased, transparent reporting. This news article aims to provide accurate, timely information. However, readers are advised to verify facts independently and consult with a professional before making any decisions based on this content. Please note that our Terms and Conditions, Privacy Policy, and Disclaimers have been updated.

Ethereum (ETH) is currently facing significant downward pressure, with its price declining by 3% over the past 24 hours. This bearish trend could push ETH’s price below the critical $3,000 price level.
This analysis examines the factors contributing to this likelihood.
Ethereum Sellers Re-Emerge
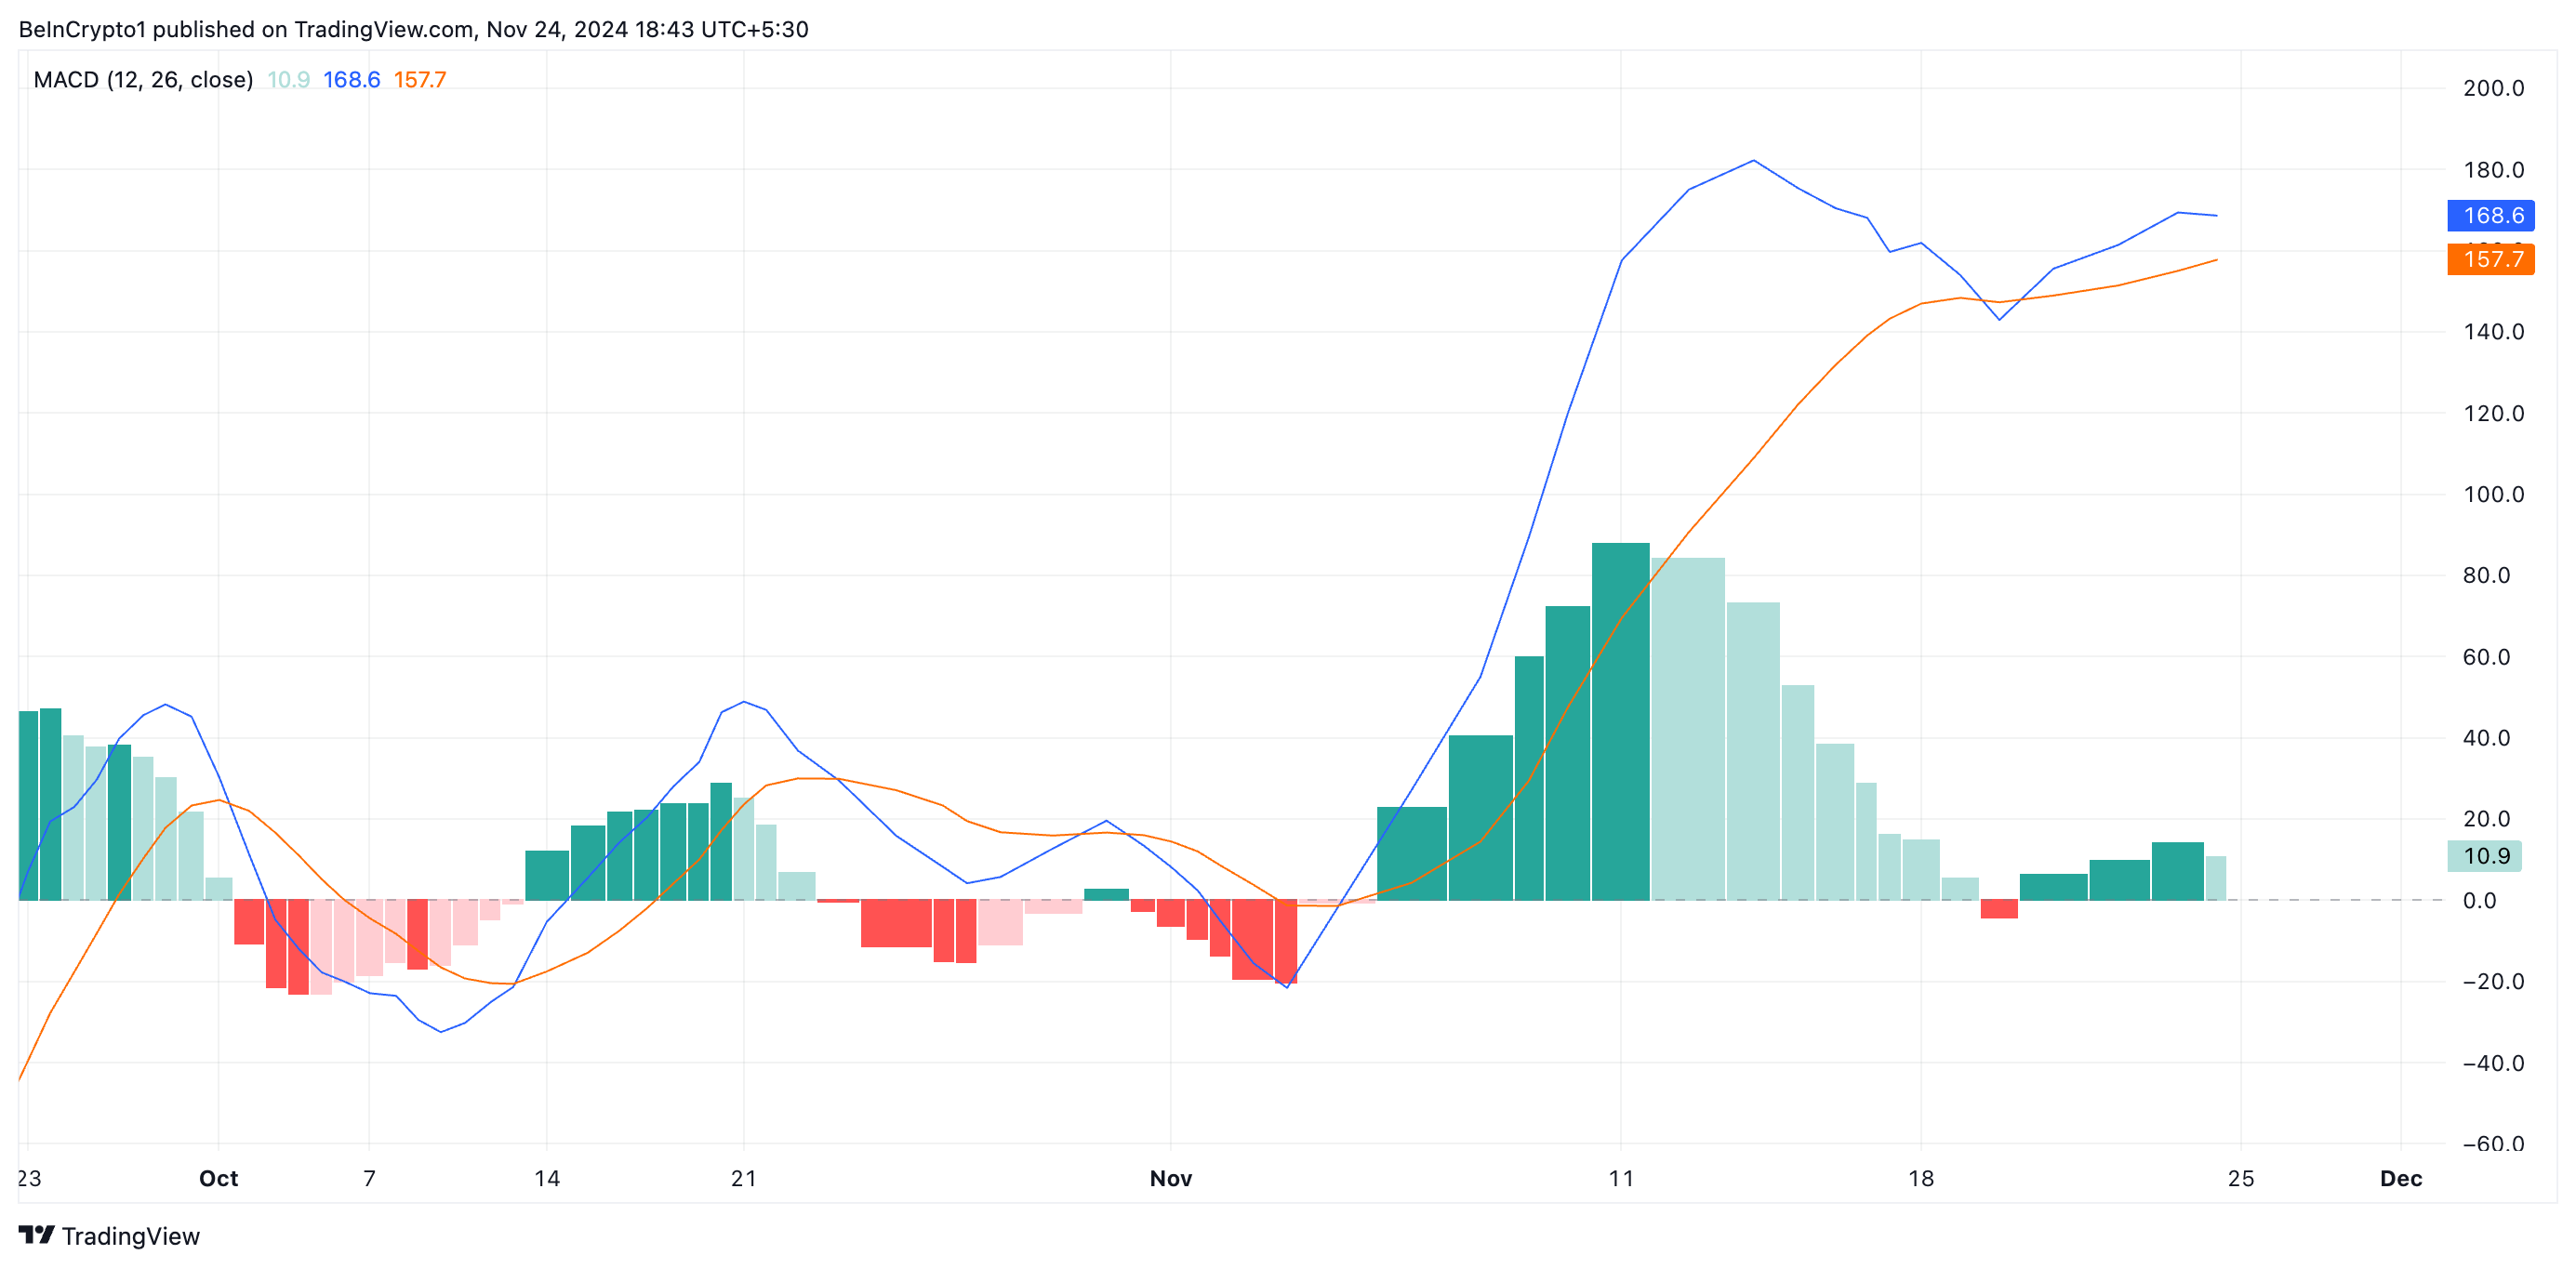
An assessment of the ETH/USD one-day chart has revealed that the coin’s moving average convergence divergence (MACD) indicator is forming a potential death cross. As of this writing, the coin’s MACD line (blue) is attempting to fall below its signal line (orange).
This indicator measures an asset’s price trends and momentum and identifies its potential buy or sell signals. A MACD death cross occurs when the MACD line (the shorter-term moving average) crosses below the signal line (the longer-term moving average), indicating a bearish trend or momentum reversal. This signal suggests that selling pressure is increasing, and the asset’s price could decline further.
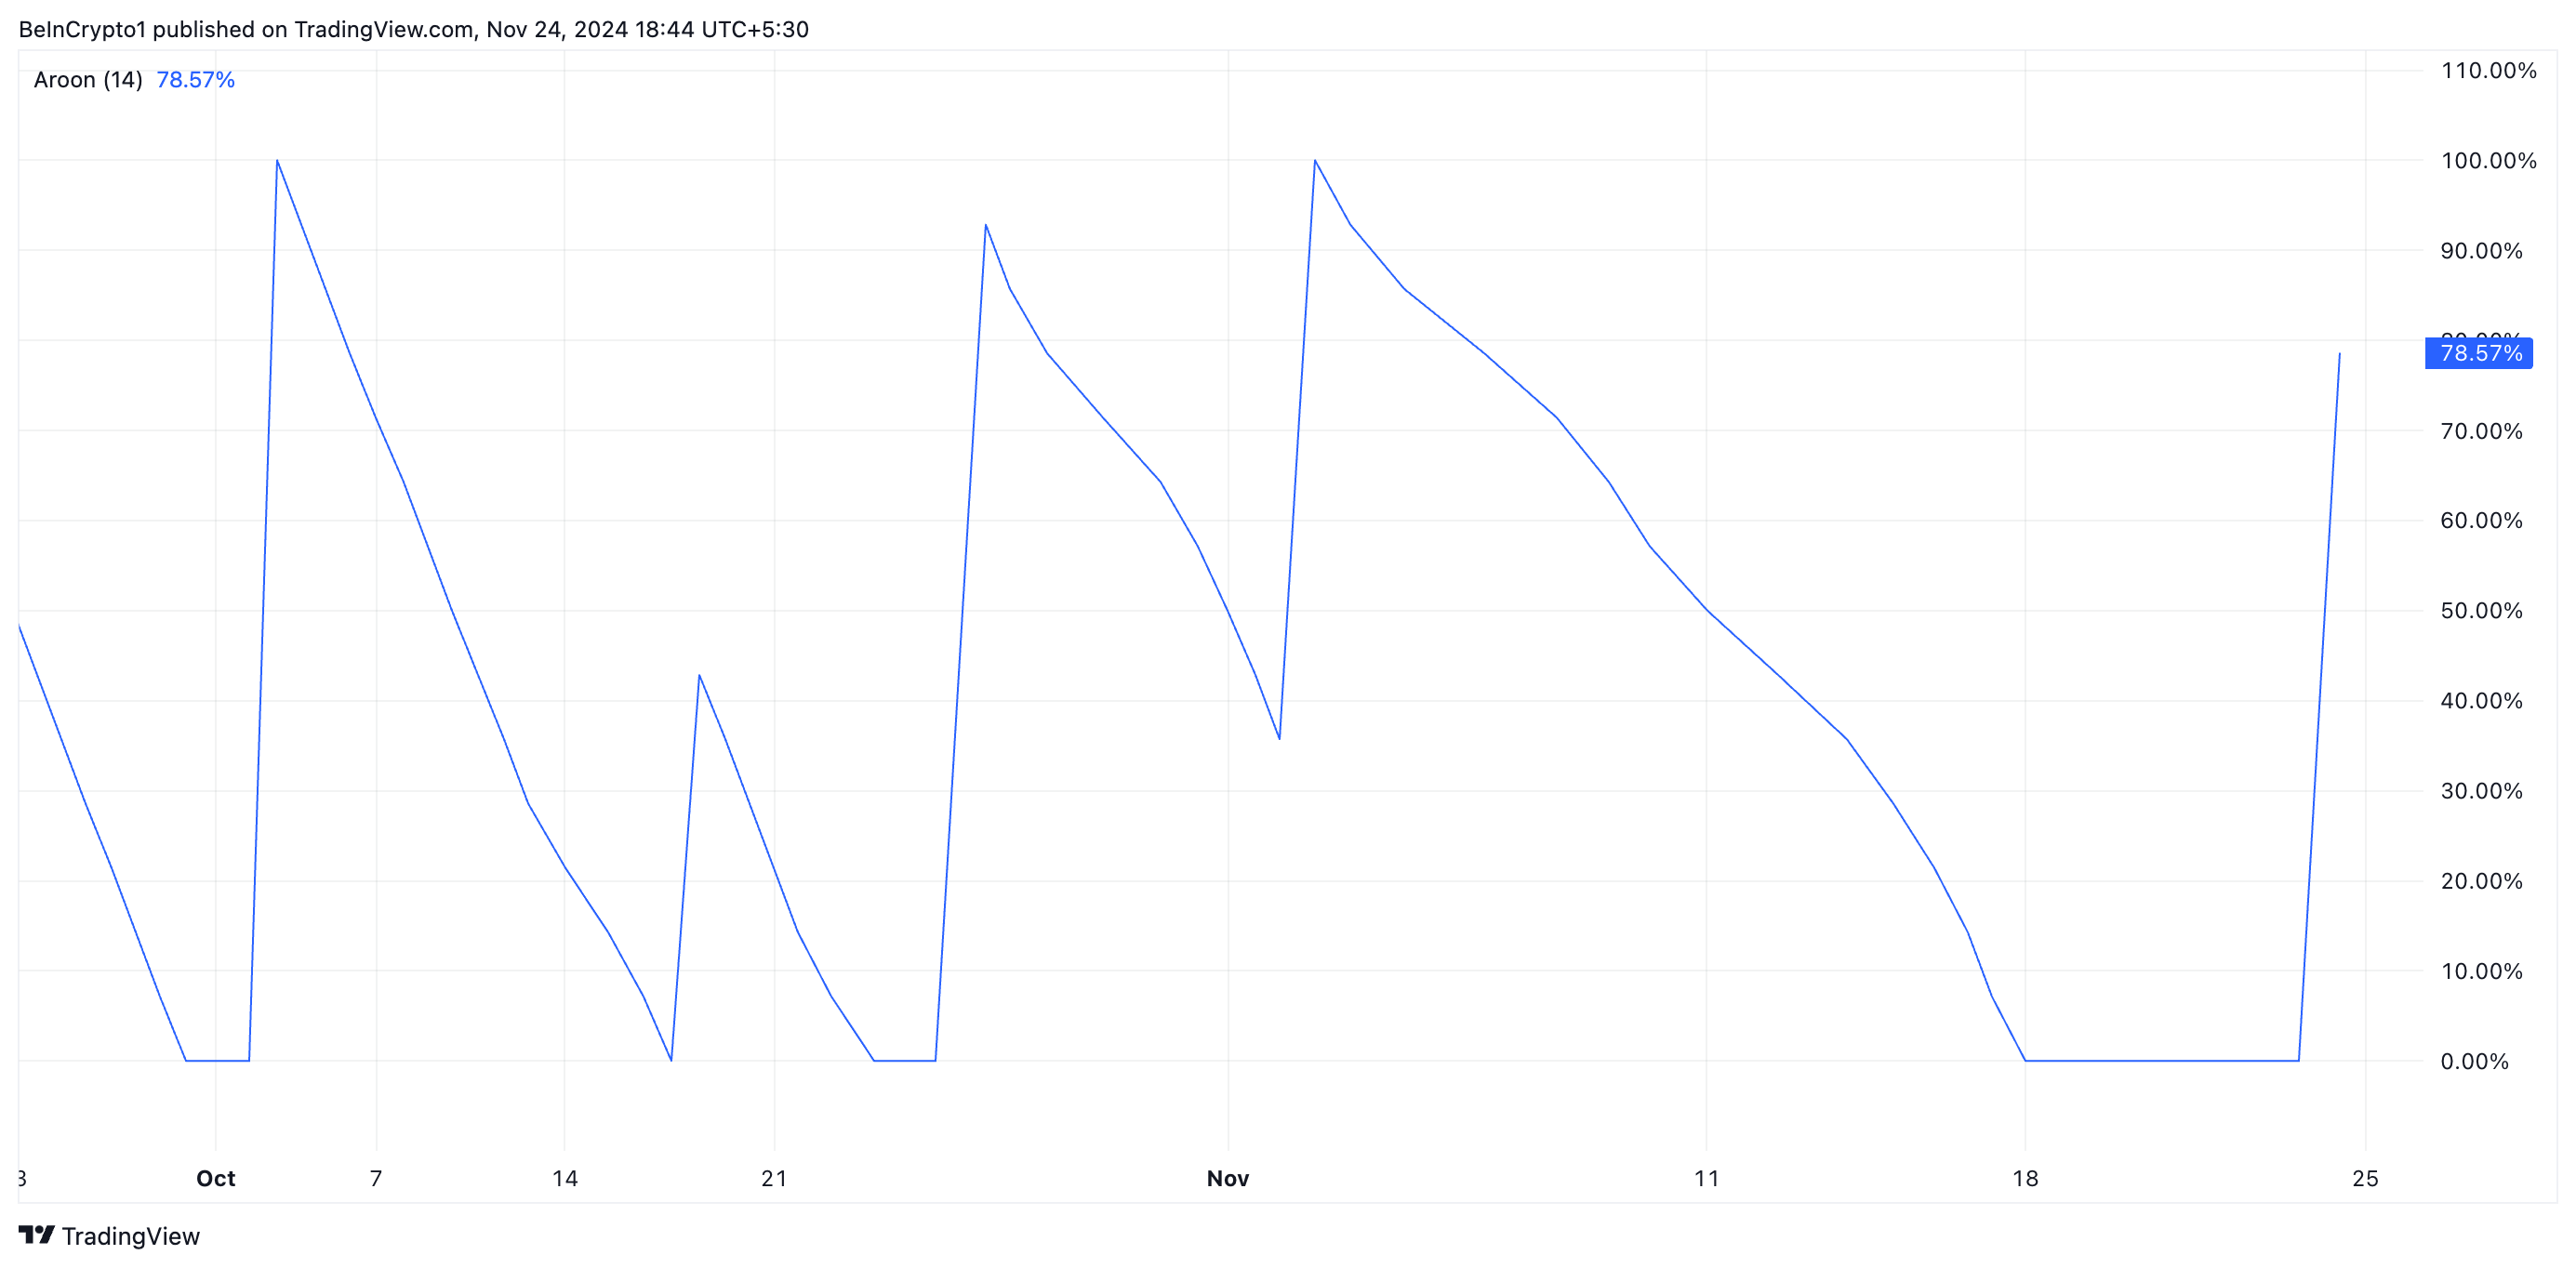
ETH’s rising Aroon Down Line confirms this strengthening bearish pressure. It currently sits at 78.57%, confirming that the decline in ETH’s price is gaining momentum.
The Aroon Indicator evaluates the strength of an asset’s price trend through two components: the Aroon Up line, which reflects the strength of an uptrend, and the Aroon Down line, which reflects the strength of a downtrend. A rising Aroon Down line indicates that recent lows are occurring more frequently, signaling growing bearish momentum or the start of a downtrend.
ETH Price Prediction: Key Support Level To Watch
ETH currently trades at $3,333, resting above the support formed at $3,203. This level is crucial because a decline below it will cause ETH to exchange hands under $3000. According to readings from the coin’s Fibonacci Retracement tool, the Ethereum price will drop to $2,970 if this happens.
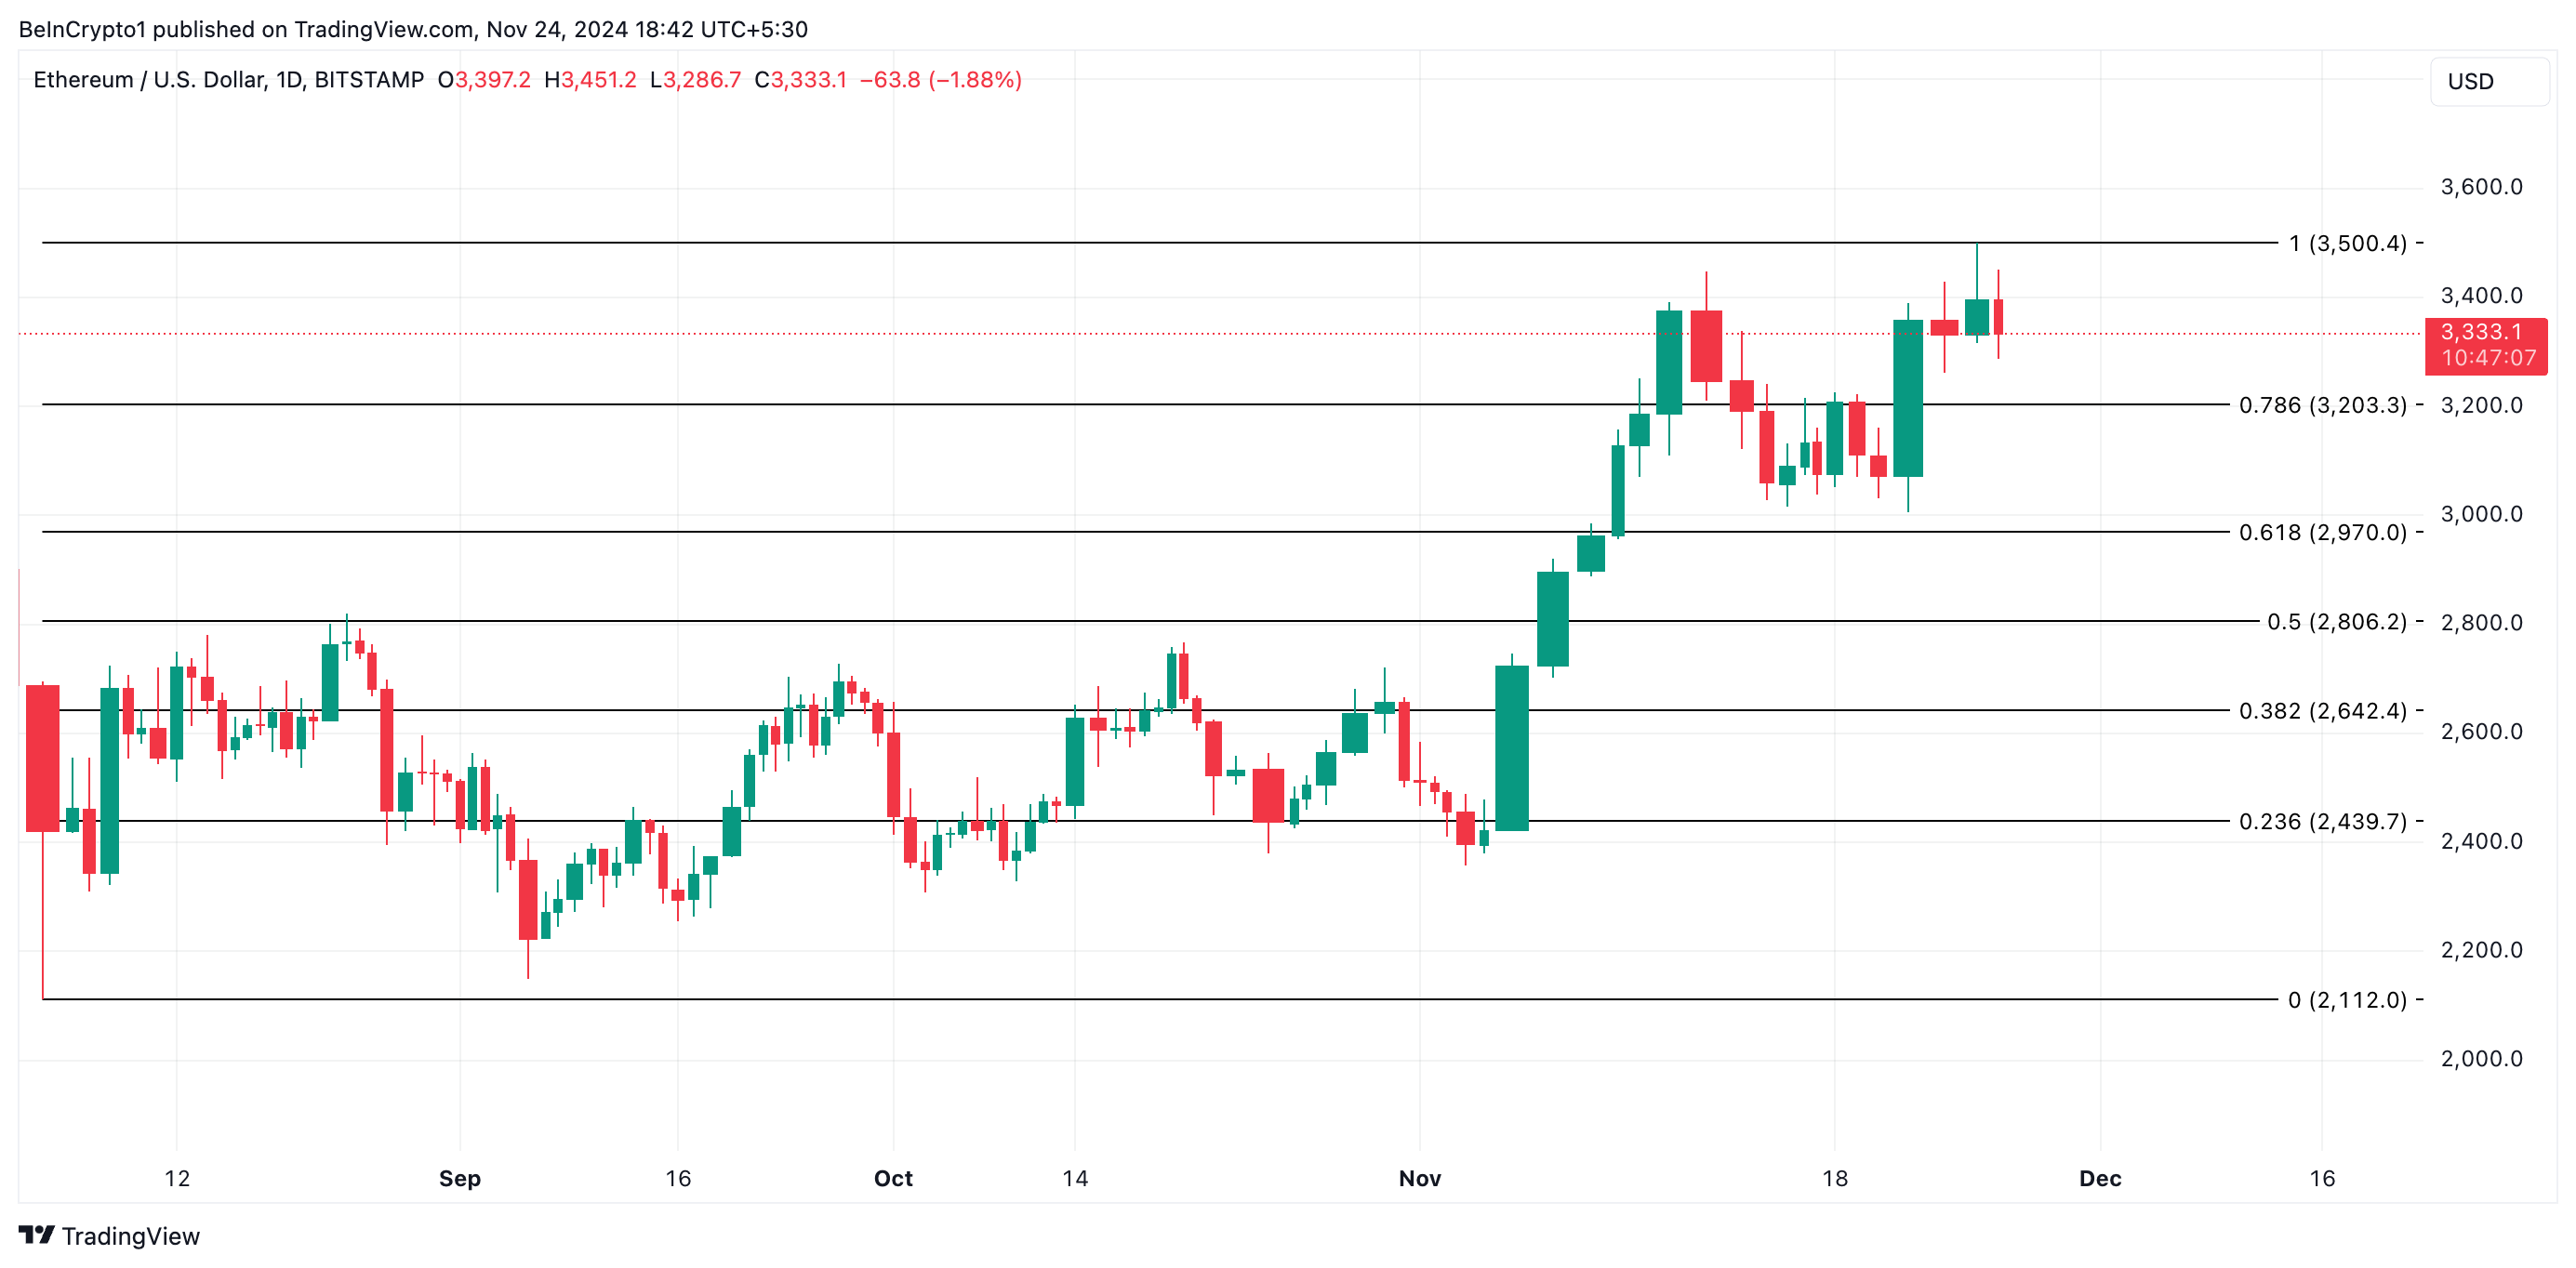
However, a resurgence in the demand for the leading altcoin will invalidate this bearish thesis. If this occurs, Ethereum will rally toward $3,500.
Disclaimer
In line with the Trust Project guidelines, this price analysis article is for informational purposes only and should not be considered financial or investment advice. BeInCrypto is committed to accurate, unbiased reporting, but market conditions are subject to change without notice. Always conduct your own research and consult with a professional before making any financial decisions. Please note that our Terms and Conditions, Privacy Policy, and Disclaimers have been updated.

Cantor Fitzgerald, a prominent US financial services firm, is expanding its alliance with Tether, a key player in the digital asset industry and the issuer of the world’s largest stablecoin.
According to reports, the firm has agreed to acquire a 5% stake in Tether as part of a broader collaboration that includes Bitcoin-backed lending initiatives.
Tether Mints $13 Billion USDT as Cantor Fitzgerald Deepens Tie
The acquisition talks, reportedly finalized in 2023, valued the 5% stake at approximately $600 million. This partnership positions Tether to gain strategic advantages, particularly as Cantor Fitzgerald’s CEO, Howard Lutnick, takes on his new role as Secretary of Commerce under President-elect Donald Trump.
Market observers suggest that the nomination raises the possibility of enhanced regulatory support for Tether, which has faced scrutiny over potential violations of sanctions and anti-money laundering regulations—a claim the company has denied. However, Lutnick has promised to step down from his positions at Cantor Senate confirmation.
Beyond the ownership stake, Tether is expected to support Cantor Fitzgerald’s Bitcoin lending program, a multi-billion-dollar initiative. The program aims to offer loans backed by Bitcoin, initially funded with $2 billion, with plans for significant future expansion.
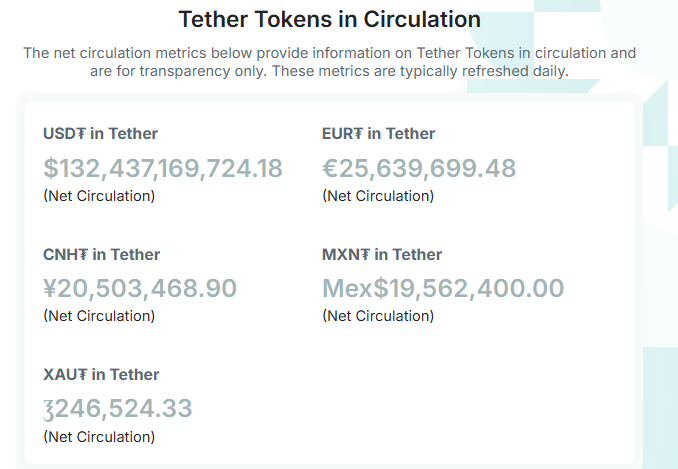
Meanwhile, Cantor Fitzgerald is already a critical partner for Tether, reportedly holding a significant portion of the stablecoin issuer’s $134 billion reserves in US Treasury bills.
As Cantor Fitzgerald deepens its involvement with Tether, the firm has continued its aggressive token minting. On November 24, blockchain analytics platform Lookonchain reported that stablecoin company minted an additional $3 billion USDT, bringing the total minted since November 8 to $13 billion. This expansion has pushed the total supply of USDT to approximately $132 billion.
The increased USDT supply may reflect the growing demand for stablecoins, often used to hedge market positions or facilitate crypto transactions without converting to fiat. This liquidity influx could reduce volatility and enhance price stability across the digital asset market.
This surge in USDT supply coincides with a broader market rally led by Bitcoin and other assets such as Dogecoin and Solana, signaling renewed investor confidence in the crypto ecosystem.
Disclaimer
In adherence to the Trust Project guidelines, BeInCrypto is committed to unbiased, transparent reporting. This news article aims to provide accurate, timely information. However, readers are advised to verify facts independently and consult with a professional before making any decisions based on this content. Please note that our Terms and Conditions, Privacy Policy, and Disclaimers have been updated.

Bitcoin ETFs Could Overtake Gold ETFs by End of The Year

Bitcoin Bull Saylor Hints at Expanding MicroStrategy’s Holdings

Why Ethereum Price May Fall Under $3,000

$100K Bitcoin Is Only The Beginning, VanEck Targets $180K

Cantor Fitzgerald Deepens Tether Ties With 5% Stake Acquisition

Bitcoin Whales Remain Determined, $3.96 Billion Worth Of BTC Gobbled Up In 96 Hours

2.52 Million Altcoins Are Ruining Crypto’s Future

Animoca Brands Valuation Tanks 75% In Two Years, Here’s Why

Crypto exchange BingX hacked for $43 million

Are The Big Players Losing Interest?

Hong Kong’s Securities Association Tips Authorities On Crypto Self-Regulation

Coinbase cbBTC Set to go Live on Solana
2.52 Million Altcoins Are Ruining Crypto’s Future
Animoca Brands Valuation Tanks 75% In Two Years, Here’s Why
Crypto exchange BingX hacked for $43 million
Are The Big Players Losing Interest?
Hong Kong’s Securities Association Tips Authorities On Crypto Self-Regulation
Coinbase cbBTC Set to go Live on Solana
-
 Altcoin21 hours ago
BTC Continues To Soar, Ripple’s XRP Bullish
-

 Bitcoin15 hours ago
Bitcoin Price Is Decoupling From Gold Again — What’s Happening?
-

 Market18 hours ago
Why a New Solana All-Time High May Be Near
-
 Market13 hours ago
Is the XRP Price Decline Going To Continue?
-

 Market12 hours ago
Token Unlocks to Watch Next Week: AVAX, ADA and More
-
 Market15 hours ago
Winklevoss Urges Scrutiny of FTX and SBF Political Donations
-

 Bitcoin14 hours ago
Bitcoin Correction Looms As Analyst Predicts Fall To $85,600
-

 Bitcoin13 hours ago
AI Company Invests $10 Million In BTC Treasury