Market
Mantra Surges 40% on Real-World Asset Tokenization Momentum

Mantra (OM), a layer-1 (L1) blockchain that supports real-world asset (RWA) tokenization, has seen a nearly 40% price increase over the last seven days. DefiLlama data also shows that Mantra’s total value locked (TVL) has increased by approximately 25.72% since the beginning of June, reaching $52.4 million.
This increase follows months of stagnation since mid-April. Analysts credit this rise to new partnerships and technological advancements in the Mantra ecosystem.
New Partnerships Fuel Mantra’s Growth
On June 5, Mantra announced a memorandum of understanding (MoU) with Zand Bank PJSC, a digital bank licensed by the Central Bank of the United Arab Emirates (UAE). The partnership aims to establish frameworks for real-world asset tokenization under the Virtual Asset Regulatory Authority of Dubai (VARA) standards. This strategic move also intends to enhance regulatory compliance, investor protection, and trust in RWA tokenization in the UAE.
Read more: What Are Tokenized Real-World Assets (RWA)?
“This collaboration represents a step forward in our journey to amalgamate blockchain technology with our robust financial offerings to give our clients greater control over their investments, enhanced security, and more clarity into the lifecycle of their transactions,” Michael Chan, CEO of Zand, stated.
Mantra’s technological advancements have also played a key role in its recent growth. Last week, Mantra announced plans to feature Ondo’s flagship interest-bearing tokenized note, USDY, as a genesis asset when its blockchain debuts later this year. USDY exposes holders to short-term US Treasury yield while maintaining stablecoin utility.
The collaboration between Ondo Foundation and Mantra aims to incentivize a multi-chain vault, allowing users to contribute USDC and receive high-quality yields. Upon the mainnet launch, this initiative will provide participants with ONDO tokens and OM coins, further boosting Mantra’s ecosystem.
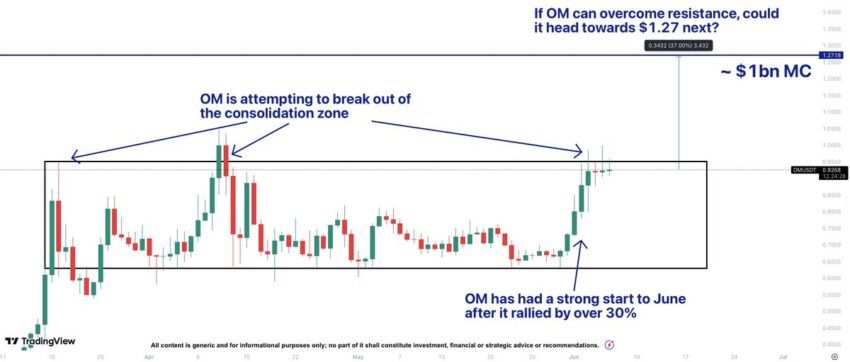
A technical analysis by CryptoSavingExpert highlights OM’s potential to break out of its consolidation zone. The analysis indicates that OM could reach $1.27 if it overcomes current resistance levels. This insight aligns with the broader trends in the crypto market, emphasizing the increasing focus on real-world asset tokenization.
Read more: How To Invest in Real-World Crypto Assets (RWA)?
The CoinGecko RWA Report 2024 highlights the rise of real-world asset tokenization in crypto, particularly USD-pegged stablecoins and commodity-backed tokens like gold. The report also notes a 782% surge in tokenized treasury products in 2023.
These trends align with Mantra’s strategic moves. As the project continues to innovate and grow, it stands poised for further success in the real-world asset tokenization industry.
Disclaimer
In adherence to the Trust Project guidelines, BeInCrypto is committed to unbiased, transparent reporting. This news article aims to provide accurate, timely information. However, readers are advised to verify facts independently and consult with a professional before making any decisions based on this content. Please note that our Terms and Conditions, Privacy Policy, and Disclaimers have been updated.
Market
XRP Price Swings Wildly: Can It Resume Its Rally?

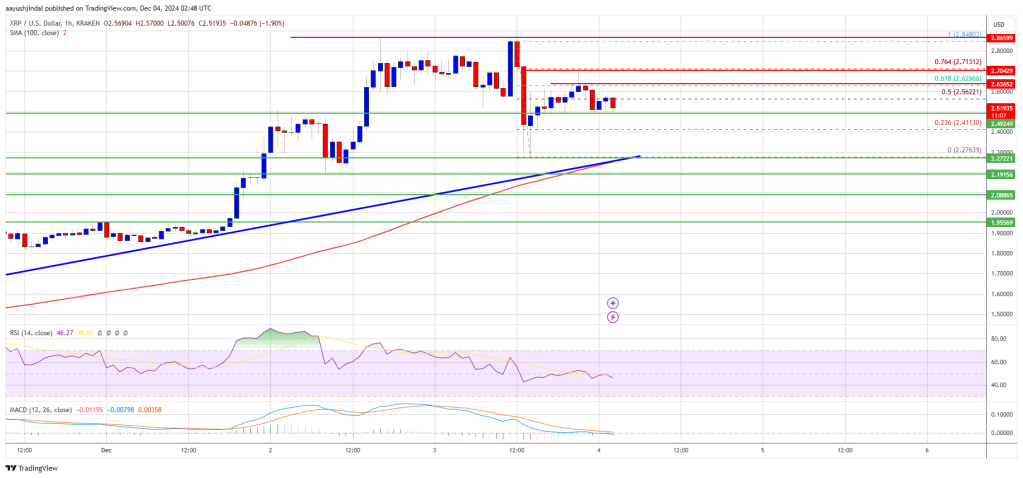
XRP price saw a couple of swing moves from the $2.85 resistance. The price is consolidating near $2.50 and might aim for more gains above the $2.65 level.
- XRP price is struggling to gain pace for a move above the $2.80 resistance zone.
- The price is now trading above $2.30 and the 100-hourly Simple Moving Average.
- There is a key bullish trend line forming with support at $2.25 on the hourly chart of the XRP/USD pair (data source from Kraken).
- The pair might continue to accelerate if it clears the $2.72 resistance.
XRP Price Holds Gains Above $2.30
XRP price made another attempt to clear the $3.00 resistance. However, it failed to surpass $2.85 and corrected some gains unlike Bitcoin and like Ethereum. There was a move below the $2.65 and $2.50 levels.
A low was formed at $2.276 and the price is now correcting losses. There was a move above the $2.40 and $2.50 levels. The bulls pushed it back above the 50% Fib retracement level of the recent decline from the $2.848 swing high to the $2.276 low.
The price is now trading above $2.30 and the 100-hourly Simple Moving Average. There is also a key bullish trend line forming with support at $2.25 on the hourly chart of the XRP/USD pair.
On the upside, the price might face resistance near the $2.620 level. The first major resistance is near the $2.720 level. It is close to the 76.4% Fib retracement level of the recent decline from the $2.848 swing high to the $2.276 low.
The next key resistance could be $2.850. A clear move above the $2.850 resistance might send the price toward the $2.950 resistance. Any more gains might send the price toward the $3.00 resistance or even $3.150 in the near term. The next major hurdle for the bulls might be $3.20.
Are Dips Limited?
If XRP fails to clear the $2.620 resistance zone, it could start another decline. Initial support on the downside is near the $2.50 level. The next major support is near the $2.40 level.
If there is a downside break and a close below the $2.40 level, the price might continue to decline toward the $2.30 support and the trend line. The next major support sits near the $2.050 zone.
Technical Indicators
Hourly MACD – The MACD for XRP/USD is now losing pace in the bullish zone.
Hourly RSI (Relative Strength Index) – The RSI for XRP/USD is now below the 50 level.
Major Support Levels – $2.5000 and $2.4000.
Major Resistance Levels – $2.6200 and $2.7200.
Market
Will Cardano Whales Continue to Sell Ahead of Token Unlock?

Cardano (ADA) whales, who have been instrumental in driving the cryptocurrency’s price by 270% in the last 30 days, have now sold a bunch of tokens. This sell-off comes ahead of this week’s token unlock, which market participants expect will cause volatility.
As of this writing, ADA trades at $1.23. Will this sell-off draw the price down further?
Cardano Key Holders Offload Some Tokens
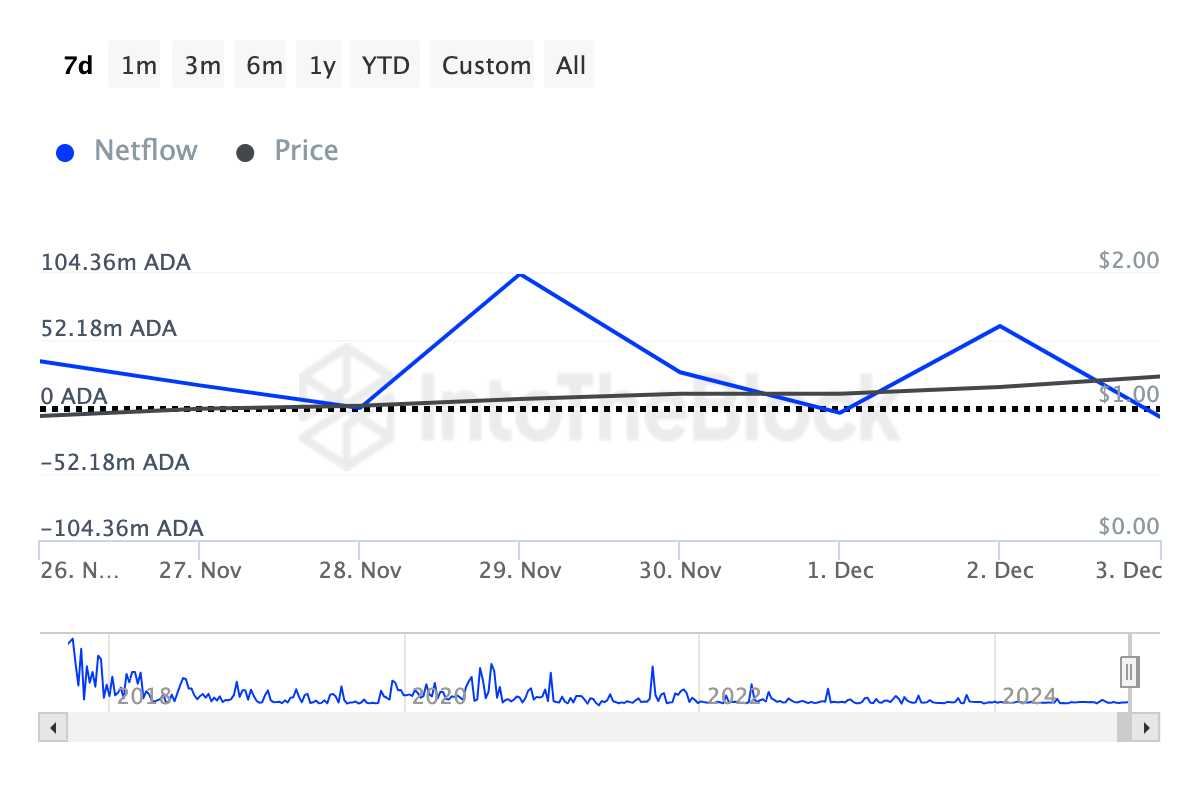
On Monday, December 2, Cardano’s large holders’ netflow reached 63.58 million ADA, reflecting a strong buying trend among whales. The netflow metric tracks the difference between tokens bought and sold by these key players. A rising netflow indicates accumulation, while a decline indicates selling pressure.
As of now, the netflow has plunged to 7.62 million ADA, according to IntoTheBlock, suggesting that whales offloaded 55.96 million ADA — either to take profits or rebalance their portfolios. At Cardano’s current price, this sell-off amounts to a staggering $69 million.
From BeInCrypto’s observation, the recent sell-off may be tied to the upcoming token unlock on December 6.
Token unlocks, which release previously restricted tokens into circulation, often drive significant price movements by altering supply and demand dynamics.
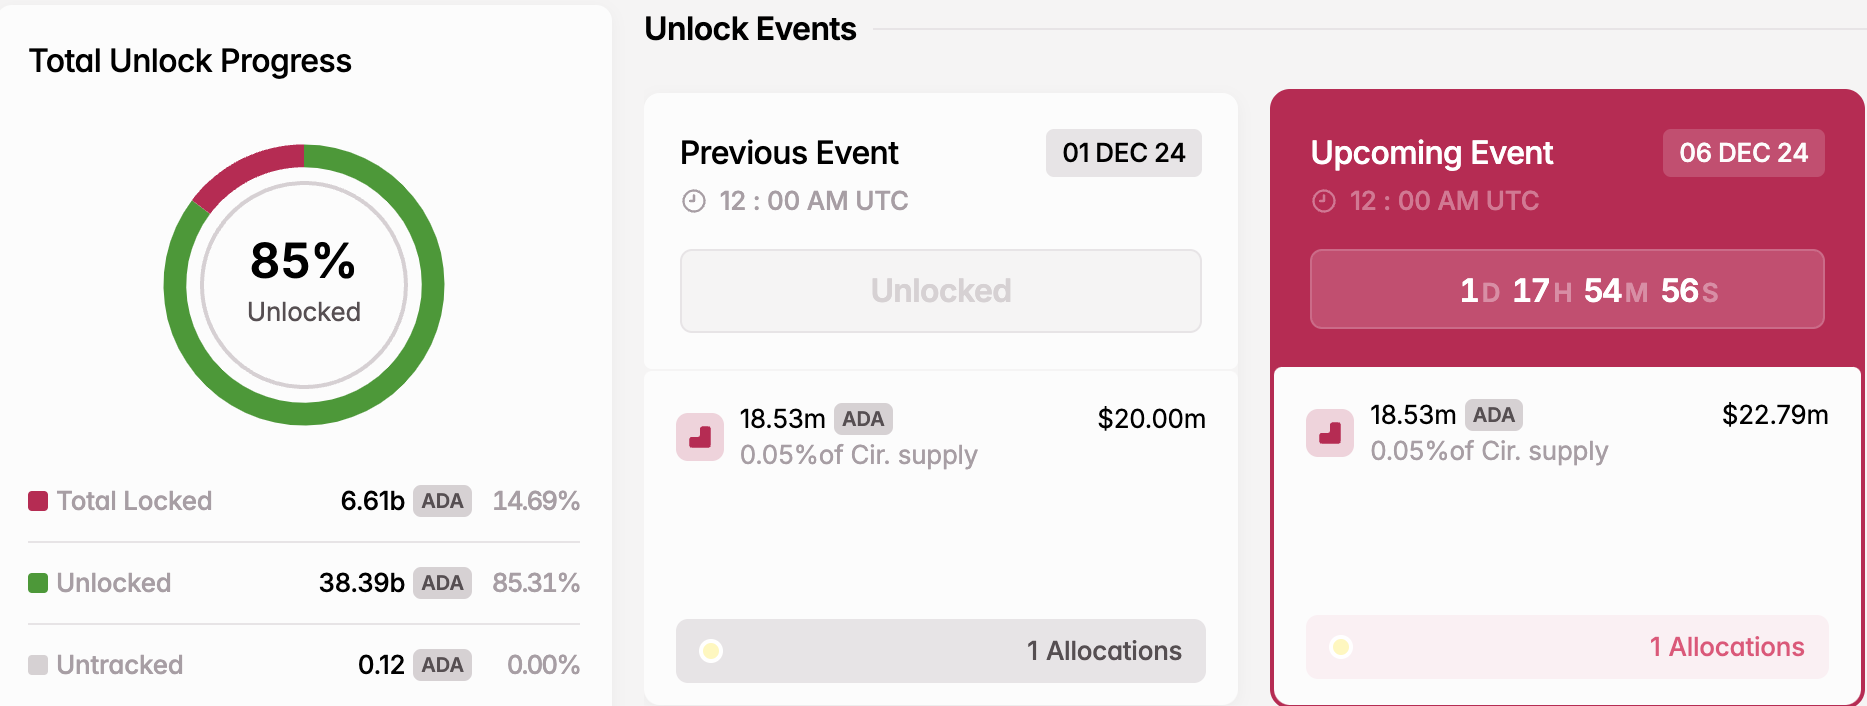
According to Tokenomist (formerly Token Unlocks), Cardano is set to release 18.53 million ADA on that date, valued at $22.79 million. This anticipated supply shock could introduce volatility, potentially hindering the altcoin’s ability to sustain an uptrend during this period.
ADA Price Prediction: Overbought, Retracement Likely
On the daily chart, Cardano’s Bollinger Bands (BB) have widened, indicating heightened volatility. The BB also highlights whether an asset is overbought or oversold.
When the price touches the upper band, it signals an overbought condition, while contact with the lower band indicates oversold territory. Therefore, the image below confirms the thesis that ADA is overbought.
The Relative Strength Index (RSI), which measures momentum, also aligns with the bias. When the RSI reading is above 70.00, it is overbought. On the other hand, when the reading is below 30.00, it is oversold.
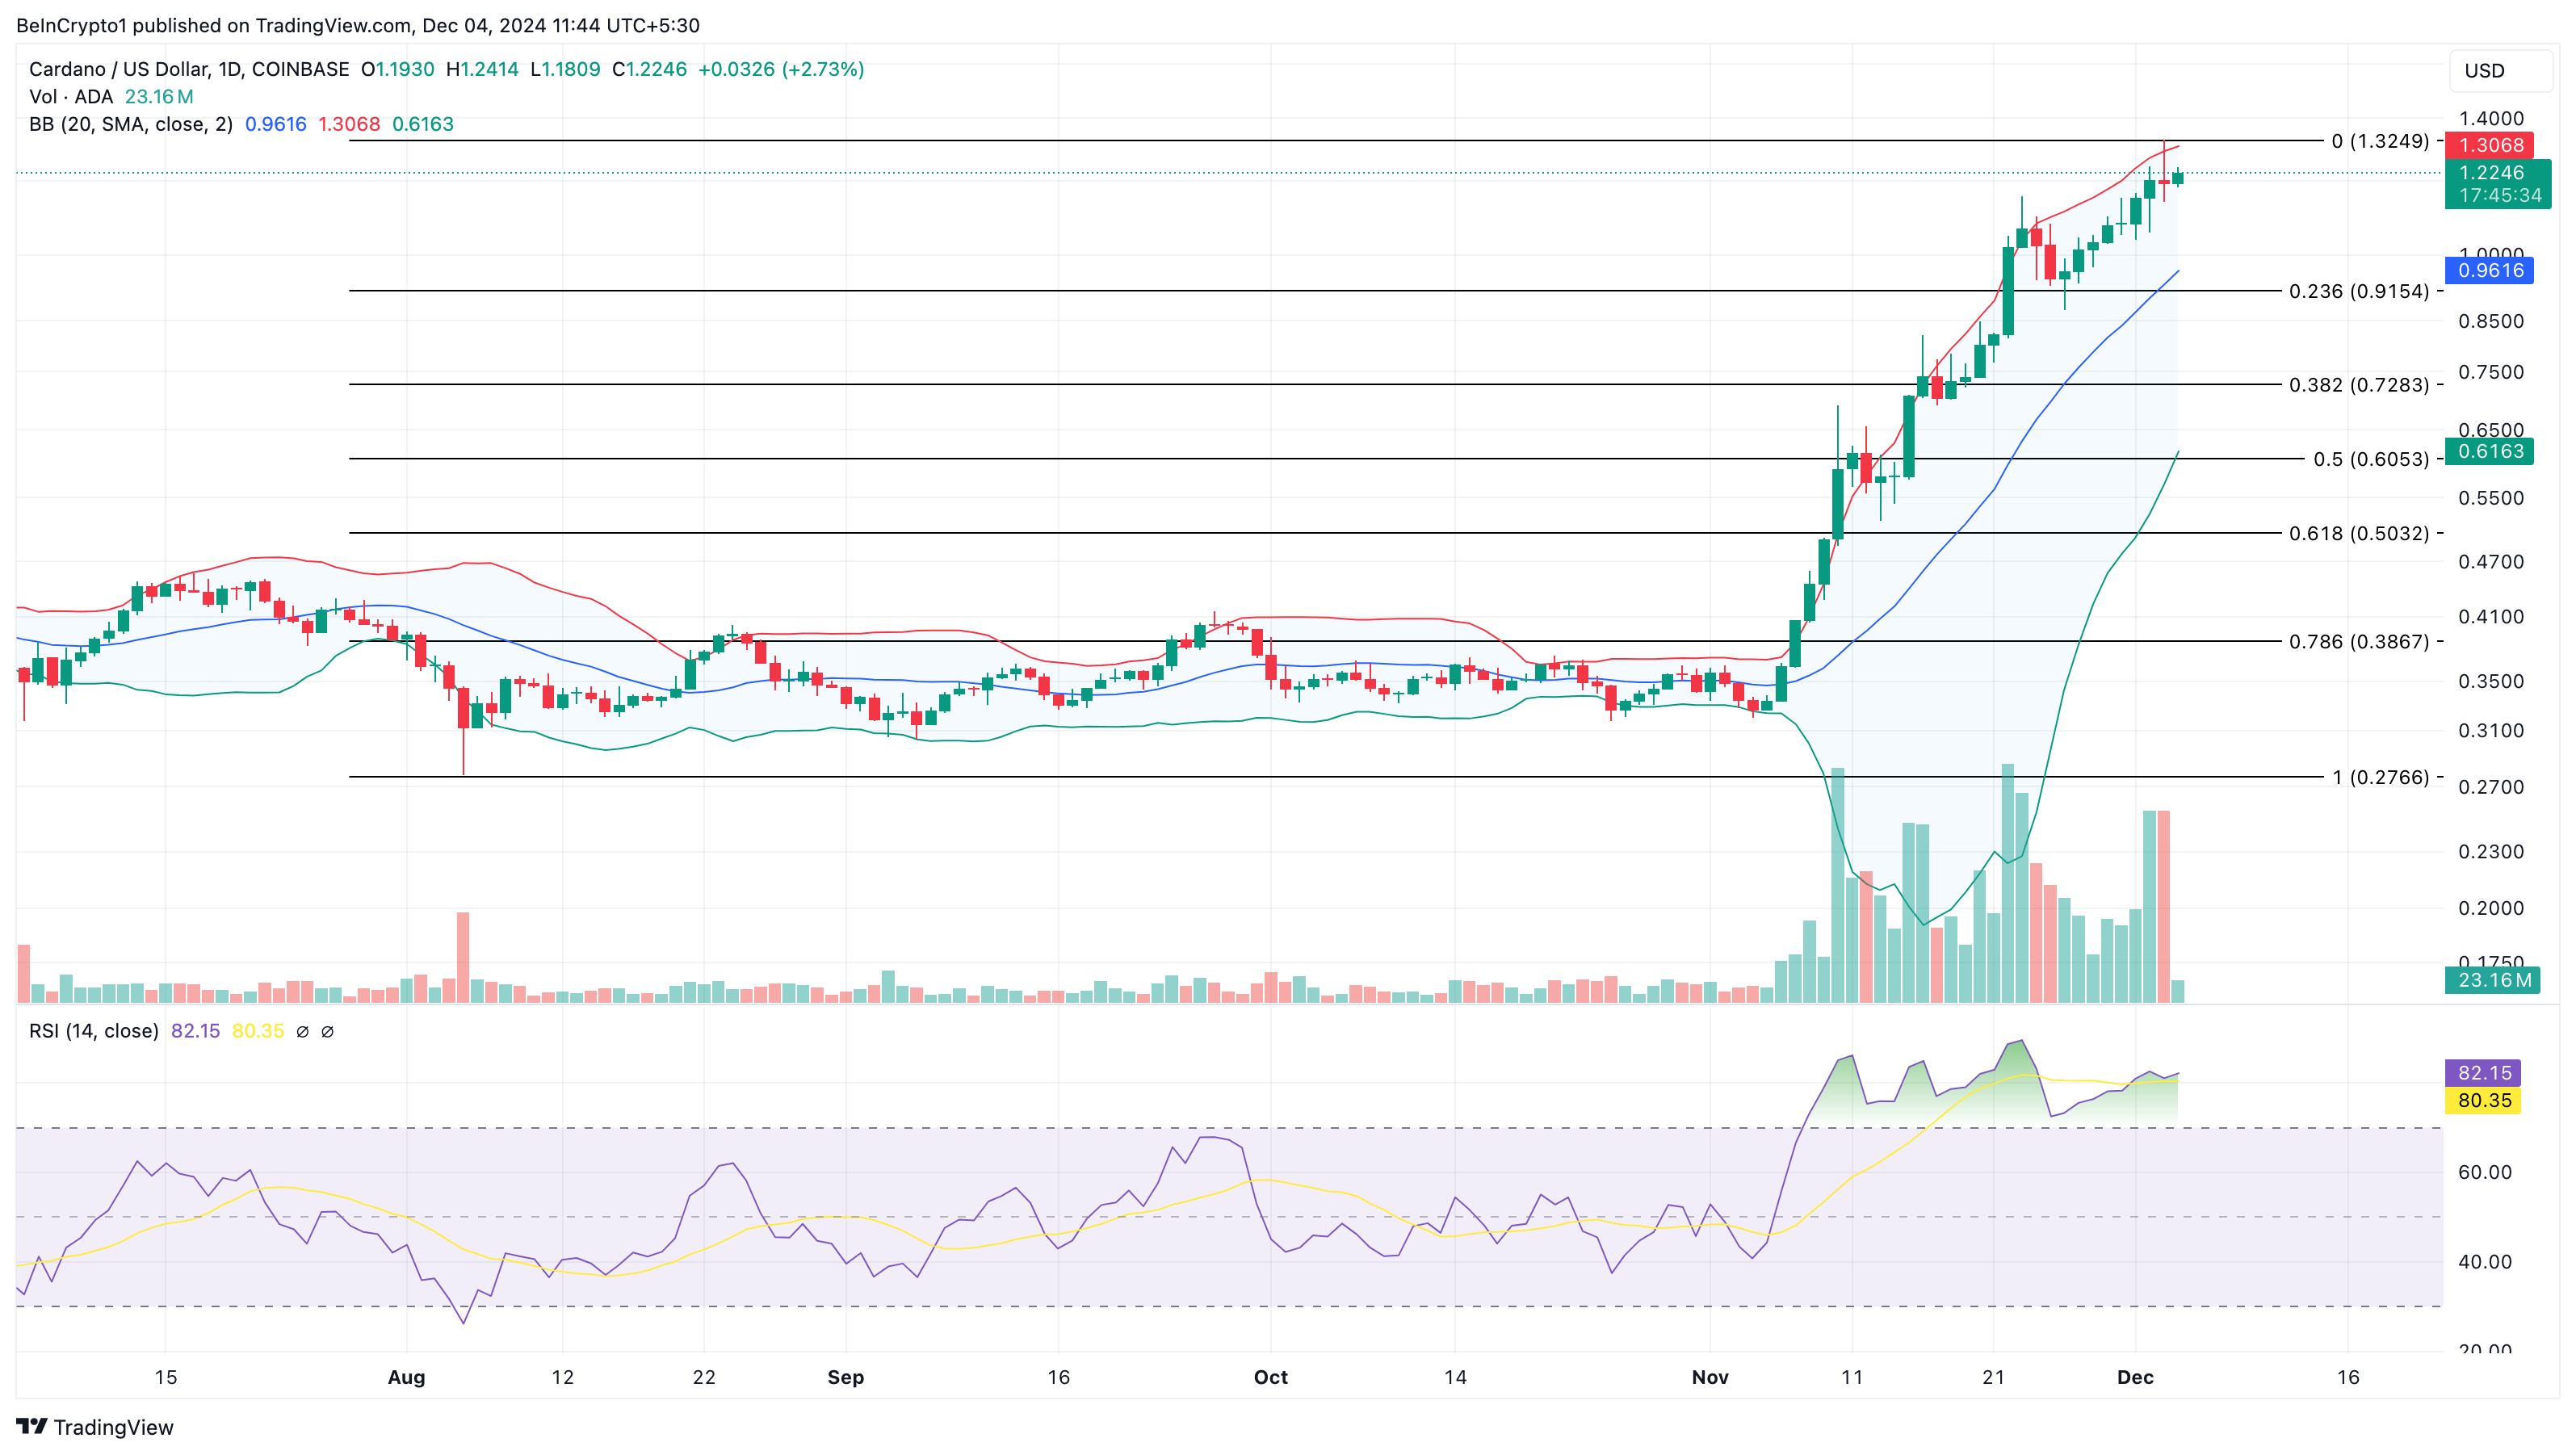
At press time, Cardano’s RSI stands at 82.15, firmly placing ADA in overbought territory. Given this condition, a price correction to $0.92 could be next. However, if Cardano whales resume accumulation, the trend could shift, potentially pushing the price above $1.33
Disclaimer
In line with the Trust Project guidelines, this price analysis article is for informational purposes only and should not be considered financial or investment advice. BeInCrypto is committed to accurate, unbiased reporting, but market conditions are subject to change without notice. Always conduct your own research and consult with a professional before making any financial decisions. Please note that our Terms and Conditions, Privacy Policy, and Disclaimers have been updated.
Market
Solana (SOL) Back on Track: Is The Uptrend Here to Stay?

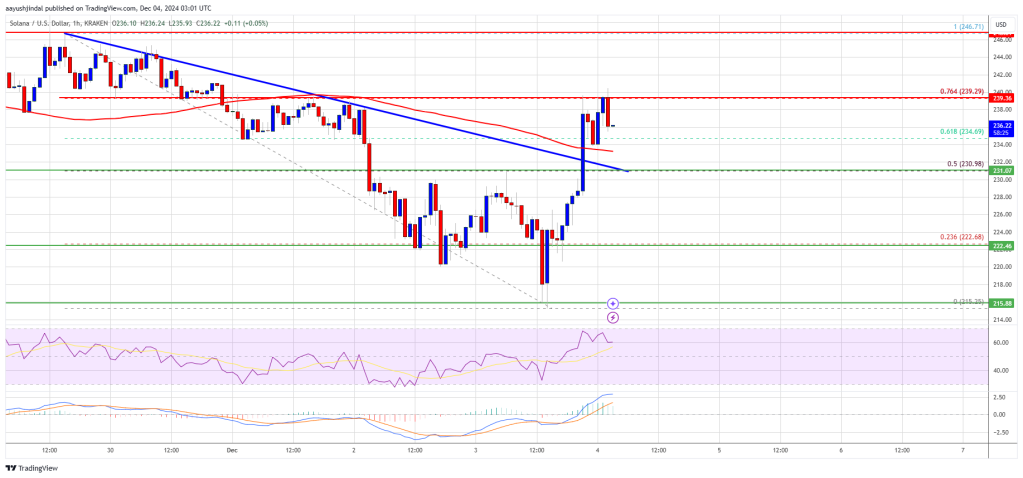
Solana started a fresh increase from the $215 zone. SOL price is rising and might aim for a move above the $240 and $250 resistance levels.
- SOL price started a fresh increase after it settled above the $222 level against the US Dollar.
- The price is now trading above $230 and the 100-hourly simple moving average.
- There was a break above a key bearish trend line with resistance at $232 on the hourly chart of the SOL/USD pair (data source from Kraken).
- The pair could start a fresh increase if the bulls clear the $240 zone.
Solana Price Eyes Fresh Surge
Solana price formed a support base and started a fresh increase above the $220 level like Bitcoin and Ethereum. There was a decent increase above the $225 and $230 resistance levels.
There was a move above the 50% Fib retracement level of the downward move from the $246 swing high to the $215 low. Besides, there was a break above a key bearish trend line with resistance at $232 on the hourly chart of the SOL/USD pair.
Solana is now trading above $235 and the 100-hourly simple moving average. On the upside, the price is facing resistance near the $240 level or the 76.4% Fib retracement level of the downward move from the $246 swing high to the $215 low.
The next major resistance is near the $246 level. The main resistance could be $250. A successful close above the $250 resistance level could set the pace for another steady increase. The next key resistance is $265. Any more gains might send the price toward the $280 level.
Another Decline in SOL?
If SOL fails to rise above the $240 resistance, it could start another decline. Initial support on the downside is near the $230 level or the 100-hourly simple moving average. The first major support is near the $220 level.
A break below the $220 level might send the price toward the $215 zone. If there is a close below the $215 support, the price could decline toward the $200 support in the near term.
Technical Indicators
Hourly MACD – The MACD for SOL/USD is gaining pace in the bullish zone.
Hourly Hours RSI (Relative Strength Index) – The RSI for SOL/USD is above the 50 level.
Major Support Levels – $230 and $220.
Major Resistance Levels – $240 and $250.
-

 Regulation21 hours ago
Cambodia crackdown locks out 16 crypto exchanges
-

 Altcoin20 hours ago
Altcoin Season To Face Challenges Ahead, CryptoQuant CEO Predicts
-

 Altcoin19 hours ago
SHIB Burn Skyrockets 3400%, Shiba Inu Rally To Continue?
-

 Altcoin18 hours ago
XLM, KAIA, SAND, & These Crypto Eye Rally As Binance Expands Support
-

 Market23 hours ago
XRP Price Defies The Odds
-

 Altcoin17 hours ago
Analyst Who Correctly Called The XRP Price Jump From $1.4 To $2.8 Reveals The Rest Of The Prediction
-
 Market22 hours ago
Tron (TRX) Price Hits New All-Time High Since 2018
-

 Altcoin21 hours ago
Thinking Of Selling Your Dogecoin Already? Crypto Analyst Puts Price Top In The Double-Digits


