
Bitcoin
Bitcoin ETFs Attract $886 Million as This Indicator Turns Bullish

On Tuesday, US spot Bitcoin exchange-traded funds (ETFs) recorded significant inflows, totaling a remarkable $886.6 million.
This influx marks the second-best day for joint net inflows into US spot Bitcoin ETFs. With these elements at play, crypto analysts and community members consider a bullish market outlook for Bitcoin.
Bitcoin Surges to $71,200
Leading the pack, the Fidelity Wise Origin Bitcoin Fund (FBTC) saw an inflow of $378.7 million. Not far behind, BlackRock’s iShares Bitcoin Trust (IBIT) added $274.4 million. Additionally, the ARK 21Shares Bitcoin ETF (ARKB) reported strong gains, securing $138.7 million in net inflows.
Meanwhile, Bitcoin’s price soared to $71,200 in early Wednesday trading, currently trading at $71,166. On another front, the Grayscale Bitcoin Trust (GBTC) also experienced a significant inflow day, bringing in $28.2 million. This marked one of the few inflow days since it transformed from a closed-end fund to a spot ETF earlier this year.
Read more: How To Trade a Bitcoin ETF: A Step-by-Step Approach

Contrastingly, Bitcoin ETFs managed by Invesco Galaxy, Franklin Templeton, WisdomTree, and Hashdex showed no new inflows on June 4, as per data from Farside Investors.
Despite this, the cryptocurrency community is abuzz with optimism. Bloomberg ETF analyst Eric Balchunas highlighted the substantial inflows, suggesting a bullish wave.
“The third wave is turning into tidal wave,” Balchunas said.
Moreover, the hash ribbons indicator from Capriole Investments has recently signaled a miner capitulation period. Miner capitulation occurs when Bitcoin’s hash rate’s 30-day moving average (DMA) drops below the 60 DMA, typically signaling potential long-term buying opportunities.
Charles Edwards, the founder of Capriole Investments, emphasized the indicator’s significance.
“Everytime we get a Hash Ribbon buy, it get ridiculed. But the last occurred was when Bitcoin was in the $20,000 range. Time to pay attention,” Edwards said.
Read more: Bitcoin (BTC) Price Prediction 2024/2025/2030
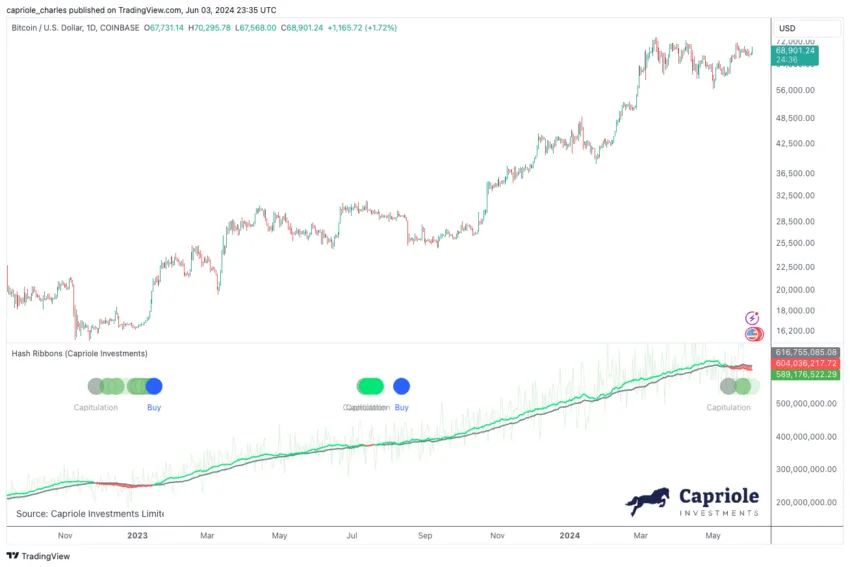
Miners are navigating the challenges post-Bitcoin halving—where block rewards are reduced, diminishing profitability for less efficient mining operations.
Miner capitulations often coincide with broader market weaknesses and volatility. However, they also align with significant market recoveries and are considered strategic investment points. Hash Ribbons’ reliability is supported by its historical performance, suggesting it remains a robust metric for predicting Bitcoin’s long-term value prospects.
Disclaimer
In adherence to the Trust Project guidelines, BeInCrypto is committed to unbiased, transparent reporting. This news article aims to provide accurate, timely information. However, readers are advised to verify facts independently and consult with a professional before making any decisions based on this content. Please note that our Terms and Conditions, Privacy Policy, and Disclaimers have been updated.


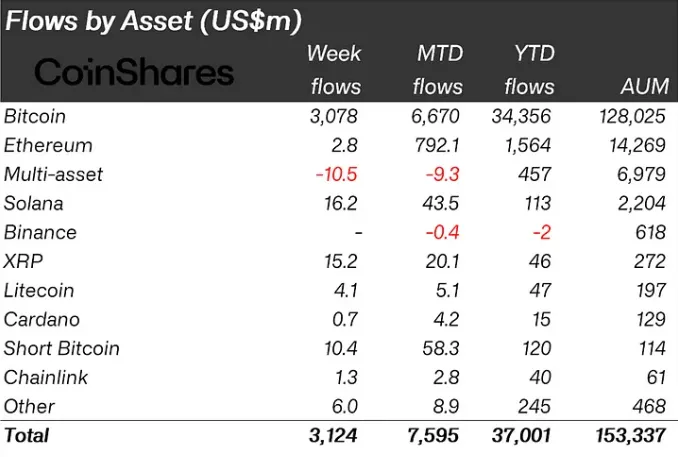
Crypto investment inflows registered a record-breaking weekly inflow of $3.12 billion last week. This surge brings the year-to-date inflows to an unprecedented $37 billion, highlighting Bitcoin’s growing dominance and renewed interest in digital asset investment products.
It comes as Bitcoin (BTC) continues to show potential for new record highs, with the peak price now standing at $99,588 on Binance.
Bitcoin Dominates Amid Crypto Inflows’ Record Highs
Bitcoin led the pack with $3.078 billion in inflows last week, marking its strongest performance to date. Despite reaching all-time price highs, the surge in interest extended to short-Bitcoin investment products, which recorded $10 million in weekly inflows. Notably, these short-Bitcoin inflows reached $58 million for the month — the highest since August 2022.
The recent $3.12 billion inflow is a sharp increase from previous weeks, continuing a strong upward trend. For context, the week prior saw $2.2 billion in inflows, buoyed by Republican electoral momentum and Federal Reserve dovishness.
The week before that brought $1.98 billion in post-election momentum. These successive inflows highlight the market’s resilience and growing confidence among investors despite broader economic uncertainties.
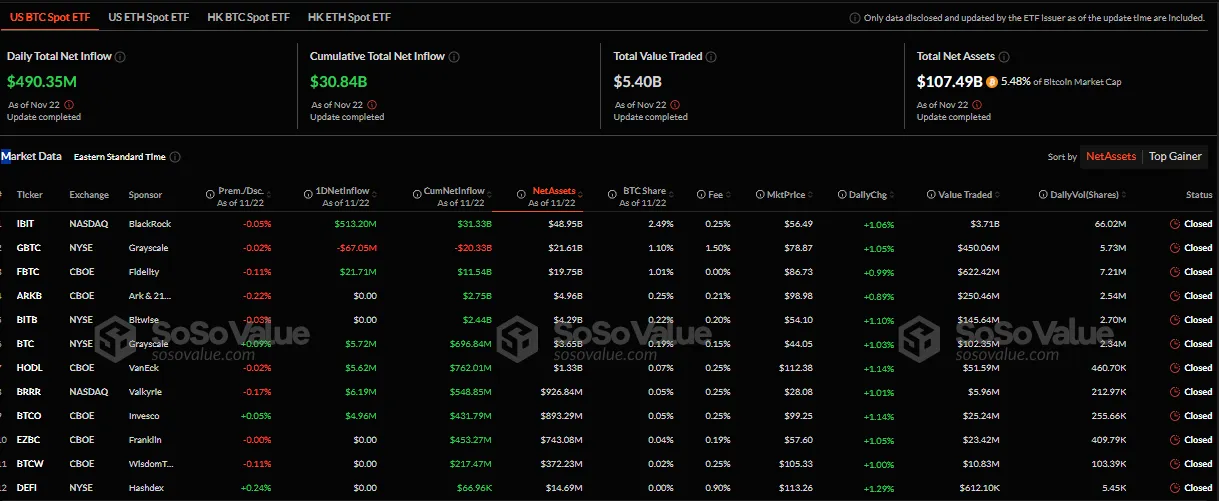
However, the growing adoption of Bitcoin ETFs (exchange-traded funds), which are attracting significant institutional interest, is driving Bitcoin’s rise. According to data on SoSoValue, the cumulative total net inflow for Bitcoin ETFs reached $30.84 billion as of November 22, when markets closed on Friday.
While all eyes were on MSTR, ETFs quietly ingested more than 10x the amount of BTC mined last week. Pac-Man mode activated,” quipped Eric Balchunas, an ETF analyst with Bloomberg Intelligence.
Amid the growing optimism, Balchunas recently noted that US spot ETFs are 98% to passing Satoshi as the world’s biggest BTC holder. Similarly, analysts predict Bitcoin’s upward trajectory could extend to $115,000 this holiday season. Whale activity and long-term holders capitalizing on the current rally bolster the enthusiasm.
MicroStrategy’s Michael Saylor, a vocal Bitcoin advocate, hinted at expanding the company’s Bitcoin holdings, further solidifying institutional confidence in the asset.
Solana (SOL) emerged as a strong contender among altcoins, recording $16 million in inflows last week. This significantly outpaced Ethereum’s $2.8 million. However, on a year-to-date basis, Solana still trails Ethereum, which remains the dominant altcoin with substantially higher total inflows.
Solana’s recent success can be attributed to increasing optimism surrounding Solana-based ETFs. With multiple filings from VanEck, 21Shares, and Bitwise, among others, investor confidence in Solana’s ecosystem has surged.
These ETFs are expected to broaden access to Solana’s technology for retail and institutional investors alike, pending SEC (Securities and Exchange Commission) approvals.
As Bitcoin and broader crypto markets continue their ascent, optimism remains tempered with caution. Market watchers like CryptoQuant caution against over-exuberance, warning of a possible price correction after Bitcoin’s recent climb. Other skeptics, including Justin Bons of Cyber Capital, raised concerns over the cryptocurrency’s vulnerability to liquidity risks.
On the one hand, analysts predict sustained growth driven by ETFs, institutional adoption, and strong market sentiment. On the other hand, warnings of over-leveraged positions and liquidity risks suggest that a pullback could follow this bullish phase. How long this momentum will persist depends on regulatory developments, market sentiment, and macroeconomic factors.
Disclaimer
In adherence to the Trust Project guidelines, BeInCrypto is committed to unbiased, transparent reporting. This news article aims to provide accurate, timely information. However, readers are advised to verify facts independently and consult with a professional before making any decisions based on this content. Please note that our Terms and Conditions, Privacy Policy, and Disclaimers have been updated.


This week, three US economic events will be on crypto traders’ and investors’ watchlists. The interest comes amid the continued influence of US macroeconomic data on Bitcoin (BTC) and crypto prices in 2024, after drying up last year.
Meanwhile, Bitcoin remains just shy of the $100,000 psychological level, hovering above $98,000 after retracting to the $95,000 range over the weekend.
Minutes of Fed’s November FOMC Meeting
All eyes will be on the Federal Reserve (Fed) on Tuesday, November 26, for the minutes of the November 6 FOMC (Federal Open Market Committee) meeting. Traders and investors will be watching to see if the FOMC minutes shed some more light on how the policymakers assessed the economy leading up to the November meeting.
The minutes may also show at least some discussion about possible economic implications following the US election outcome. They will come after policymakers voted to cut interest rates by 25 basis points (bps), following an initial 50 bps reduction in September. Investors will be looking for any clues on whether the pace of rate cuts could drop from here.
Meanwhile, data continues to suggest the US economy is holding up well. Still, fears abound that President-elect Donald Trump’s proposed policies may be inflationary, potentially reducing the need for lower rates.
“Experts say Donald Trump’s election victory could shift interest rate policy in the US as his promised policies risk higher inflation…Tradition tells us that that increase in tariffs will increase inflation in the US,” The Canadian Press reported, citing Sheila Block, an economist with the Canadian Centre for Policy Alternatives.
One way the FOMC minutes could affect Bitcoin and crypto is through their impact on the overall market sentiment. Any dovish or hawkish tones in the minutes can influence market expectations and lead to changes in investor behavior.
Initial Jobless Claims
Another key US economic event this week is the release of initial jobless claims on Wednesday, November 27. Labor market weakness was a concern through the summer and fall, with rising jobless claims, an increased unemployment rate, and slower monthly job gains. This data influenced the Federal Reserve’s decision to cut interest rates by half a percentage point in September.
However, since then, labor market data has come in better than expected, with the unemployment rate falling from a peak of 4.3% to 4.1%. The previous initial jobless claims data came in at 213,000 for the week ending November 16, below the estimate of 220,000, which was a good sign.
“US initial jobless claims fell by 6,000 to 213,000 last week, the lowest since April. The labor market is strong,” the publisher of the Lead-Lag Report noted.
Weekly unemployment claims have been steadily decreasing after reaching a peak in over a year this past October. While initial jobless claims are falling, the rise in continuing claims indicates that employers are striving to retain workers. However, those who lose their jobs are facing challenges in securing new employment.
“Initial jobless claims remain very slow but continuing claims hit a three-year high. This reinforces that employers aren’t actively laying workers off, but they aren’t hiring, either,” Sevens Report commented.
For now, things appear to be okay on the labor side of the Federal Reserve’s dual mandate. If the trend continues, it would suggest that economic hardship is reversing and that the labor market is gaining strength. This could lead to increased consumer spending and investment in traditional assets like Bitcoin and crypto.
US PCE Inflation
Crypto market participants will also watch Wednesday’s October US PCE (Personal Consumption Expenditures) inflation data, as this is the Fed’s preferred gauge. The November PCE index on Wednesday is also a good watch. The data will show whether inflation continued to slow in November.
“Expectations: Monthly PCE expected to rise by 0.2% Annual PCE expected at 2.3% Core PCE monthly increase at 0.3% Core PCE annual increase at 2.8%,” data on MarketWatch shows.
Rising PCE figures often raise concerns about higher inflation levels in the economy. If PCE inflation exceeds expectations, it could weaken the US dollar as investors anticipate potential monetary policy actions, such as interest rate hikes. A weaker dollar tends to benefit Bitcoin and other cryptocurrencies, which often show an inverse correlation with the USD.
In such scenarios, investors may turn to alternative assets like Bitcoin as a hedge against inflation. Cryptocurrencies are frequently seen as a store of value, similar to gold, during periods of inflationary pressure.
Currently, the Federal Reserve remains optimistic that inflation is nearing its 2% target. Policymakers have maintained interest rates at historically high levels to combat the inflation surges of the past two years. In this context, traders and investors are closely monitoring price data for positive signs that could prompt the Fed to begin easing interest rates.
Disclaimer
In adherence to the Trust Project guidelines, BeInCrypto is committed to unbiased, transparent reporting. This news article aims to provide accurate, timely information. However, readers are advised to verify facts independently and consult with a professional before making any decisions based on this content. Please note that our Terms and Conditions, Privacy Policy, and Disclaimers have been updated.

Michael Saylor, co-founder of MicroStrategy, has hinted at the possibility of additional Bitcoin purchases.
In a November 24 post on X (formerly Twitter), Saylor teased the company’s plans following its successful $3 billion fundraising round on November 22.
MicroStrategy’s $3 Billion Raise Could Fuel New Bitcoin Purchases
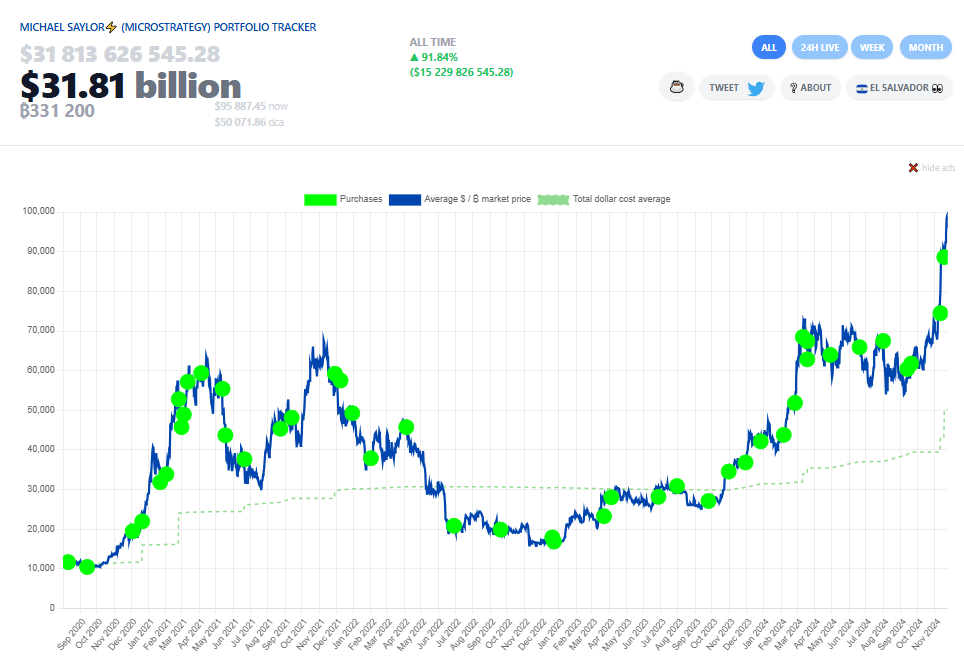
The Bitcoin bull mentioned that MicroStrategy’s portfolio tracker, SaylorTracker, “needs more green dots.” These markers symbolize the company’s each Bitcoin acquisition, fueling speculation about another significant purchase.
Saylor’s recent hints echo his previous two Sunday posts, which preceded announcements of large-scale Bitcoin acquisitions. During this period, MicroStrategy added approximately 80,000 BTC to its holdings, worth over $6 billion at the time.
Meanwhile, the recent $3 billion funding — raised through the issuance of convertible debt — could be instrumental in financing these new acquisitions. The convertible notes, sold privately to institutional investors under US securities laws, will mature on December 1, 2029. These notes carry a 55% premium and an implied strike price of $672 per share of MicroStrategy’s Class A common stock.
Market observers noted that this fundraiser aligns with MicroStrategy’s ambitious “21/21” initiative, which aims to raise $42 billion over three years through a mix of equity and fixed-income instruments.
The company remains the largest Bitcoin-holding public entity, with 331,200 BTC valued at over $32.7 billion. According to Saylor, MicroStrategy’s treasury operations have delivered a year-to-date Bitcoin yield of 41.8%, generating a net benefit of around 79,130 BTC, or roughly 246 BTC daily, without the operational costs associated with mining.
Additionally, this strategy has also bolstered MicroStrategy’s stock performance. MSTR shares have surged over 515% since the start of the year, making it one of the most actively traded stocks in the US.
Saylor emphasized that MicroStrategy’s operations are driven by its Bitcoin holdings, which are optimized through strategic financial tools like ATM offerings, enabling the company to reduce risk and volatility while enhancing shareholder value.
“MicroStrategy is powered by its Bitcoin treasury operations. We sell volatility through our ATM offerings, strip BTC risk, volatility, and performance from our fixed-income securities, and transfer that performance to our MSTR equity holders,” he stated.
Disclaimer
In adherence to the Trust Project guidelines, BeInCrypto is committed to unbiased, transparent reporting. This news article aims to provide accurate, timely information. However, readers are advised to verify facts independently and consult with a professional before making any decisions based on this content. Please note that our Terms and Conditions, Privacy Policy, and Disclaimers have been updated.

Bullish Run Faces Key Challenges

WHY & CHEEMS Under Investors’ Radars As Binance Expands Support, What’s Next?

Zircuit, HashKey, Kima Network, & More
Crypto Inflows Soar to Record $3.13 Billion

Ripple Announces First Tokenized Money Market Fund on XRP Ledger

Why the XLM Price Rally May Reach the $0.91 All-Time High

2.52 Million Altcoins Are Ruining Crypto’s Future

Animoca Brands Valuation Tanks 75% In Two Years, Here’s Why

Crypto exchange BingX hacked for $43 million

Are The Big Players Losing Interest?

Hong Kong’s Securities Association Tips Authorities On Crypto Self-Regulation

Coinbase cbBTC Set to go Live on Solana
2.52 Million Altcoins Are Ruining Crypto’s Future
Animoca Brands Valuation Tanks 75% In Two Years, Here’s Why
Crypto exchange BingX hacked for $43 million
Are The Big Players Losing Interest?
Hong Kong’s Securities Association Tips Authorities On Crypto Self-Regulation
Coinbase cbBTC Set to go Live on Solana
-
 Market24 hours ago
Can the SAND Token Price Rally Be Sustained?
-

 Bitcoin23 hours ago
Bitcoin Whales Remain Determined, $3.96 Billion Worth Of BTC Gobbled Up In 96 Hours
-
 Altcoin10 hours ago
Super Pepe Coin Whale Sells 130B PEPE, Shifts Focus To EIGEN
-

 Market23 hours ago
Cantor Fitzgerald Deepens Tether Ties With 5% Stake Acquisition
-

 Market9 hours ago
Harmful Livestreams Prompt Ban Calls
-

 Bitcoin22 hours ago
$100K Bitcoin Is Only The Beginning, VanEck Targets $180K
-

 Market21 hours ago
Why Ethereum Price May Fall Under $3,000
-

 Bitcoin20 hours ago
Bitcoin Bull Saylor Hints at Expanding MicroStrategy’s Holdings