
Bitcoin
Bitcoin ETFs See $2.4 Billion Inflows in Last 3 Weeks
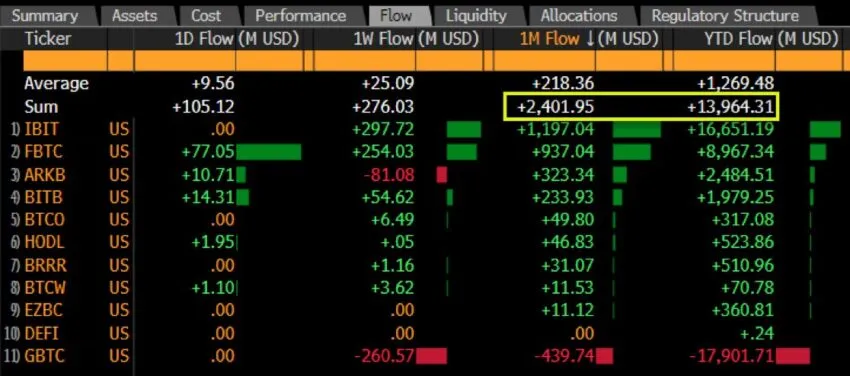
Bitcoin ETFs are gaining momentum, with reports indicating up to $105 million in positive flows on Monday. This brings the cumulative inflows to nearly $2.40 billion in the last three weeks.
Experts ascribe the inflows to increased global liquidity, which can boost the Bitcoin price by improving market sentiment.
Bitcoin ETFs Demand Returns with $105 Million Inflows on Monday
Bitcoin ETFs market rebound continues to strengthen, with reports showing $105 million inflows on June 3. This marks 15 consecutive trading days (three weeks) of positive flows and brings the cumulative inflows to $2.40 billion, as the on-chain data platform SpotOnChain shows.
Fidelity took the day with its Bitcoin ETF, FBTC, recording up to $77 million (over 1,110 BTC) in inflows on Monday. Meanwhile, Grayscale’s GBTC and BlackRock’s IBIT recorded zero net flows the same day. Bitwise ETF, BITB, recorded $14 million in inflows, while Ark21Shares’ ARKB ETF saw up to $10 million in positive flows.
Read more: How To Trade a Bitcoin ETF: A Step-by-Step Approach
The spike in inflows coincides with an increase in global liquidity. Bitcoin analyst Willy Woo highlights that the relationship between BTC price and M2 expansion reflects broader market sentiment and economic conditions.
A high M2 expansion indicates a loose monetary policy and increased money supply. In response, Bitcoin’s price often rises as investors seek alternative assets for potential returns.
Notably, Bitcoin’s price usually reacts positively to increases in the money supply and inflation concerns. This happens as investors see BTC as a hedge against traditional fiat currencies such as the US dollar, which could depreciate because of inflation.
BTC Price is in the Accumulation Phase
Bitfinex analysts noted in a Monday market update that Bitcoin ETF inflows for the last two weeks have averaged $136M [million] per day. “This is 4x the $32M daily sell pressure from miners,” they said, observing that Bitcoin is in an accumulation period.
The analysts also highlighted that the correction phase could be nearing its end. They ascribed the recent drop from $73,777 to selling activity among long-term holders. The report indicates that long-term holders have started to re-accumulate BTC for the first time since December 2023.
Investor confidence has risen since the April 20 Bitcoin halving, reinforcing the bullish thesis. This can be seen in the surge in Bitcoin’s realized capitalization, approaching $600 billion.
Also Read: Bitcoin Halving Cycles and Investment Strategies: What To Know
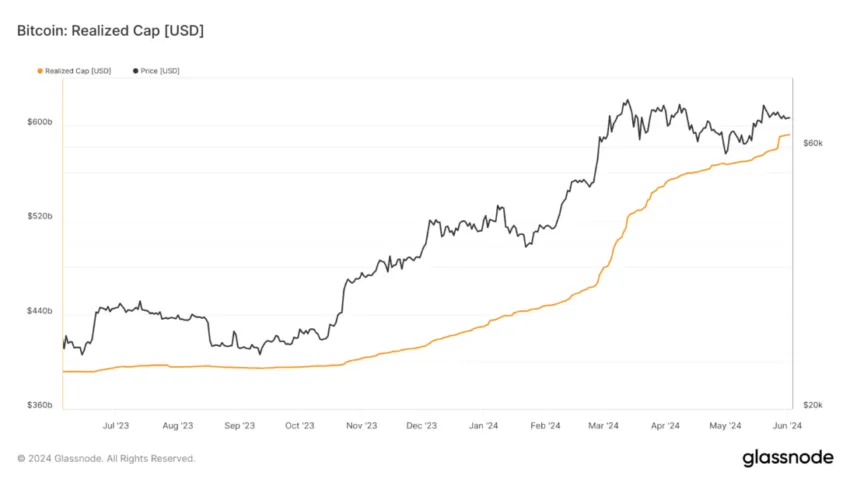
The BTC Realized Cap metric shows Bitcoin’s true value based on the price at which coins last moved. It provides a unique perspective on market dynamics, investor behavior, and historical trends within the Bitcoin ecosystem.
Bitcoin Dynamics Outlook Amid Shifting Investor Sentiment
The Bitcoin price has continued to consolidate along an ascending trend line since May 1, with a series of higher lows. Standing 22% above the range low of $56,552, BTC looks primed for more gains as it attempts to break consolidation.
Tailwinds sprout from a buy signal executed when the Relative Strength Index (RSI) crosses above the signal line (yellow band). Traders heeding this call could see Bitcoin’s price head north. The Awesome Oscillator’s position in positive territory reveals bullish sentiment, adding credence to the bullish thesis.
On the flip side, the volume profile shows that while there is a lot of bullish activity (orange nodes) waiting to interact with Bitcoin price at current levels, there is even more bearish activity (grey nodes). With this, the bulls must haul BTC above the $72,149 threshold for Bitcoin price to escape the thicket.
Read more: Bitcoin (BTC) Price Prediction 2024/2025/2030
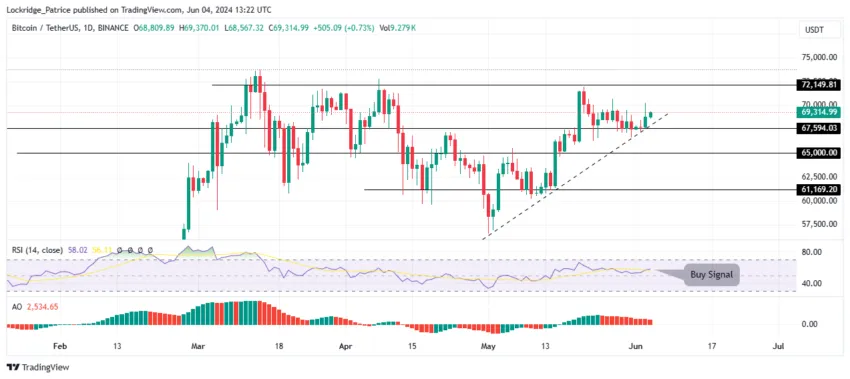
A drop below $67,594 could trigger panic selling, potentially pushing the price down to $65,000. If that level doesn’t hold, Bitcoin could revisit the $61,169 support level, presenting a potential buying opportunity for investors.
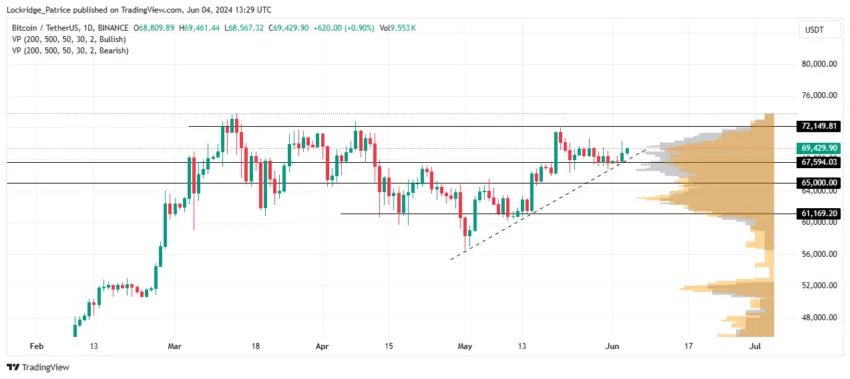
In a dire case where bearish momentum abounds, a candlestick close below $56,000 would invalidate the bullish outlook. At the time of writing, Bitcoin price is trading at $69,429.
Disclaimer
All the information contained on our website is published in good faith and for general information purposes only. Any action the reader takes upon the information found on our website is strictly at their own risk.


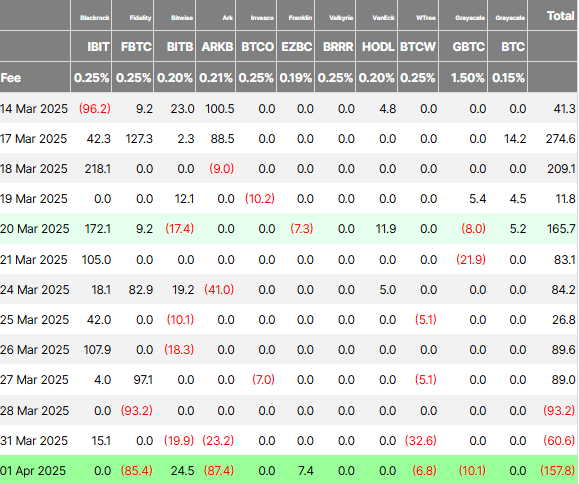
Bitcoin ETFs (exchange-traded funds) continue to record negative flows this week as President Trump’s Liberation Day countdown continues.
Sentiment is cautious across crypto markets, with traders and investors adopting a wait-and-see approach.
Bitcoin ETF See Outflows Amid Investor Caution
Data on Farside Investors shows two consecutive days of net outflows for Bitcoin ETFs since Monday. Financial instruments from Bitwise (BITB), Ark Invest (ARKB), and WisdomTree (BTCW) were in the frontline for Monday’s $60.6 million outflows, with only BlackRock’s IBIT seeing positive flows.
Meanwhile, Tuesday saw even more outflows, approaching $158 million, with Bitwise and Ark Invest leading the charge. Then, on April 1, BlackRock’s IBIT recorded zero flows. Meanwhile, Ethereum ETFs recorded net outflows of $3.6 million, data on Farside shows. This suggests a cautious sentiment among institutional investors.
“The Spot Bitcoin ETFs saw $157.8 million outflow yesterday. The Spot Ethereum ETFs saw a $3.6 million outflow. Institutions are reducing risk ahead of today’s tariff announcement,” analyst Crypto Rover noted.
Indeed, sentiment suggests traders are exercising caution, choosing to remain in “wait-and-see” mode. The caution comes ahead of Trump’s Liberation Day announcement, which is due later in the day on April 2.
With POTUS poised to unveil sweeping new tariffs, traders and investors across financial playing fields wait to see the scope of an onslaught that could spark a global trade war. Specifically, there is generally very little information about the tariffs’ specifics, which creates uncertainty regarding their impact on the broader economy and the crypto market.
“The White House has not reached a firm decision on their tariff plan,” Bloomberg reported, citing people close to the matter.
Despite the lack of clarity, it is understandable why investors would be cautious considering the impact of previous tariff announcements on Bitcoin price. Meanwhile, analysts predict extreme market volatility, with potential stock and crypto crashes reaching 10-15% if Trump enforces broad tariffs.
“April 2nd is similar to election night. It is the biggest event of the year by an order of magnitude. 10x more important than any FOMC, which is a lot. And anything can happen,” economic analyst Alex Krüger predicted.
While sentiment is cautious in the crypto market, some investors are channeling toward gold as a safe haven. A Bank of America survey showed that 58% of fund managers prefer gold as a trade war safe haven, while only 3% back Bitcoin.
These findings came as institutional investors cite Bitcoin’s volatility and limited crisis-time liquidity as key barriers to its safe-haven adoption. Trade tensions have historically driven capital into safe-haven assets.
With Trump’s Liberation Day announcement looming, investors preemptively position themselves again, favoring gold over Bitcoin.
Nevertheless, despite Bitcoin’s struggle to capture institutional safe-haven flows, its long-term narrative remains intact. This is seen with Bitcoin supply on exchanges dropping to just 7.53%, the lowest since February 2018.
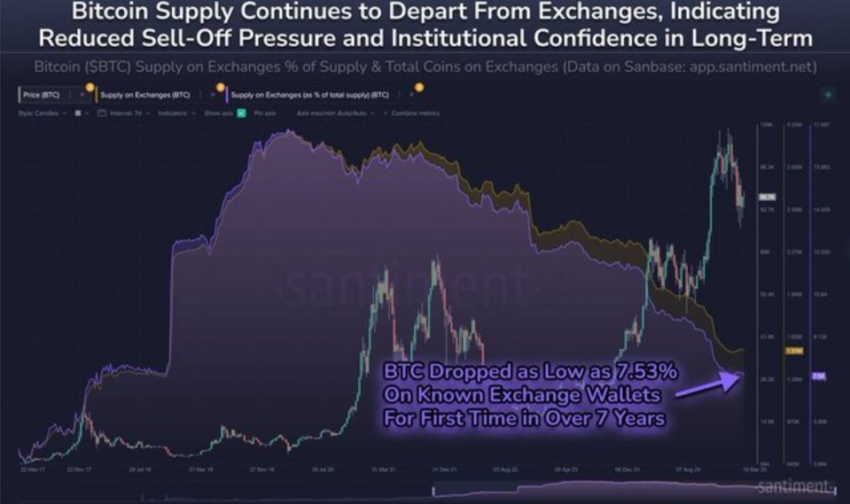
When an asset’s supply on exchanges reduces, investors are unwilling to sell, suggesting strong long-term holder confidence.
Disclaimer
In adherence to the Trust Project guidelines, BeInCrypto is committed to unbiased, transparent reporting. This news article aims to provide accurate, timely information. However, readers are advised to verify facts independently and consult with a professional before making any decisions based on this content. Please note that our Terms and Conditions, Privacy Policy, and Disclaimers have been updated.


Bitcoin may be a useful hedge against inflation in the near future as market uncertainty is growing. In the long run, it may also be useful to envision Bitcoin differently, treating it as a barometer for the tech industry.
Standard Chartered’s Head of Digital Assets Research and WeFi’s Head of Growth both shared exclusive comments with BeInCrypto regarding this topic.
Bitcoin: Inflation Hedge or Magnificent 7 Candidate?
Since the early days of the crypto space, investors have been using it as a hedge against inflation. However, it’s only recently that institutional investors are beginning to treat it the same way. According to Geoff Kendrick, Head of Digital Assets Research at Standard Chartered, the trend of Bitcoin as an inflation hedge is increasing.
Still, this view may be too narrow in a few ways. Since the Bitcoin ETFs were first approved, BTC has been increasingly well-integrated with traditional finance. Kendrick noted this, saying that it is highly correlated with the NASDAQ in the short term. He claimed that Bitcoin might represent more than an inflation hedge, instead serving as an ersatz tech stock:
“BTC may be better viewed as a tech stock than as a hedge against TradFi issues. If we create a hypothetical index where we add BTC to the ‘Magnificent 7’ tech stocks, and remove Tesla, We find that our index, ‘Mag 7B’, has both higher returns and lower volatility than Mag 7,” Kendrick said in an exclusive interview with BeInCrypto.
This comparison is particularly apt for a few reasons. Tesla’s stock price is heavily entangled with Bitcoin, but it’s also been dropping due to political controversies. If Bitcoin were to replace Tesla’s position in the Magnificent 7, it may be a welcome addition. Of course, there is currently no mechanism to cleanly treat Bitcoin as a similar type of product. That could change.
However, Bitcoin’s role as an inflation hedge might be more immediately relevant. As Trump’s Liberation Day approaches, the crypto markets are becoming increasingly nervous about new US tariffs. As Agne Linge, Head of Growth at WeFi, said in an exclusive interview, these fears are impacting all risk-on assets, Bitcoin included.
“Crypto markets are closely tracking investor sentiment ahead of Trump’s…tariff announcement, with growing concerns over the potential economic impact. Bitcoin’s increasing correlation with traditional markets has amplified its exposure to broader macroeconomic trends, making it more sensitive to the risk-off sentiment that has affected equity markets,” Linge claimed.
She went on to state that US economic uncertainty was at record levels, surpassing both the 2008 financial crisis and the pandemic in April 2020. In these circumstances, recent inflation indicators are showing expected rates above expectations.
In such an environment, the crypto market is sure to take a hit, but traditional finance and the dollar is also in great jeopardy. All that is to say, Bitcoin is likely to be a solid inflation hedge in the near future. Even if it falls dramatically, it has worldwide appeal and the ability to rebound.
Disclaimer
In adherence to the Trust Project guidelines, BeInCrypto is committed to unbiased, transparent reporting. This news article aims to provide accurate, timely information. However, readers are advised to verify facts independently and consult with a professional before making any decisions based on this content. Please note that our Terms and Conditions, Privacy Policy, and Disclaimers have been updated.


Michael Saylor, one of the most outspoken supporters of Bitcoin, is back and bolder than ever. In a recent statement, the former MicroStrategy CEO predicted that the alpha coin will potentially hit a $500 trillion market cap. Saylor’s bold prediction for the world’s top digital asset comes during the intensified push for a Strategic Bitcoin Reserve (SBR).
In his latest pro-crypto statement, Saylor argued that the digital asset will “demonetize gold”, then it will demonetize real estate, which he calculated as 10x more than gold. To summarize his argument, Saylor further states that Bitcoin will demonetize “all long-term store of value”.
Push For SBR Gains Ground
Saylor’s latest statement comes as Congress intensifies its efforts to build the country’s BTC holdings. United States President Donald Trump formalized the plans to build crypto holdings through an executive order to establish a strategic crypto reserve that will initially include $17 billion worth of BTC that the country currently controls.
Michael Saylor: Bitcoin Headed to $500 Trillion 🚀₿
– At Digital Asset Summit, MicroStrategy’s Saylor predicted:
• BTC will reach $500T market cap
• It will “demonetize gold, real estate & all long-term stores of value”
– Capital shift: “From physical to digital, from…— AFV GLOBAL (@afvglobal) March 28, 2025
According to the president, additional acquisitions of cryptocurrency are allowed, provided these are done through “budget-neutral” approaches. Senator Cynthia Lummis initially proposed in the Senate, through the Bitcoin Act, the plan to create a Bitcoin reserve. Under the proposal, the administration can purchase 1 million Bitcoin to complement the reserve.
Saylor Explains Crypto’s Role During Blockchain Summit
Saylor’s latest prediction on Bitcoin was made during his appearance at the DC Blockchain Summit. He was joined on stage by Jason Les, the CEO of Rito Platforms, and Lummis, the principal author of the Bitcoin Act.
During the program, Saylor was asked about America’s need for Bitcoin. Saylor answered with conviction, saying the rising importance of BTC is inevitable and will happen with the US’ participation. During his talk, he shared that Bitcoin, created by the enigmatic Satoshi Nakamoto, is unstoppable.
Image: Gemini Imagen
Saylor added that the premier digital asset is the next stage in money’s evolution, and it’s currently absorbing value from traditional assets like currency reserves and real estate.
Saylor Predicts Top Coin Will Reach $500 Trillion In Market Cap
During his talk, Saylor predicted that BTC will eventually grow from $2 billion to $20 billion, which can hit $200 billion and beyond. Finally, he thinks the asset can achieve a $500 trillion market capitalization, reflecting more than 29,000% increase from its current market capitalization of $1.67 trillion.
Saylor’s recent bold prediction aligns with his firm conviction and support for the asset. He argues that Bitcoin’s unique features, its decentralized nature and fixed supply, make it a perfect hedge against economic uncertainties like inflation.
Featured image from Gemini Imagen, chart from TradingView
Editorial Process for bitcoinist is centered on delivering thoroughly researched, accurate, and unbiased content. We uphold strict sourcing standards, and each page undergoes diligent review by our team of top technology experts and seasoned editors. This process ensures the integrity, relevance, and value of our content for our readers.

VanEck Sets Stage for BNB ETF with Official Trust Filing

Pi Network Faces Community Backlash, Is Pi Coin Price Heading to Zero?

XRP Recovery Stalls—Are Bears Still In Control?

Institutional Risk Aversion Drives $218 Million Bitcoin ETF Outflows

PENDLE Price Jumps 8% Today Amid Huge Whale Accumulation

Experts Raise Red Flags Over Finances

2.52 Million Altcoins Are Ruining Crypto’s Future

Animoca Brands Valuation Tanks 75% In Two Years, Here’s Why

Crypto exchange BingX hacked for $43 million

Are The Big Players Losing Interest?

Hong Kong’s Securities Association Tips Authorities On Crypto Self-Regulation

Coinbase cbBTC Set to go Live on Solana
2.52 Million Altcoins Are Ruining Crypto’s Future
Animoca Brands Valuation Tanks 75% In Two Years, Here’s Why
Crypto exchange BingX hacked for $43 million
Are The Big Players Losing Interest?
Hong Kong’s Securities Association Tips Authorities On Crypto Self-Regulation
Coinbase cbBTC Set to go Live on Solana
-

 Market23 hours ago
Bitcoin Price Battles Key Hurdles—Is a Breakout Still Possible?
-
 Market24 hours ago
Is CZ’s April Fool’s Joke a Crypto Reality or Just Fun?
-

 Bitcoin20 hours ago
$500 Trillion Bitcoin? Saylor’s Bold Prediction Shakes the Market!
-
 Altcoin19 hours ago
Will XRP, SOL, ADA Make the List?
-

 Bitcoin21 hours ago
Big Bitcoin Buy Coming? Saylor Drops a Hint as Strategy Shifts
-

 Market20 hours ago
Coinbase Stock Plunges 30% in Worst Quarter Since FTX Collapse
-
 Market18 hours ago
Trump’s USD1 Stablecoin Eyes Trust Recovery in Crypto
-
 Altcoin17 hours ago
BTC, ETH, XRP, DOGE Fall Following Weak PMI, JOLTS Data