
Market
5 DePin Altcoins to Add to Your Portfolio in June 2024

Decentralized Physical Infrastructure Networks (DePIN) have emerged as a groundbreaking sector. With several projects taking clear strides to be the best within the category.
These projects aim to decentralize and democratize the internet’s infrastructure layer, creating immense potential for growth and innovation. Here are five DePIN projects that show promising technical setups and could be valuable additions to your portfolio.
Render (RNDR)
Render coin (RNDR) is the lifeblood of the Render Network, a special DePIN platform that utilizes blockchain tech to connect artists with unused processing power from other people’s computers.
Imagine you’re an artist working on a project that requires intense 3D rendering, like creating special effects for a movie. Traditionally, this would necessitate a powerful computer, which can be expensive. The Render Network lets you tap into the unused graphics processing unit (GPU) power of other computers on the network. Folks lending out their GPU power earn RNDR tokens in return.
Render’s market cap fluctuates around $3.8 billion, ranking it the 31st largest cryptocurrency by market capitalization.
RNDR Technical Outlook:
Render’s price has shown strength over the past two months, rebounding from a major correction to the $6 level and now trading at $10. The key support level is the 1D Ichimoku cloud, as shown in the chart.
If the price breaks below the cloud, it could present a good buying opportunity for RNDR.
Read More: Render Token (RNDR): A Guide to What It Is and How It Works
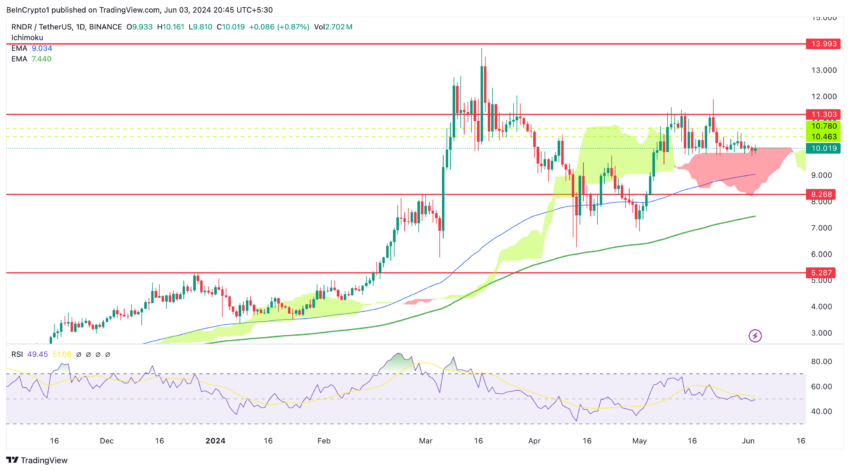
Render (RNDR) is currently trading at $10.01. The key resistance levels are $10.78, $11.30, and $13.99. These levels mark significant points where the price has previously struggled to break through. On the support side, the immediate support level is at $9.03, indicated by the EMA line.
Other crucial support levels are $8.26 and $5.28, the latter offering a major buying opportunity if the price dips this far. The 1D Ichimoku cloud shown in the chart acts as a key support zone, and a break below this cloud could present a good buying opportunity for RNDR.
Phala (PHA)
Phala Network is a DePIN blockchain-based cloud computing service that focuses on privacy. Unlike traditional cloud services, where your data resides on someone else’s servers, Phala offers a way to perform computations on your data without ever revealing the data itself.
This is achieved through a combination of advanced cryptography and specialized hardware.
Phala’s market cap fluctuates around $134.8 million, making it the 398th largest cryptocurrency by market capitalization. This is a highly significant low-cap cryptocurrency to consider investing in, though it also carries higher risk.
PHA Technical Outlook:
Phala’s price has sharply declined from $0.37 to $0.16 and is now trading at $0.1857. Currently, the price is below the daily Ichimoku cloud. If it manages to break above the cloud, it could present significant upside potential for investors.
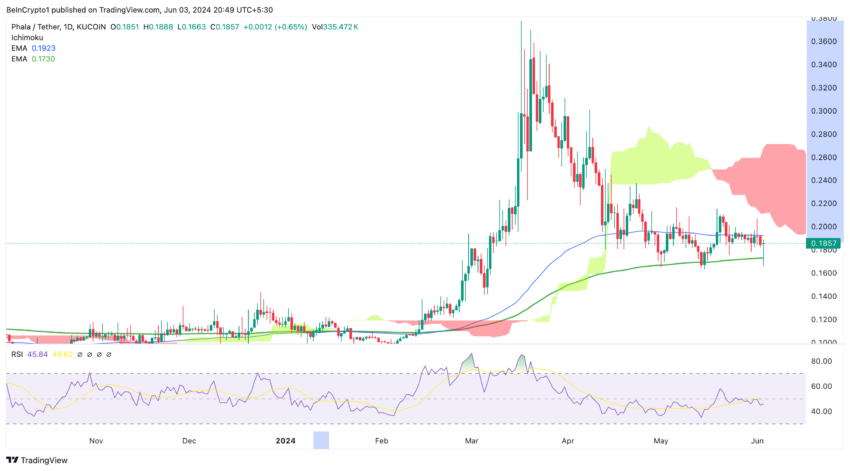
Additionally, if the price breaks below the 200 EMA in green, this could lead to a further price correction, as the price is currently consolidating and finding the 200 EMA as an important support level. Monitoring these levels will be crucial for making informed investment decisions.
Nosana (NOS)
Nosana is a DePIN crowd-computing platform built on the Solana blockchain. It functions by connecting individuals with spare CPU power on their devices to projects that require a computational boost.
In return, people contributing their CPU power earn NOS tokens, the platform’s native cryptocurrency.
Why is Nosana Important?
Nosana offers a unique take on cloud computing with a couple of key advantages:
- Democratized Access to Processing Power: Projects requiring intensive computational resources can access them through a distributed network, making powerful computing more affordable and accessible.
- Monetization of Unused Resources: Individuals with idle CPU capacity on their devices can generate additional income by renting it out to the network.
- Eco-Friendly Alternative: Nosana leverages underutilized personal devices, reducing reliance on large data centers that consume significant energy.
NOS Technical Outlook:
Nosana (NOS) is currently trading inside the 1D Ichimoku cloud. The price has tested the lower boundary of the cloud, which is a bullish sign, highlighting the importance of monitoring this technical indicator.
Read More: Is DePIN the Dark Horse of the Next Crypto Bull Run?
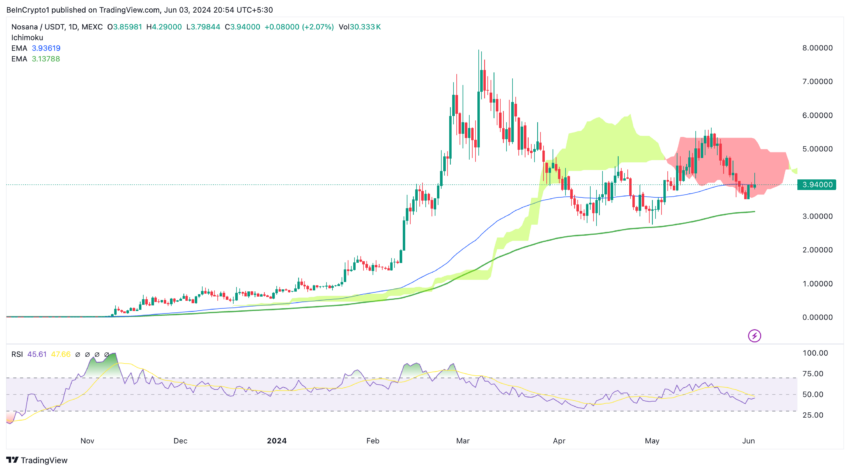
The EMA 100 D, shown in blue, is acting as a major support level. A breakout below the 200 EMA could signal further price depreciation. Despite recent fluctuations, NOS remains an attractive coin within the Solana ecosystem.
JasmyCoin (JASMY)
Jasmy coin (JASMY) is the native cryptocurrency that fuels the DePIN Jasmy ecosystem. This project centers around the Internet of Things (IoT) and aims to empower users with control over their data.
JASMY Technical Outlook
Jasmy has gained 100% from May 26 to the present, leading to an overbought condition. We anticipate a correction to the $0.027 – $0.030 range, with the 4H Ichimoku cloud being a key level to watch. Although the uptrend may continue, investing at current prices presents a risk.
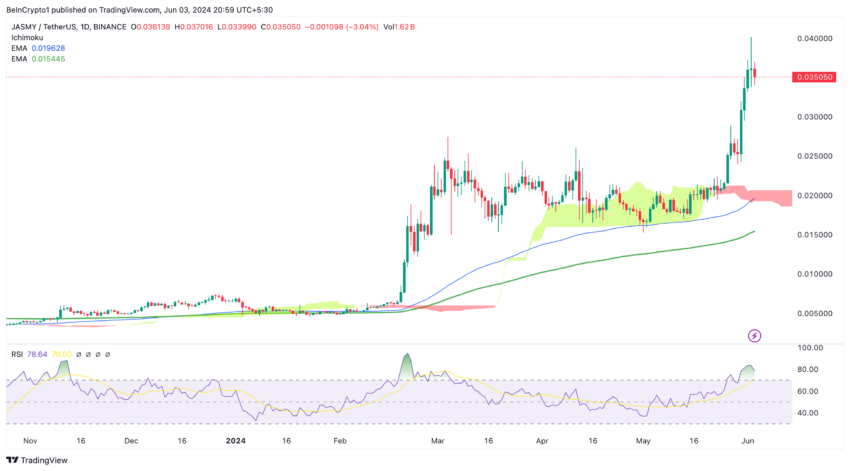
Waiting for the 4H Ichimoku cloud correction could be a wise move for prudent investors.
Jasmy coin has flipped many cryptos in the market cap ranking, making it the 68th largest crypto by market capitalization, currently fluctuating around $1.7 billion.
Golem (GLM)
Golem Network is a decentralized platform that disrupts the traditional way we access and share computing resources. In essence, it acts as a giant online marketplace for computational power.
How Does Golem Network Work?
Golem Network functions through a peer-to-peer (P2P) system connecting two types of users:
- Requestors: Individuals or projects need extra computing power for tasks like scientific simulations, 3D rendering, or artificial intelligence (AI) training.
- Providers: People with unused processing power on their computers (CPUs or GPUs) can contribute that power to the network and earn Golem’s native token, GLM.
GLM Technical Outlook:
GLM is trading in a descending pattern, continuing its price correction from $0.66 to $0.47. The current price is $0.49, which could be a good point to invest in GLM long-term. If the price falls below the $0.47 support level, it could be very bearish and potentially send the price down to $0.45 or $0.40.
Read More: Decentralized Physical Infrastructure Network (DePIN) Projects to Watch in 2024
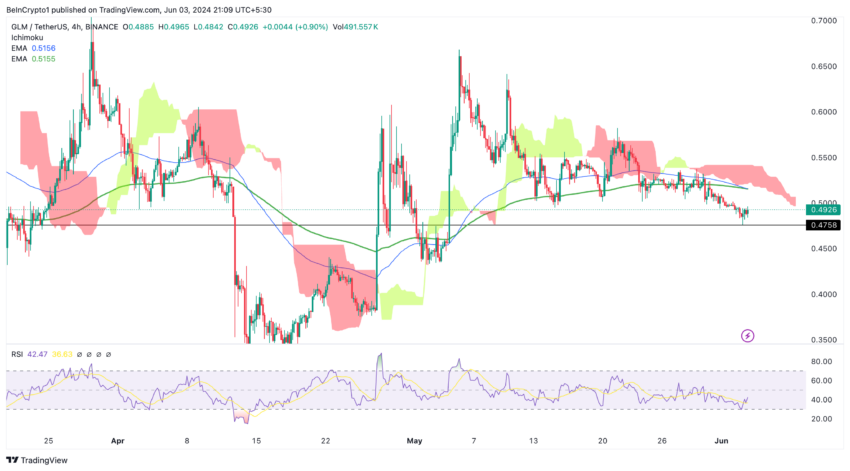
This could present a very good opportunity to invest in GLM. If the price of GLM tests the daily Ichimoku cloud, it could be very bullish and increase volatility. Key resistance levels to watch are $0.60 and $1.
The $1 mark has never been reached, corresponding to a $1 billion market cap in the current circulating supply.
Disclaimer
In line with the Trust Project guidelines, this price analysis article is for informational purposes only and should not be considered financial or investment advice. BeInCrypto is committed to accurate, unbiased reporting, but market conditions are subject to change without notice. Always conduct your own research and consult with a professional before making any financial decisions. Please note that our Terms and Conditions, Privacy Policy, and Disclaimers have been updated.


Reason to trust
![]()
Strict editorial policy that focuses on accuracy, relevance, and impartiality
Created by industry experts and meticulously reviewed
The highest standards in reporting and publishing
Strict editorial policy that focuses on accuracy, relevance, and impartiality
Morbi pretium leo et nisl aliquam mollis. Quisque arcu lorem, ultricies quis pellentesque nec, ullamcorper eu odio.
The XRP price is showing signs of a strong bullish reversal, with a crypto analyst predicting a potential rebound toward $3.5 and even higher. After experiencing significant volatility and undergoing a consolidation due to recent price declines, technical indicators now show support for XRP’s bullish outlook. As a result, the analyst has provided a short—and long-term price target for the cryptocurrency.
XRP Price Projected To Reverse To $3.5
According to ‘Setupsfx’, a crypto analyst on TradingView, XRP is now in a bullish reversal phase, meaning its price is expected to break out of its recent downturn and rise to new highs. Based on the expert’s chart analysis of XRP, the cryptocurrency is predicted to see an explosive increase to $3.5 following the end of its consolidation phase.
Related Reading
The chart indicates that the price of XRP is expected to rise to $3.5 in the coming months. However, from a fundamental analysis perspective, the analyst believes XRP is not limited to this bullish price target and could potentially surpass it to exceed current all-time highs of $3.84.
While the TradingView expert’s analysis of XRP maintains a neutral stance, implying uncertainty in the trend, he has also emphasized the cryptocurrency’s strong potential for growth. Hence, XRP could experience significant upward movement if market conditions align favorably and investor sentiment and confidence strengthen.
For his short-term price target, the crypto analyst forecasts that XRP could rally to a level above $3.5. He advises traders who intend to hold their positions for a short period to aim for this price level, as it could be a strategic exit point before a potential pullback.
Notably, the analyst’s long-term price target for XRP has been set at $4.0 or higher. Considering XRP’s price is currently trading at $2.09, a surge to $4 would represent an almost 100% increase in its price.
Technical Elements Supporting Bullish Reversal
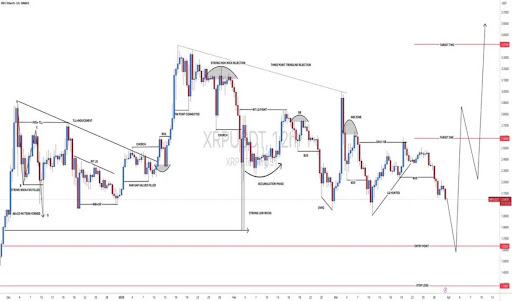
In his chart analysis, Setupsfx highlights XRP’s price action in a 12-hour time frame, showcasing key movements, trends, and technical elements that support his bullish projection. These elements include liquidity and IMB zones, which are areas where price action is expected due to pending orders.
Related Reading
The analyst also highlights an accumulation phase, as XRP has been consolidating at lower levels, signaling the possibility of a potential breakout. The appearance of strong low wicks further indicates that buyers are regaining control of the market.
Finally, the TradingView analyst has indicated that the altcoin has already undergone a three-point trendline rejection, which means it has tested and rejected a resistance level multiple times. The expert’s price chart also provides an ideal entry point for both short and long-term traders, marked at $1.8. A stop loss has also been placed significantly lower around $1.2 to minimize potential losses.
Featured image from iStock, chart from Tradingview.com
Aayush Jindal, a luminary in the world of financial markets, whose expertise spans over 15 illustrious years in the realms of Forex and cryptocurrency trading. Renowned for his unparalleled proficiency in providing technical analysis, Aayush is a trusted advisor and senior market expert to investors worldwide, guiding them through the intricate landscapes of modern finance with his keen insights and astute chart analysis.
From a young age, Aayush exhibited a natural aptitude for deciphering complex systems and unraveling patterns. Fueled by an insatiable curiosity for understanding market dynamics, he embarked on a journey that would lead him to become one of the foremost authorities in the fields of Forex and crypto trading. With a meticulous eye for detail and an unwavering commitment to excellence, Aayush honed his craft over the years, mastering the art of technical analysis and chart interpretation.
As a software engineer, Aayush harnesses the power of technology to optimize trading strategies and develop innovative solutions for navigating the volatile waters of financial markets. His background in software engineering has equipped him with a unique skill set, enabling him to leverage cutting-edge tools and algorithms to gain a competitive edge in an ever-evolving landscape.
In addition to his roles in finance and technology, Aayush serves as the director of a prestigious IT company, where he spearheads initiatives aimed at driving digital innovation and transformation. Under his visionary leadership, the company has flourished, cementing its position as a leader in the tech industry and paving the way for groundbreaking advancements in software development and IT solutions.
Despite his demanding professional commitments, Aayush is a firm believer in the importance of work-life balance. An avid traveler and adventurer, he finds solace in exploring new destinations, immersing himself in different cultures, and forging lasting memories along the way. Whether he’s trekking through the Himalayas, diving in the azure waters of the Maldives, or experiencing the vibrant energy of bustling metropolises, Aayush embraces every opportunity to broaden his horizons and create unforgettable experiences.
Aayush’s journey to success is marked by a relentless pursuit of excellence and a steadfast commitment to continuous learning and growth. His academic achievements are a testament to his dedication and passion for excellence, having completed his software engineering with honors and excelling in every department.
At his core, Aayush is driven by a profound passion for analyzing markets and uncovering profitable opportunities amidst volatility. Whether he’s poring over price charts, identifying key support and resistance levels, or providing insightful analysis to his clients and followers, Aayush’s unwavering dedication to his craft sets him apart as a true industry leader and a beacon of inspiration to aspiring traders around the globe.
In a world where uncertainty reigns supreme, Aayush Jindal stands as a guiding light, illuminating the path to financial success with his unparalleled expertise, unwavering integrity, and boundless enthusiasm for the markets.

Global investment management firm VanEck has officially registered a statutory trust in Delaware for Binance’s BNB (BNB) exchange-traded fund (ETF).
This move marks the first attempt to launch a spot BNB ETF in the United States. It could potentially open new avenues for institutional and retail investors to gain exposure to the asset through a regulated investment vehicle.
VanEck Moves Forward with BNB ETF
The trust was registered on March 31 under the name “VanEck BNB ETF” with filing number 10148820. It was recorded on Delaware’s official state website.

The proposed BNB ETF would track the price of BNB. It is the native cryptocurrency of the BNB Chain ecosystem, developed by the cryptocurrency exchange Binance.
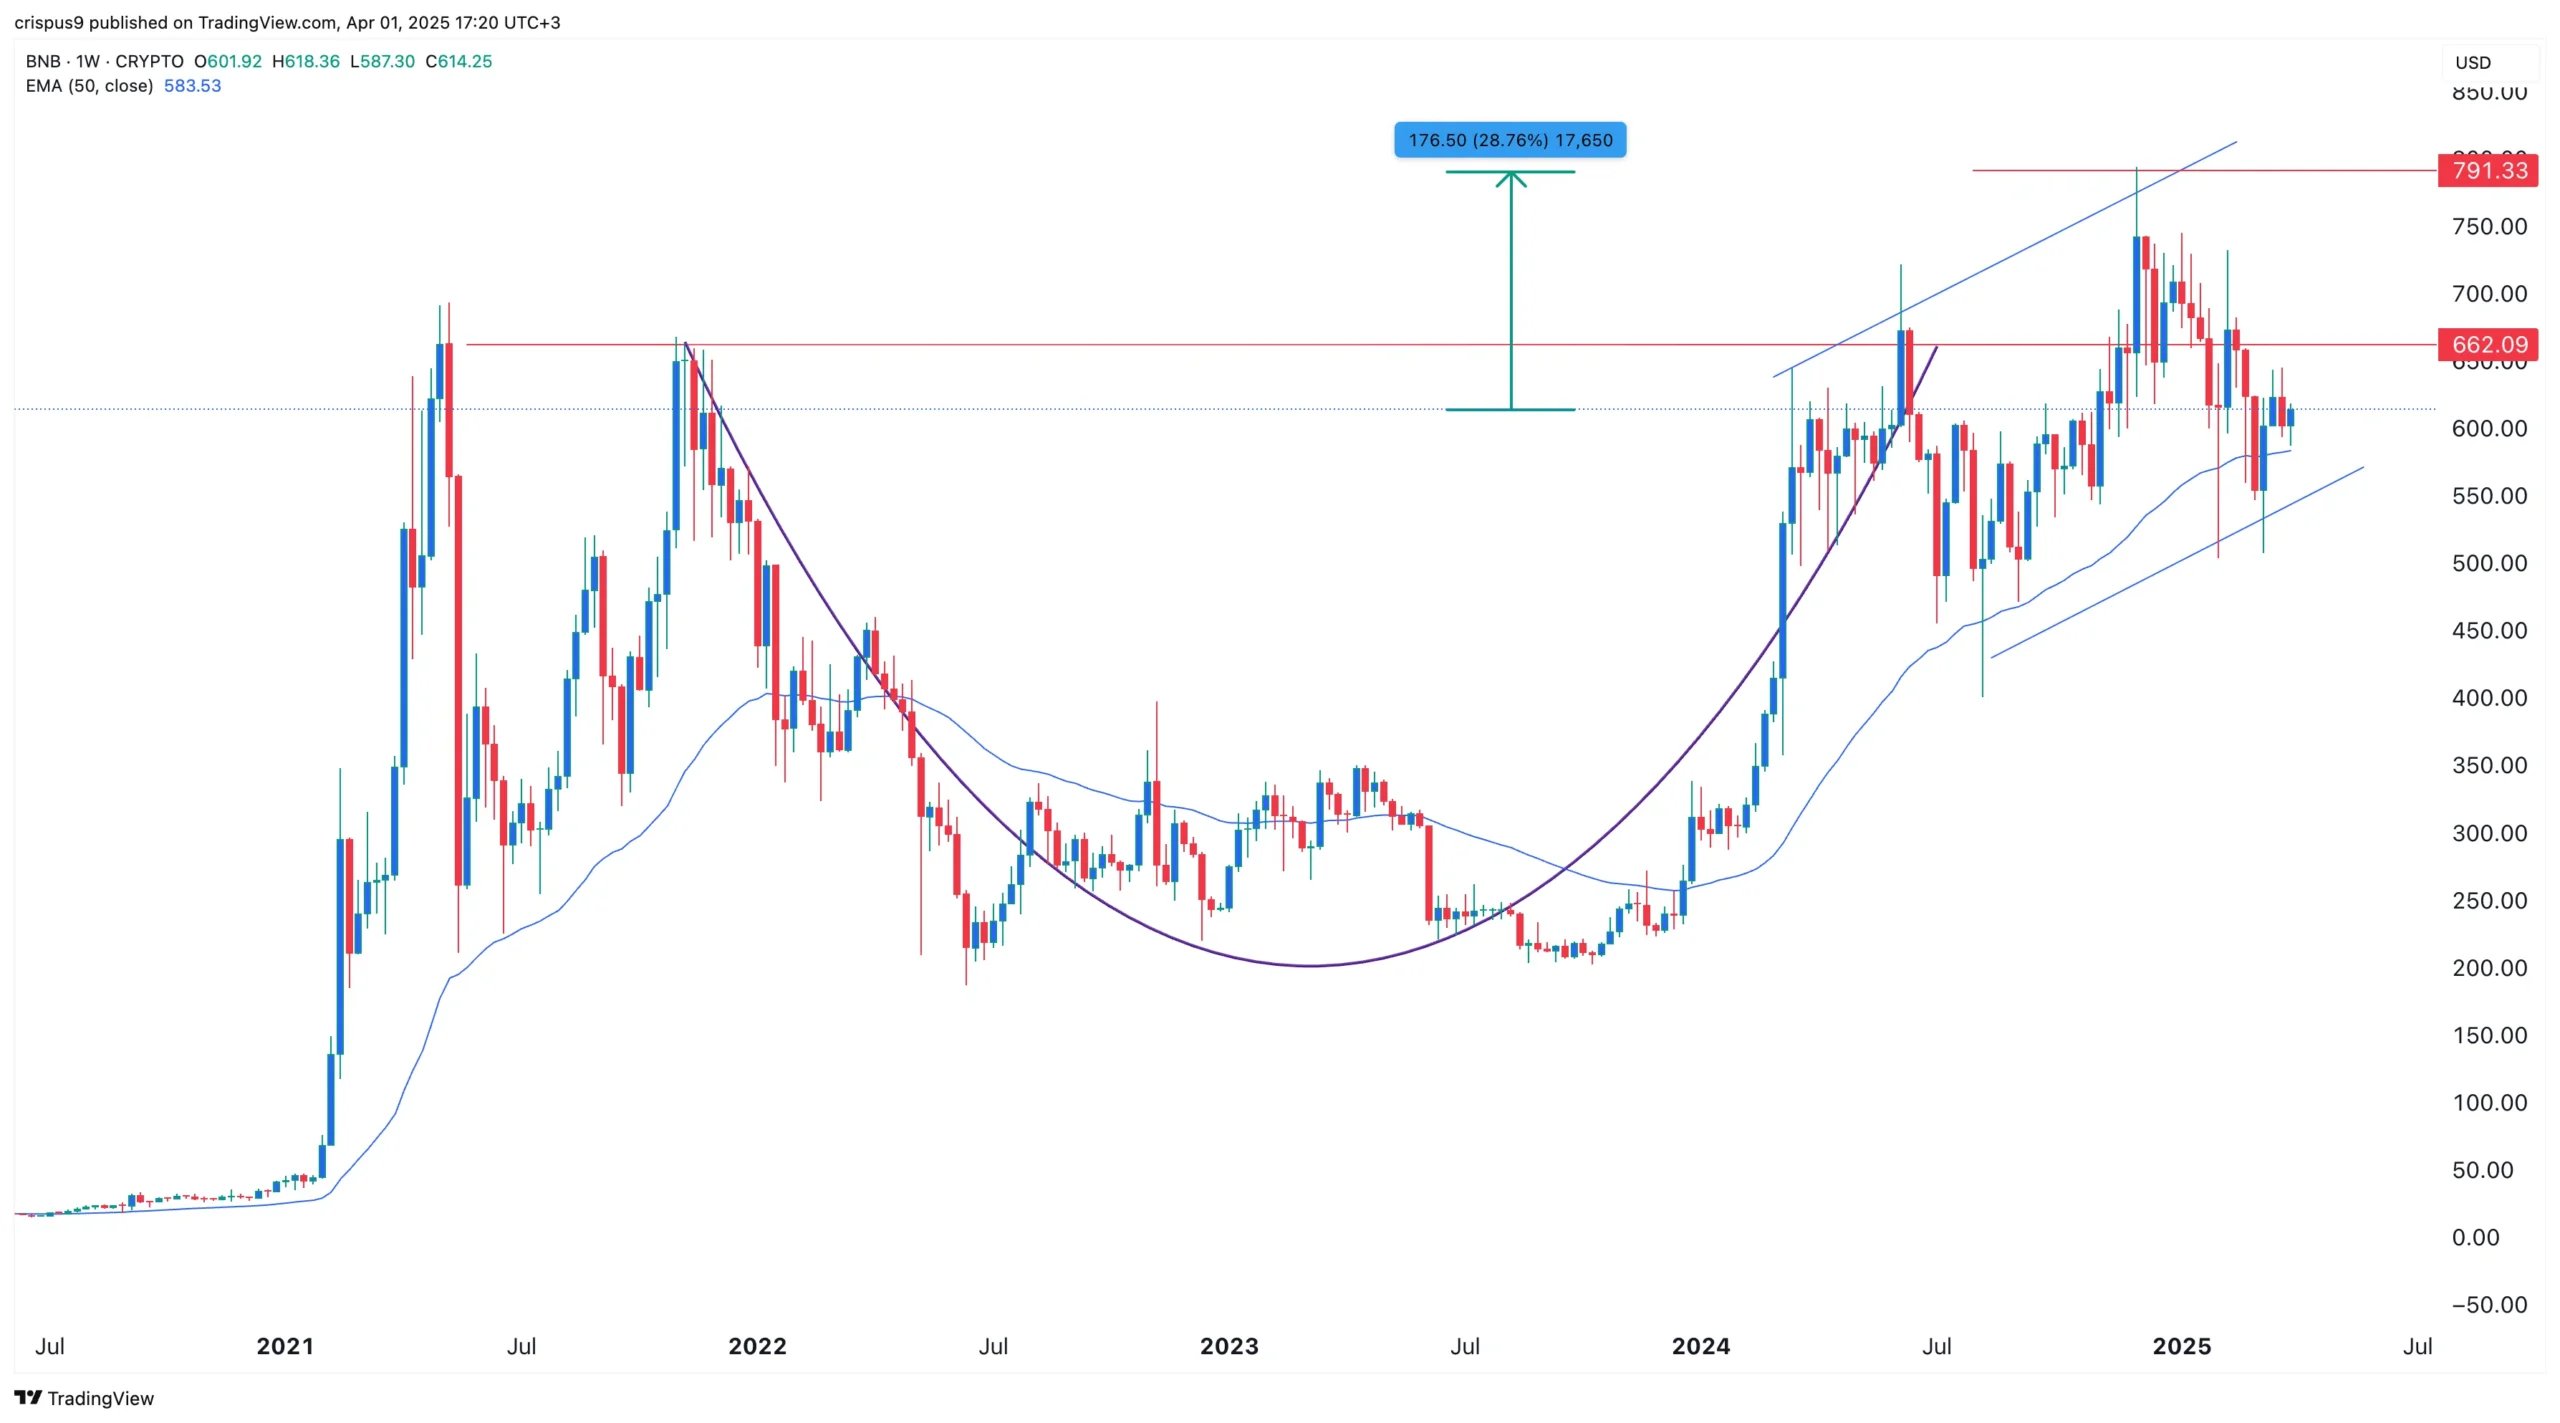
As per the latest data, BNB ranks as the fifth-largest cryptocurrency by market capitalization at $87.1 billion. Despite its significant market position, both BNB’s price and the broader cryptocurrency market have faced some challenges recently.
Over the past month, the altcoin’s value has declined 2.2%. At the time of writing, BNB was trading at $598. This represented a 1.7% dip in the last 24 hours, according to data from BeInCrypto.

While the trust filing hasn’t yet led to a price uptick, the community remains optimistic about the prospects of BNB, especially with this new development.
“Send BNB to the moon now,” an analyst posted on X (formerly Twitter).
The filing comes just weeks after VanEck made a similar move for Avalanche (AVAX). On March 10, VanEck registered a trust for an AVAX-focused ETF.
This was quickly followed by the filing of an S-1 registration statement with the US Securities and Exchange Commission (SEC). Given this precedent, a similar S-1 filing for a BNB ETF could follow soon.
“A big step toward bringing BNB to US institutional investors!” another analyst wrote.
Meanwhile, the industry has seen an influx of crypto fund applications at the SEC following the election of a pro-crypto administration. In fact, a recent survey revealed that 71% of ETF investors are bullish on crypto and plan to increase their allocations to cryptocurrency ETFs in the next 12 months.
“Three-quarters of allocators expect to increase their investment in cryptocurrency-focused ETFs over the next 12 months, with demand highest in Asia (80%), and the US (76%), in contrast to Europe (59%),” the survey revealed.
This growing interest in crypto ETFs could drive further demand for assets like BNB, making the VanEck BNB ETF a potentially significant product in the market.
Disclaimer
In adherence to the Trust Project guidelines, BeInCrypto is committed to unbiased, transparent reporting. This news article aims to provide accurate, timely information. However, readers are advised to verify facts independently and consult with a professional before making any decisions based on this content. Please note that our Terms and Conditions, Privacy Policy, and Disclaimers have been updated.

Binance Sidelines Pi Network Again In Vote To List Initiative, Here’s All

XRP Price Reversal Toward $3.5 In The Works With Short And Long-Term Targets Revealed

First Digital Trust Denies Justin Sun’s Allegations, Claims Full Solvency
Will Cardano Price Bounce Back to $0.70 or Crash to $0.60?

Why A Massive Drop To $1,400 Could Rock The Underperformer

How Will Elon Musk Leaving DOGE Impact Dogecoin Price?

2.52 Million Altcoins Are Ruining Crypto’s Future

Animoca Brands Valuation Tanks 75% In Two Years, Here’s Why

Crypto exchange BingX hacked for $43 million

Are The Big Players Losing Interest?

Hong Kong’s Securities Association Tips Authorities On Crypto Self-Regulation

Coinbase cbBTC Set to go Live on Solana
2.52 Million Altcoins Are Ruining Crypto’s Future
Animoca Brands Valuation Tanks 75% In Two Years, Here’s Why
Crypto exchange BingX hacked for $43 million
Are The Big Players Losing Interest?
Hong Kong’s Securities Association Tips Authorities On Crypto Self-Regulation
Coinbase cbBTC Set to go Live on Solana
-

 Market24 hours ago
Bitcoin Price Bounces Back—Can It Finally Break Resistance?
-

 Market19 hours ago
BNB Price Faces More Downside—Can Bulls Step In?
-

 Altcoin24 hours ago
Tether Expands Bitcoin Reserves with 8,888 BTC Buy—What’s the Plan?
-
 Altcoin21 hours ago
Pi Network Faces Community Backlash, Is Pi Coin Price Heading to Zero?
-

 Market20 hours ago
VanEck Sets Stage for BNB ETF with Official Trust Filing
-

 Bitcoin19 hours ago
Tokenized Gold Market Cap Tops $1.2 Billion as Gold Prices Surge
-

 Market23 hours ago
Ethereum Price Approaches Resistance—Will It Smash Through?
-
 Altcoin23 hours ago
Will BNB Price Rally to ATH After VanEck BNB ETF Filing?