
Market
FTX’s $500 Million Investment in Anthropic Yields $1.3 Billion

Bankrupt crypto exchange FTX has agreed to sell its remaining stake in AI startup Anthropic for $452.2 million, according to a court filing on May 31.
FTX disclosed that G Squared, a global venture capital fund, bought about one-third of the 4.5 million shares for $135 million. Over 20 other venture capital funds, including Gemini Ventures, Fund FG-BLU, and Fund SCVC-PV-LXVI, also participated in the purchase.
FTX to Net $800 Million From Anthropic Share Sales
FTX’s Anthropic shares sales, still pending Judge John Dorsey’s approval, could total about $1.3 billion, netting the company around $800 million. Initially, FTX invested $500 million in Anthropic in 2021, holding a 7.8% stake.
Anthropic, an AI company known for its chatbot Claude, aims to release AI models with stricter guardrails than ChatGPT and other rivals. Founded by former OpenAI employees, Anthropic has attracted significant investments from tech giants like Google.
The sale could be the most profitable for FTX as it seeks to repay creditors following its November 2022 bankruptcy. However, some creditors argue that the shares should have been allocated to FTX customers, whose deposits funded the purchase.
Read more: FTX Collapse Explained: How Sam Bankman-Fried’s Empire Fell
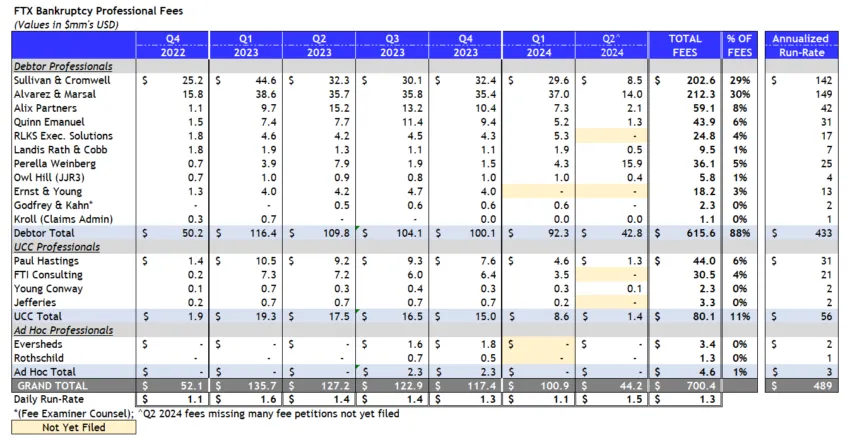
Moreover, the rising costs of FTX legal fees have drawn sharp criticism from FTX creditors, who accuse the advisors of destroying over $10 billion of creditor value. Recent bankruptcy filings reveal that FTX has incurred $700 million in legal and administrative fees, as tracked by X user Mr. Purple. Consulting firm Alvarez & Marsal billed $212 million, while legal counsel Sullivan & Cromwell invoiced $202 million. Additionally, FTX CEO John Ray III billed $5.6 million at an hourly rate of $1,300.
“FTX advisors billed $700 million while destroying over $10 billion of creditor value. John Ray charged $5.6 million for making all business decisions, such as not restarting FTX despite multiple bids and selling assets at a 90% discount. Plan administrators need to change,” wrote FTX creditor Sunil Kavuri.
FTX’s efforts to sell Anthropic stake and manage rising legal costs remain under scrutiny as it navigates its complex bankruptcy proceedings. The results of these sales and Judge John Dorsey’s decisions will be crucial in shaping FTX’s future and its creditors’ recovery prospects.
Disclaimer
In adherence to the Trust Project guidelines, BeInCrypto is committed to unbiased, transparent reporting. This news article aims to provide accurate, timely information. However, readers are advised to verify facts independently and consult with a professional before making any decisions based on this content. Please note that our Terms and Conditions, Privacy Policy, and Disclaimers have been updated.


Token unlocks release tokens previously restricted under fundraising agreements. Projects strategically schedule these releases to minimize market pressure and prevent token price declines.
Here are three major token unlocks to keep an eye on next week.
Immutable (IMX)
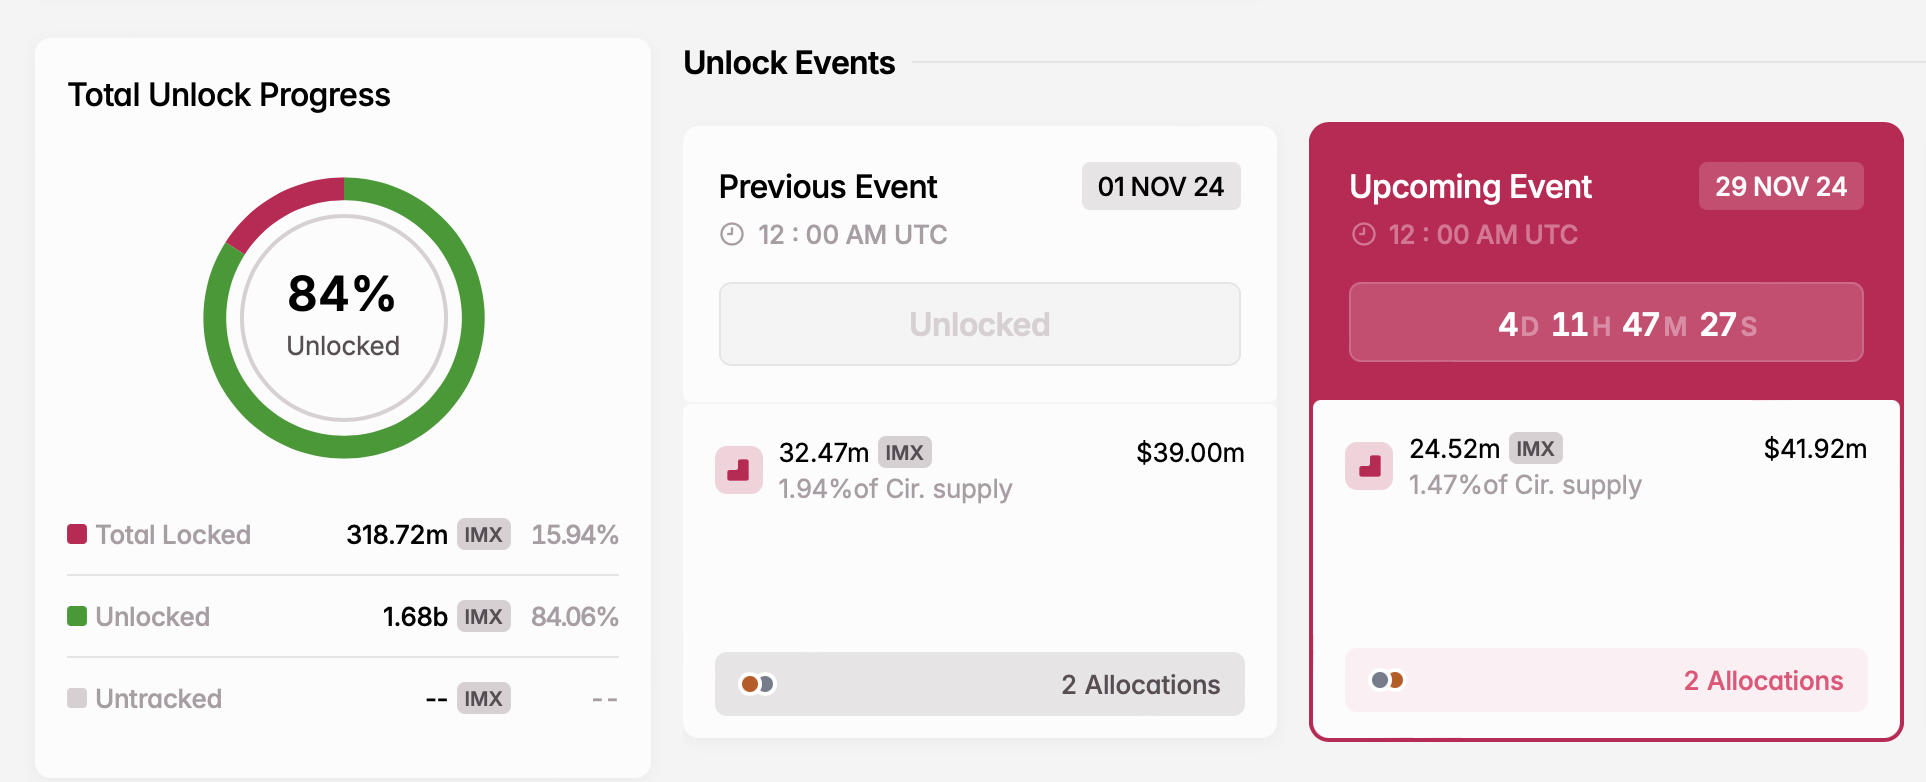
- Unlock date: November 29
- Number of tokens unlocked: 24.52 million IMX
- Current circulating supply: 1.67 billion IMX
Immutable, a Layer-2 solution for scaling NFTs on Ethereum, raised $12.5 million in just one hour during its IMX token sale on CoinList in September 2021. By March 2022, the project secured $60 million in an investment round, followed by an additional $200 million from investors such as ParaFi Capital, Declaration Partners, and Tencent Holdings.
On November 29, Immutable will release 24.52 million new IMX tokens into circulation. These tokens will support project development and growth within the broader Immutable ecosystem.
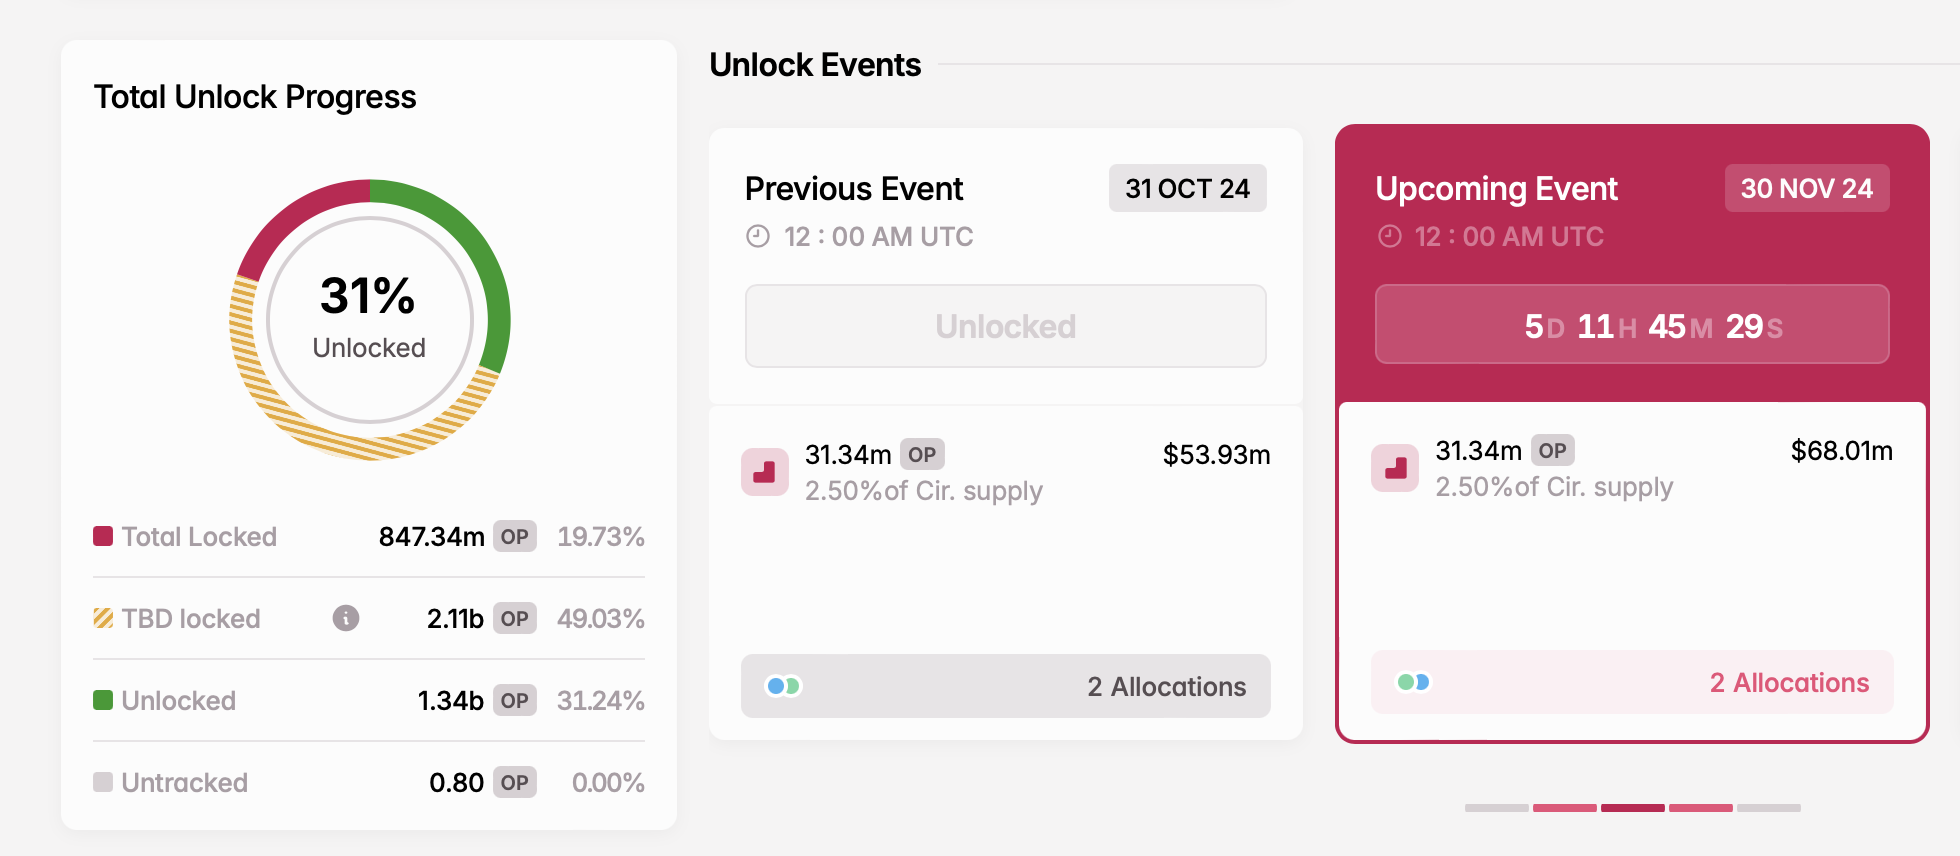
Optimism (OP)
- Unlock date: November 30
- Number of tokens unlocked: 31.34 million OP
- Current circulating supply: 1.25 billion OP
Optimism, a Layer-2 scaling solution, enhances transaction speed and reduces costs on the Ethereum mainnet. Its OP token is vital for governance, enabling holders to vote on proposals and influence the network’s development and management.
On November 30, Optimism will release 31.34 million OP tokens into circulation. Tokenomist (formerly TokenUnlocks) reports that core contributors and investors will receive these tokens.
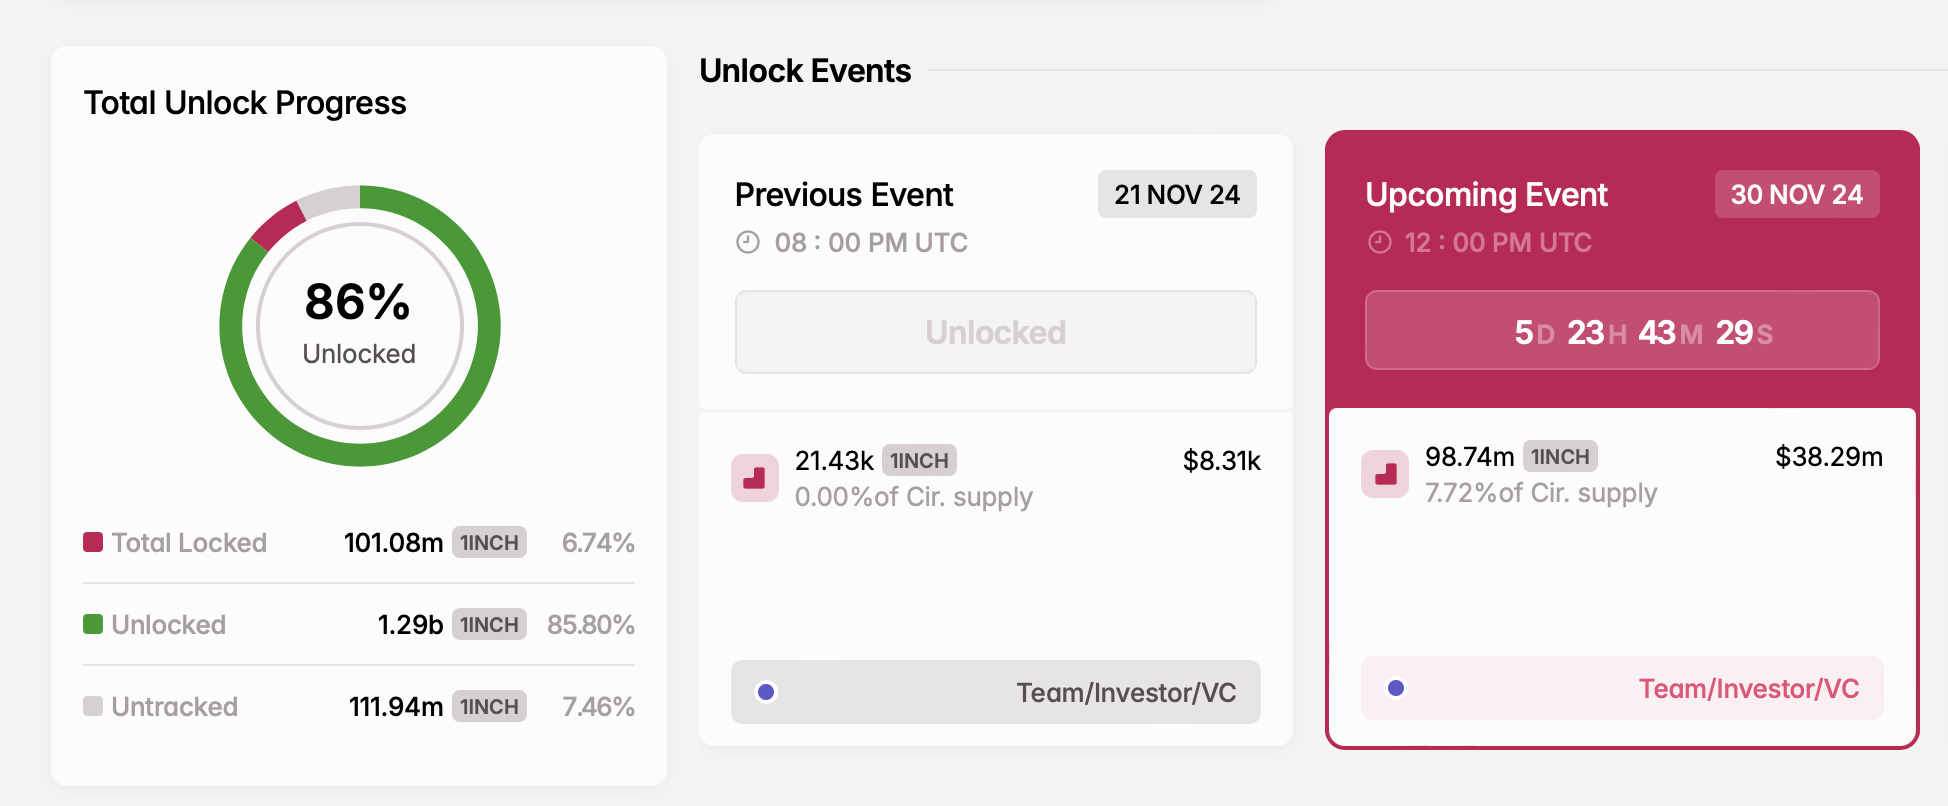
1Inch (1INCH)
- Unlock date: November 30
- Number of tokens unlocked: 98.74 million 1INCH
- Current circulating supply: 1.27 billion 1INCH
1inch is a decentralized exchange aggregator that pools liquidity from multiple DEXs to offer users the best trading rates. It streamlines trading by identifying the most efficient transaction routes, minimizing slippage, and lowering fees.
On November 30, 1inch will unlock nearly 100 million 1INCH tokens. These tokens are allocated for developers, early investors, and venture capital funds.
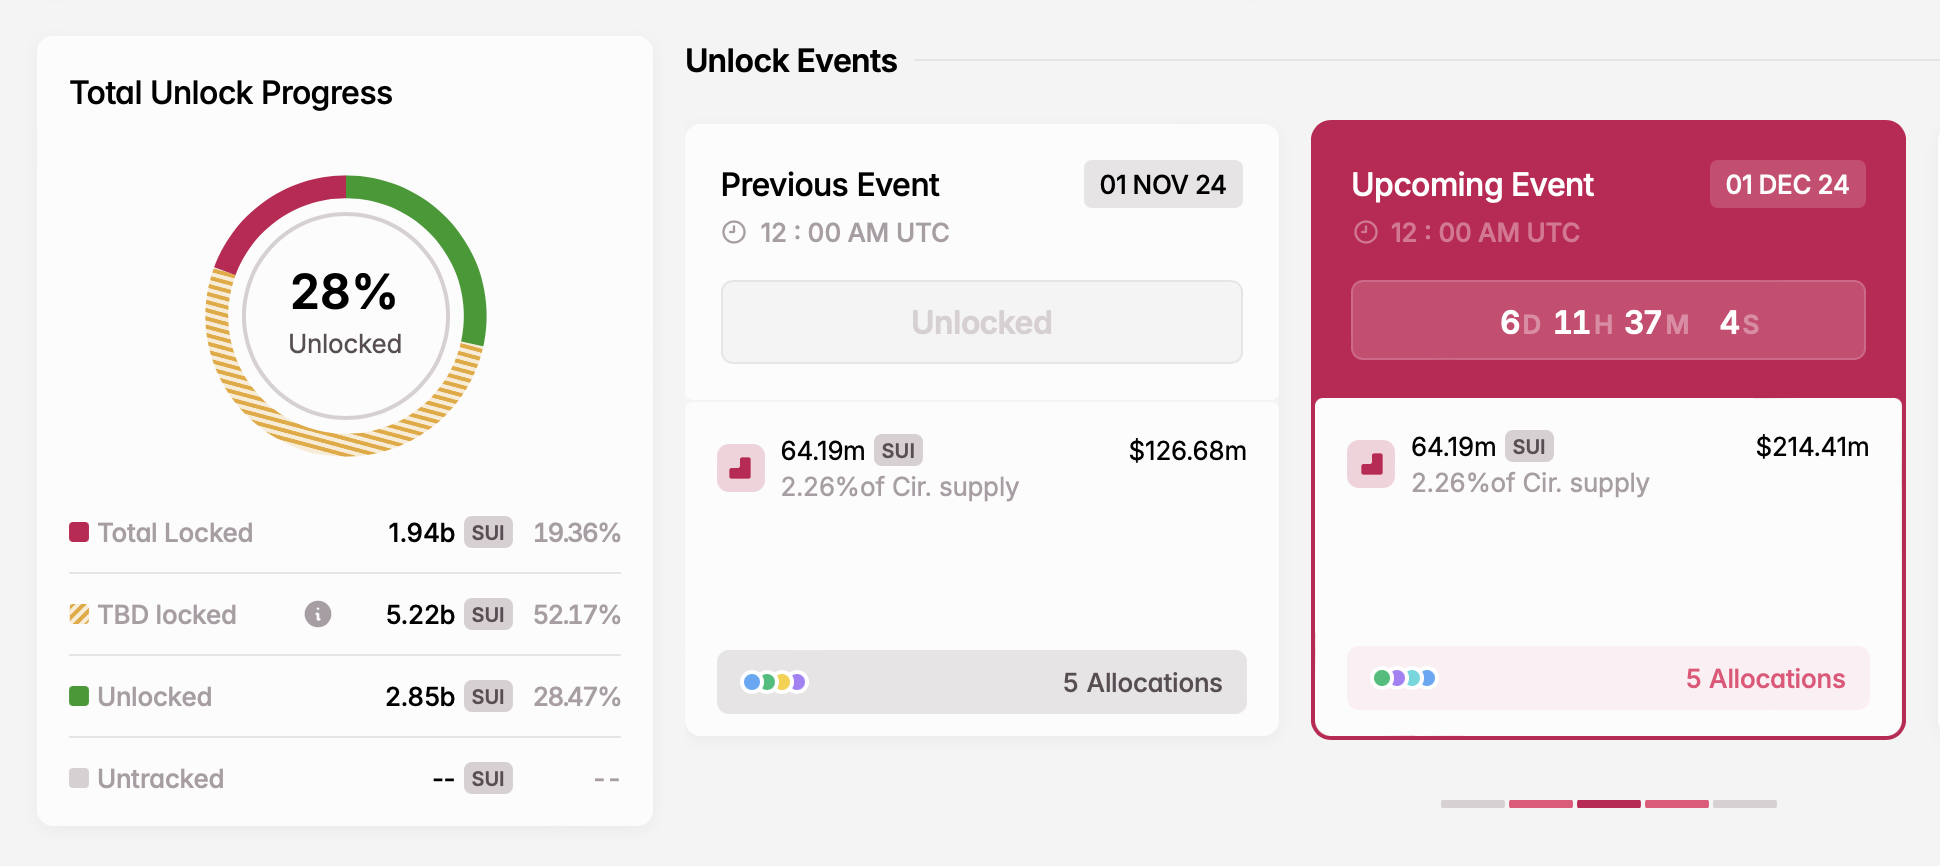
Sui (SUI)
- Unlock date: December 1
- Number of tokens unlocked: 64.19 million SUI
- Current circulating supply: 2.84 billion SUI
Sui is a high-performance Layer-1 blockchain designed to enhance network operations and security using a Proof-of-Stake consensus mechanism. Developed by Mysten Labs, the project was founded in 2021 by former Novi Research employees who were instrumental in creating the Diem blockchain and the Move programming language.
The SUI token supports governance, allowing holders to vote on key proposals and influence the platform’s direction. On December 1, the next token unlock will release a significant portion of tokens allocated to Series A and B participants, the community reserve, and the Mysten Labs treasury.
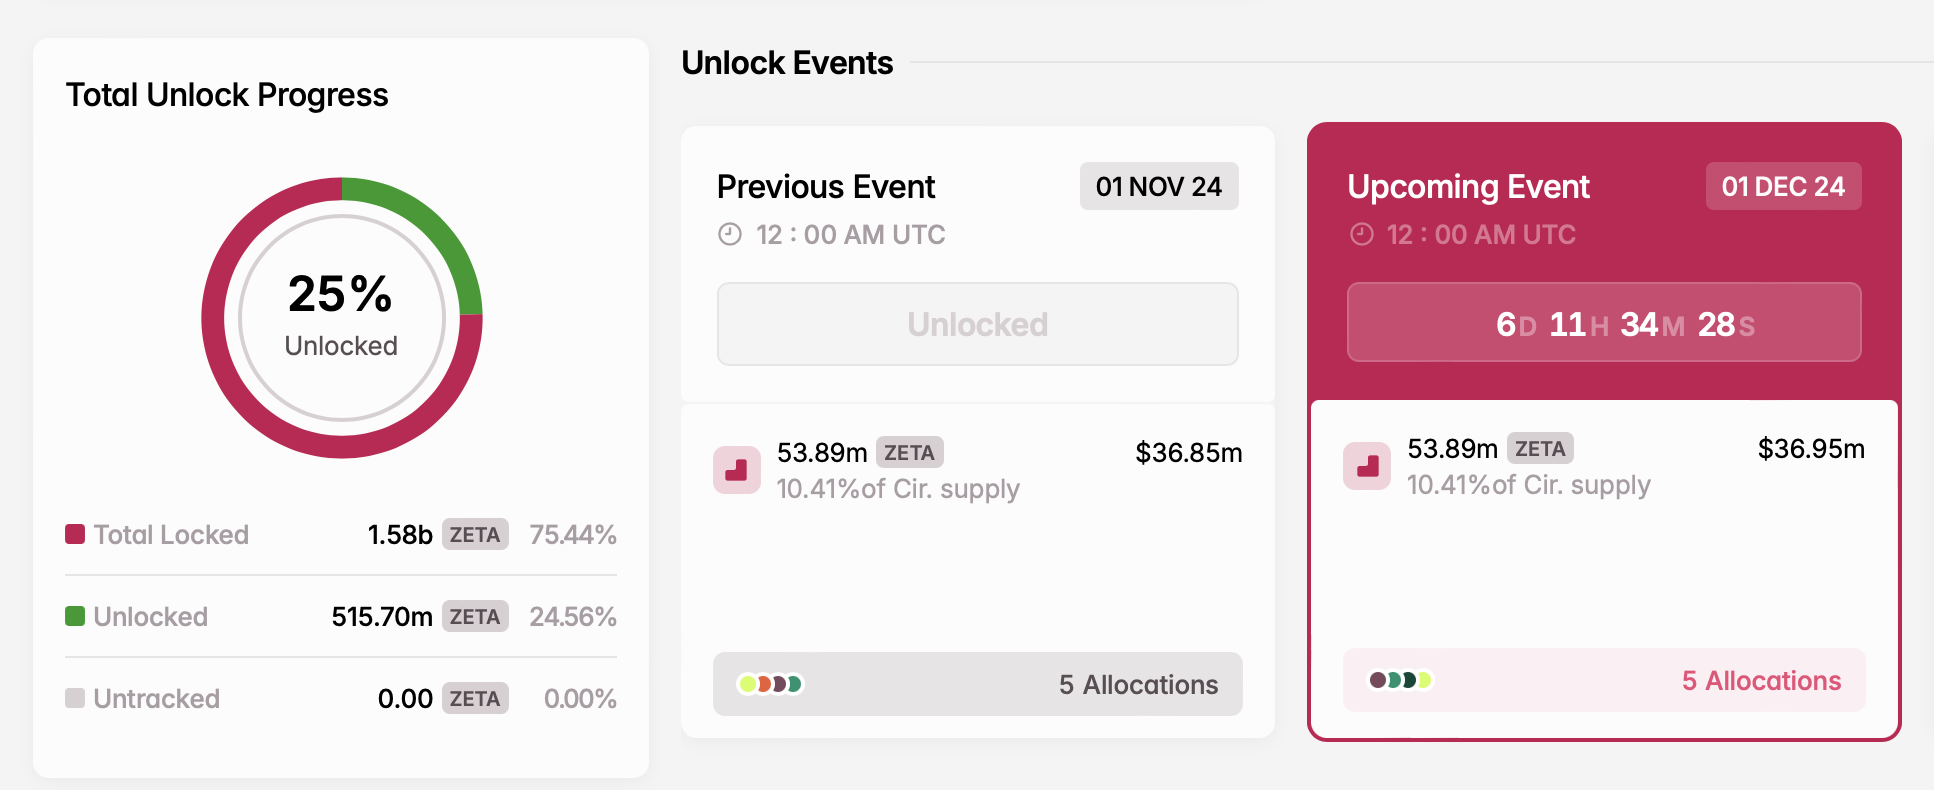
ZetaChain (ZETA)
- Unlock date: December 1
- Number of tokens unlocked: 53.89 million ZETA
- Current circulating supply: 517.85 million ZETA
ZetaChain is a decentralized blockchain platform designed to enable seamless interoperability between different blockchain networks. The platform’s standout feature enables cross-chain communication, allowing the exchange of tokens and data across blockchains like Ethereum and Binance Smart Chain.
On December 1, ZetaChain will release nearly 54 million ZETA tokens. These tokens will support various initiatives, including a user growth pool, an ecosystem growth fund, rewards for core contributors, advisory roles, and liquidity incentives.
Next week’s cliff token unlocks will also include Cardano (ADA), Ethena (ENA), and dYdX (DYDX), among others, with a total combined value exceeding $540 million.
Disclaimer
In adherence to the Trust Project guidelines, BeInCrypto is committed to unbiased, transparent reporting. This news article aims to provide accurate, timely information. However, readers are advised to verify facts independently and consult with a professional before making any decisions based on this content. Please note that our Terms and Conditions, Privacy Policy, and Disclaimers have been updated.

Ripple’s XRP hit a year-to-date high of $1.63 on November 23. However, fading bullish momentum has made future traders doubtful about the rally’s sustainability. An increasing number are opening short positions, expecting a near-term price correction.
Currently trading at $1.44, XRP has declined by 6% in the past 24 hours. This analysis explores the recent activity in the token’s futures market and assesses the likelihood of a continued XRP price decline.
Ripple Traders Bet on a Price Drop
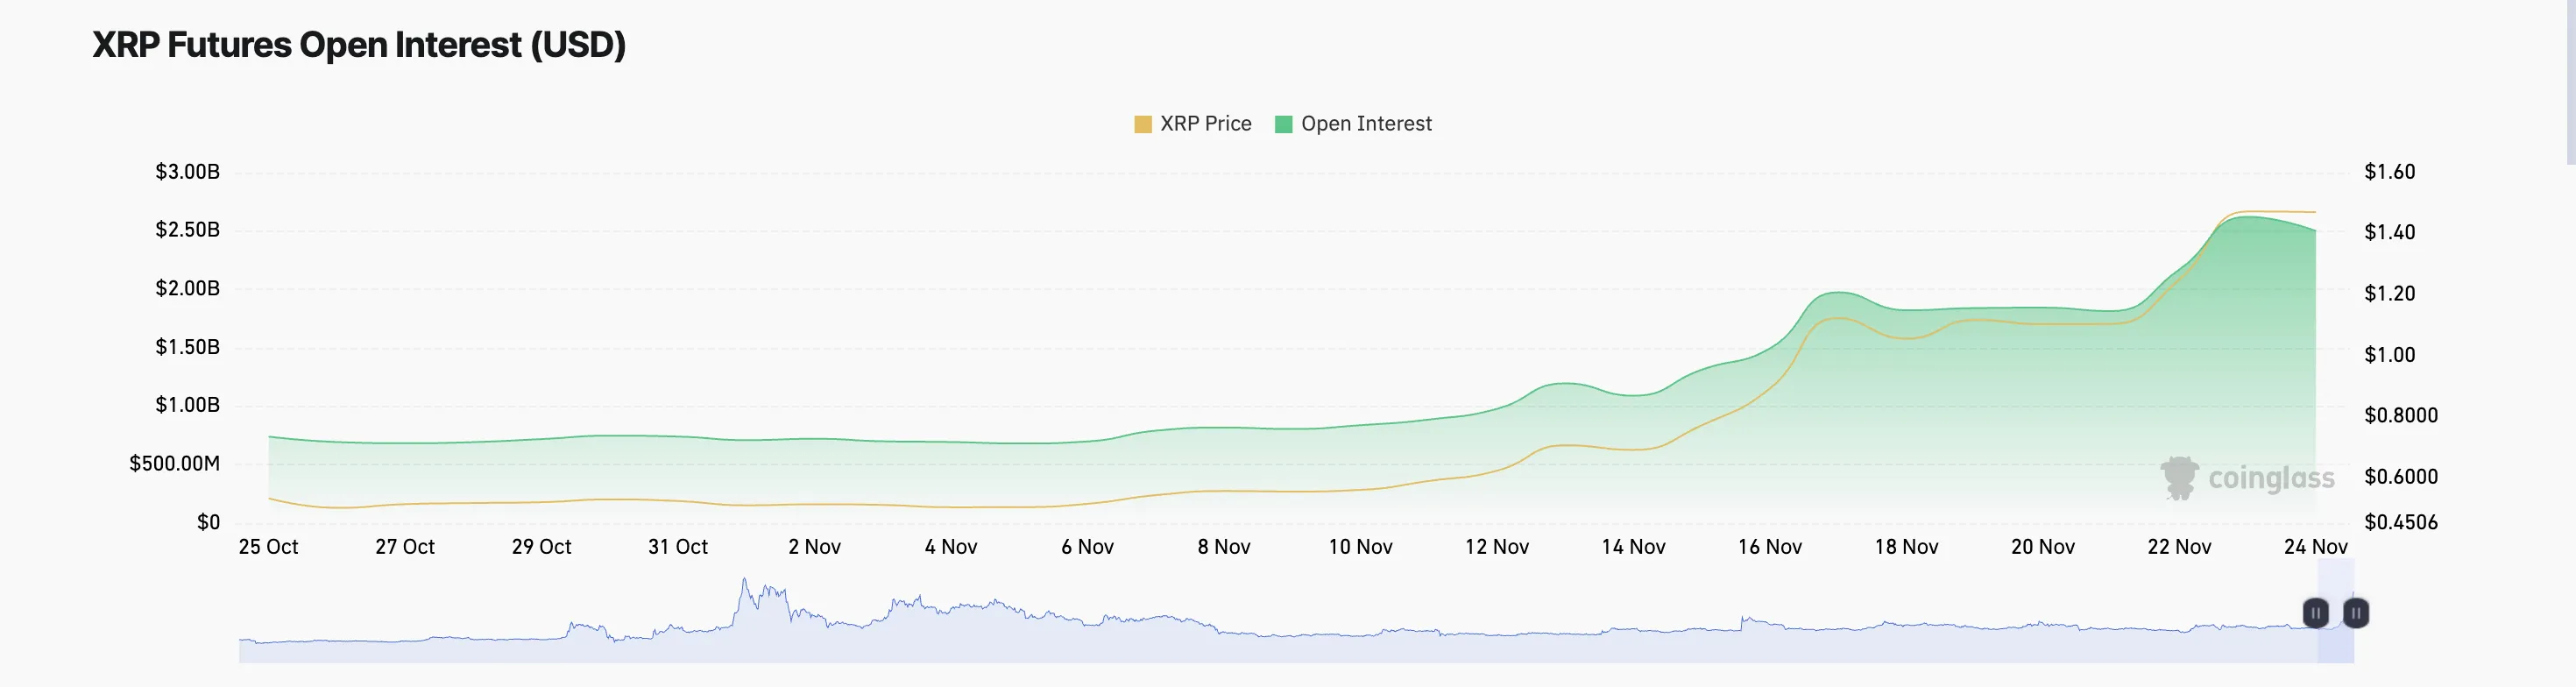
A drop in its open interest has accompanied XRP’s price decline over the past 24 hours. Per Coinglass data, this sits at $2.52 billion, falling by 9% during that period.
Open interest refers to the total number of active contracts in a derivatives market, such as futures or options, that have not been settled. When open interest drops as an asset’s price falls, traders are closing their positions to lock in profits or minimize losses, indicating reduced market participation.
In XRP’s case, this suggests waning confidence in the continuation of the uptrend and hints at a sustained reversal in the asset’s price movement.
Moreover, XRP’s Long/Short ratio confirms this bearish outlook. As of this writing, this sits at 0.96%, with 51% of all positions opened shorting the altcoin.
The Long/Short ratio measures the proportion of long positions (bets on price increases) to short positions (bets on price decreases) in a market. When the ratio is below 1, it indicates that there are more short positions than long positions, suggesting a bearish sentiment among traders.
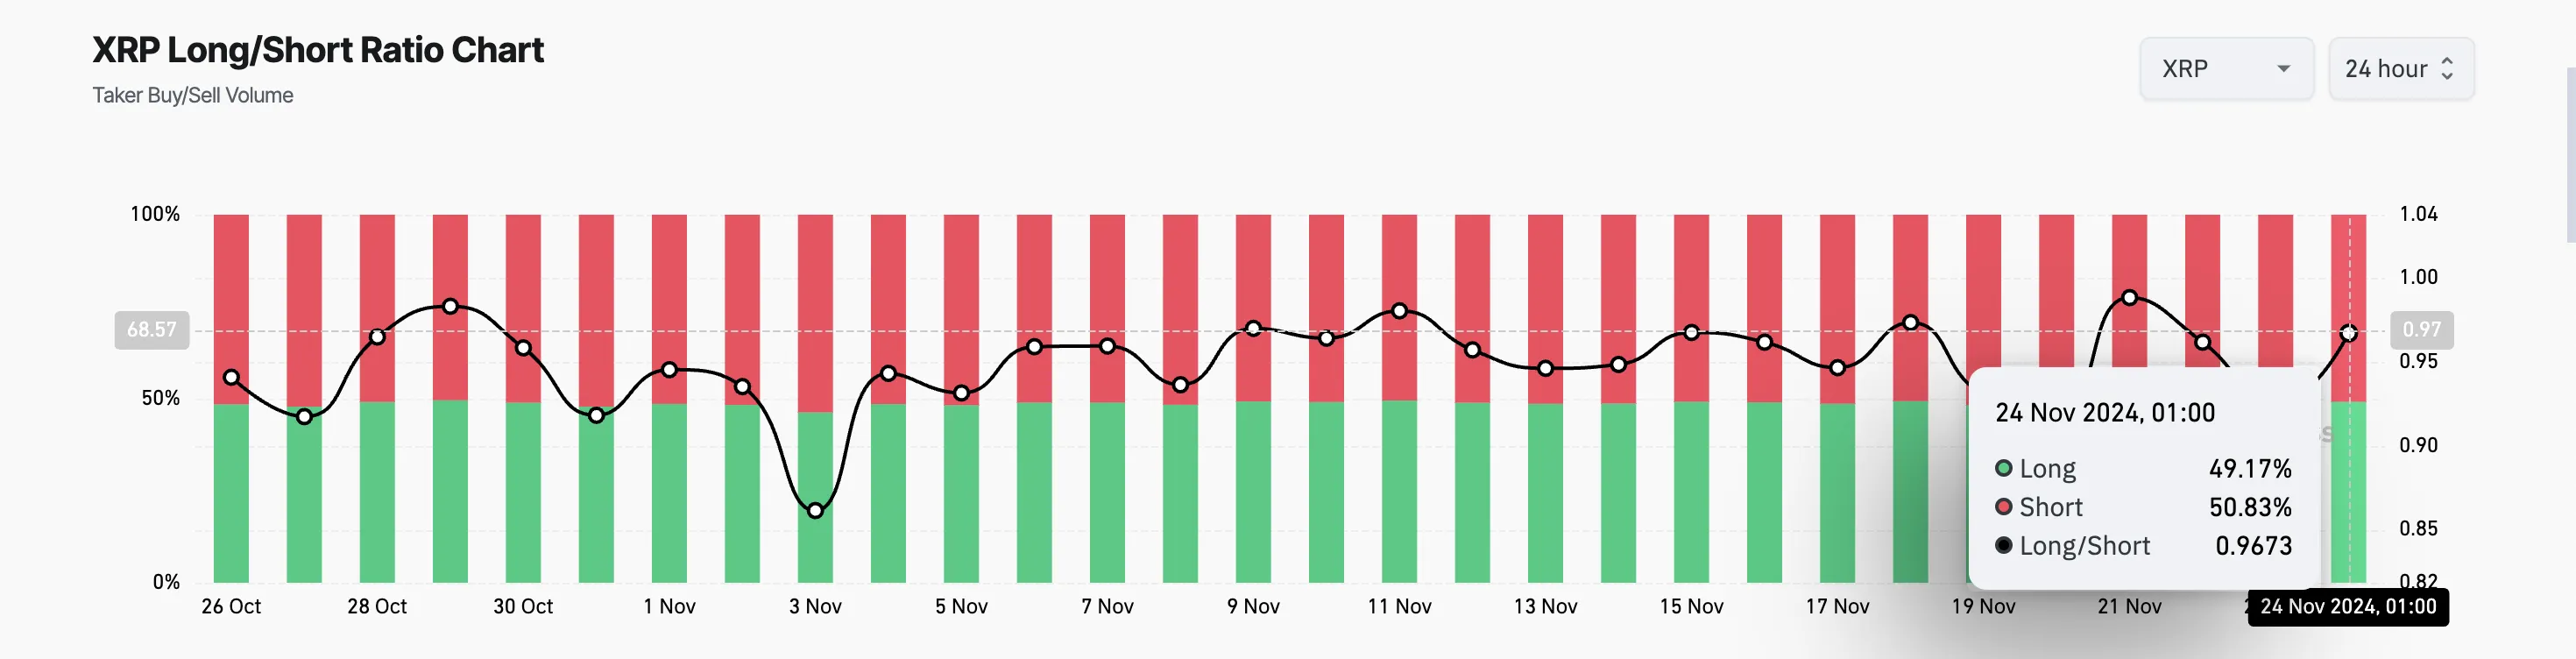
This imbalance in the XRP market reflects growing pessimism about the asset’s near-term prospects and may contribute to continued downward pressure on its price.
XRP Price Prediction: More Declines Imminent
XRP is currently trading at $1.44, holding above the $1.33 support level. If bearish sentiment intensifies, the price could drop to this support. A further decrease in buying pressure at that level may push XRP down to $1.15.
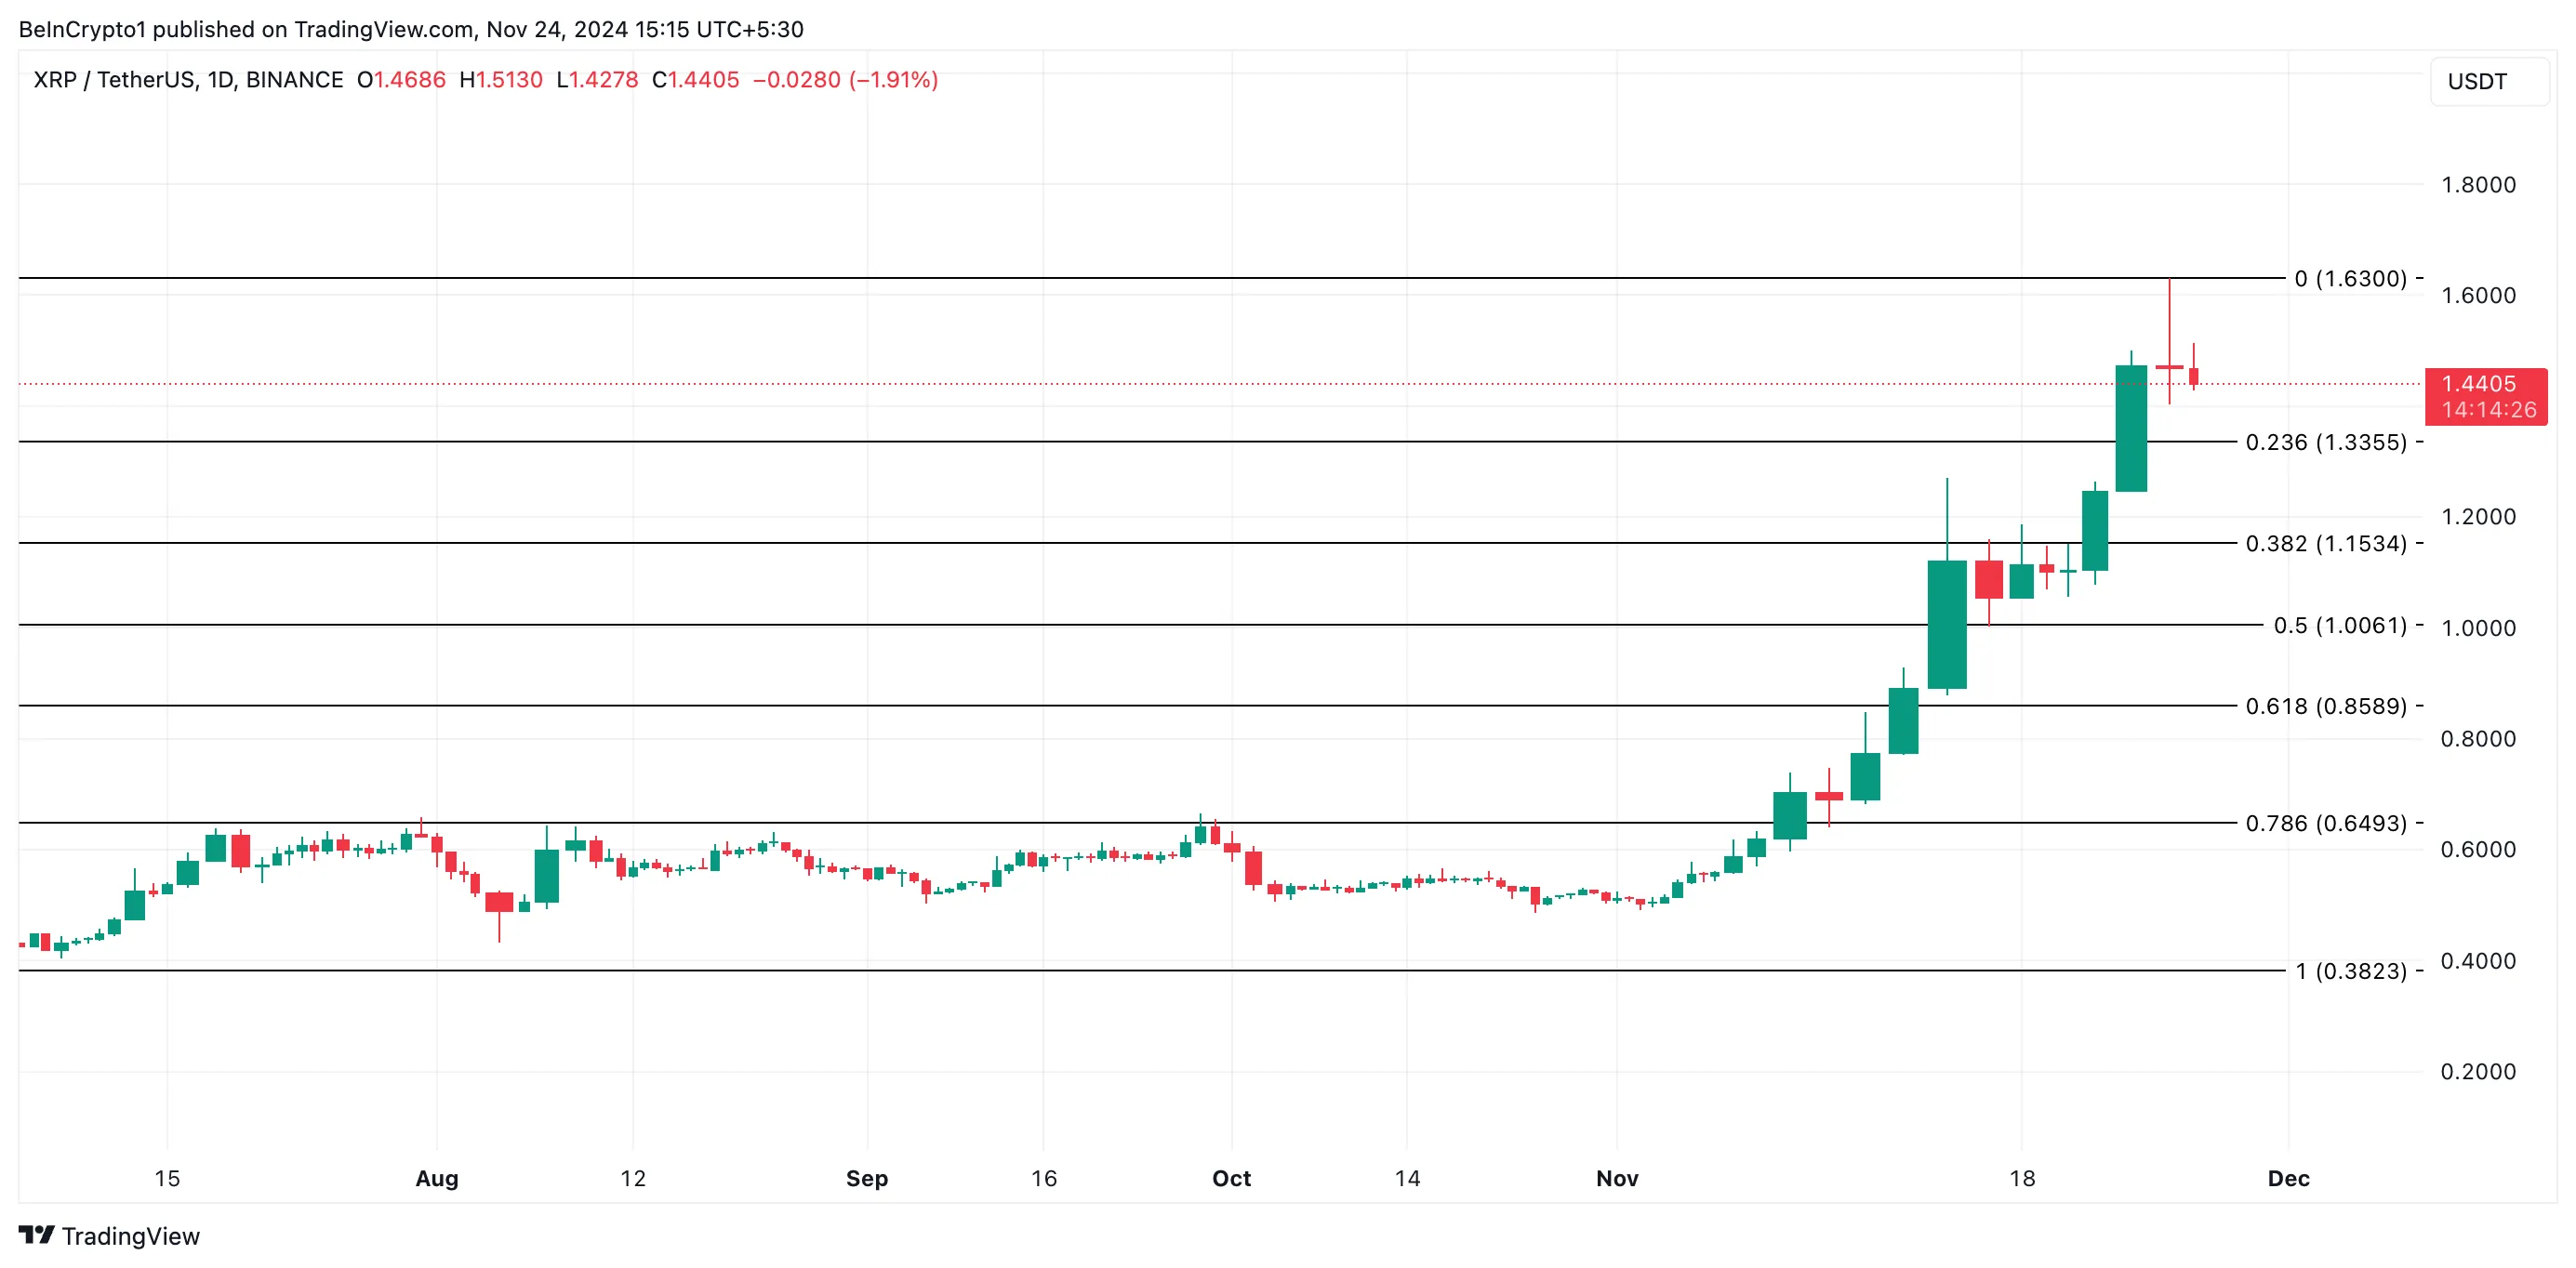
On the other hand, a shift in market sentiment from negative to positive will invalidate this bearish outlook. Should this happen, the altcoin will reclaim its year-to-date high of $1.63 and attempt to surpass it.
Disclaimer
In line with the Trust Project guidelines, this price analysis article is for informational purposes only and should not be considered financial or investment advice. BeInCrypto is committed to accurate, unbiased reporting, but market conditions are subject to change without notice. Always conduct your own research and consult with a professional before making any financial decisions. Please note that our Terms and Conditions, Privacy Policy, and Disclaimers have been updated.

Gemini co-founder Cameron Winklevoss has called for a renewed investigation into the dropped campaign finance charges against Sam Bankman-Fried, the convicted founder of the now-defunct FTX exchange.
Winklevoss emphasized the need for the incoming US Attorney General to address unresolved concerns about how these charges, tied to election interference involving stolen customer funds, were handled.
Winklevoss Demands Probe Into FTX-Linked Election Interference Accusations
In a November 23 post on X, Winklevoss expressed the belief that the campaign finance allegations remain a critical issue. He pointed to the Department of Justice under Merrick Garland, which declined to pursue these charges due to extradition technicalities with the Bahamian government.
According to Winklevoss, the DOJ chose not to work through the required legal processes to include the campaign finance violations in the indictment, leaving the matter unaddressed.
“Merrick Garland’s DOJ refused to pursue campaign finance charges against SBF because they were not included in his extradition…Since when has paperwork stood in between a prosecutor and adding more charges? Especially when it involves election interference with $100m of stolen customer funds,” Winklevoss stated.
Federal prosecutors initially dropped the campaign finance charge last year, attributing their decision to objections from Bahamian authorities. This charge involved over $100 million allegedly funneled from Alameda Research to fund more than 300 political contributions.
According to the indictment, these contributions, often made through straw donors or corporate funds, aimed to enhance Bankman-Fried’s influence in Washington, D.C.
The indictment also noted that Bankman-Fried became a top political donor in the 2022 midterm elections. He allegedly used the funds to gain favor with candidates across party lines, potentially shaping legislation favorable to FTX and the broader crypto industry.
Winklevoss’ remarks come as other key figures in the FTX collapse face their consequences. While Caroline Ellison and Ryan Salame received sentences of two years and 7.5 years, respectively, Gary Wang and Nishad Singh avoided prison by cooperating with prosecutors. Bankman-Fried is currently serving a 25-year prison sentence for fraud and other crimes.
Meanwhile, FTX has announced plans to implement its approved reorganization strategy starting in January. The exchange’s bankruptcy managers have recovered billions of dollars for creditors and are intensifying efforts to reclaim assets held by other entities.
Disclaimer
In adherence to the Trust Project guidelines, BeInCrypto is committed to unbiased, transparent reporting. This news article aims to provide accurate, timely information. However, readers are advised to verify facts independently and consult with a professional before making any decisions based on this content. Please note that our Terms and Conditions, Privacy Policy, and Disclaimers have been updated.

Senator’s Bold Proposal To Replenish US Reserves

Token Unlocks to Watch Next Week: AVAX, ADA and More
Is the XRP Price Decline Going To Continue?

AI Company Invests $10 Million In BTC Treasury

Bitcoin Correction Looms As Analyst Predicts Fall To $85,600
Winklevoss Urges Scrutiny of FTX and SBF Political Donations

2.52 Million Altcoins Are Ruining Crypto’s Future

Animoca Brands Valuation Tanks 75% In Two Years, Here’s Why

Crypto exchange BingX hacked for $43 million

Are The Big Players Losing Interest?

Hong Kong’s Securities Association Tips Authorities On Crypto Self-Regulation

Coinbase cbBTC Set to go Live on Solana
2.52 Million Altcoins Are Ruining Crypto’s Future
Animoca Brands Valuation Tanks 75% In Two Years, Here’s Why
Crypto exchange BingX hacked for $43 million
Are The Big Players Losing Interest?
Hong Kong’s Securities Association Tips Authorities On Crypto Self-Regulation
Coinbase cbBTC Set to go Live on Solana
-
 Altcoin10 hours ago
BTC Continues To Soar, Ripple’s XRP Bullish
-
 Market24 hours ago
Why the Altcoin Season May Be Underway
-
 Altcoin19 hours ago
XRP Price To $28: Wave Analysis Reveals When It Will Reach Double-Digits
-
 Market18 hours ago
XRP To Hit $40 In 3 Months But On This Condition – Analyst
-

 Ethereum23 hours ago
Deribit Moves $783M in Ethereum To Cold Storage: A Bullish Signal for ETH?
-
 Market23 hours ago
Solana Sees Surge in Meme Coin Activity and Rising Fees
-

 Market21 hours ago
Why BTC Miners Are Selling Their Coins
-

 Market19 hours ago
Kraken Eyes Token Expansion as Trump Promises Crypto Support