
Market
Dogecoin (DOGE) Mirrors Previous Cycles: Bull Market Imminent

Dogecoin (DOGE), a popular meme coin, has displayed recurring price patterns that often precede substantial bull runs.
Indeed, Dogecoin’s recent price correction suggests a potential for a bullish reversal, aligning with its historical trends.
Understanding Descending Triangles
A descending triangle is an important pattern in technical analysis, often signaling bullish reversals. It forms with a flat support level and a descending resistance line, indicating decreasing selling pressure and consistent buying interest.
- Flat Support Level: This horizontal line represents a strong support level where the price finds consistent buying interest.
- Descending Resistance Line: This downward-sloping trendline connects lower highs, showing decreasing selling pressure.
- Formation: Sellers gradually lose control as the price makes lower highs. The strong support indicates buyers are accumulating positions.
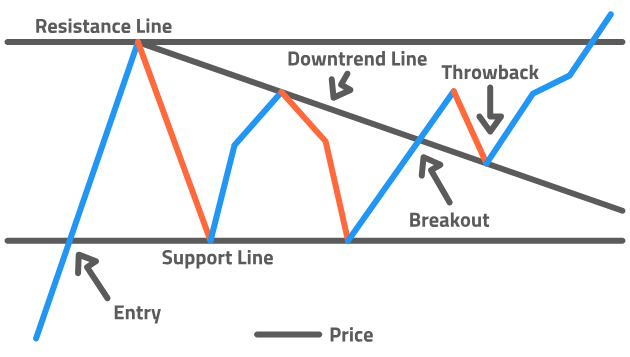
When the price breaks above the descending resistance line with significant volume, it signals a potential bullish reversal.
Dogecoin’s Historical Price Precedents
Interestingly, historical data supports the pattern’s effectiveness for Dogecoin. In previous cycles, after DOGE has reached a market top, it tends to consolidate in a descending triangle before a new bull market starts.
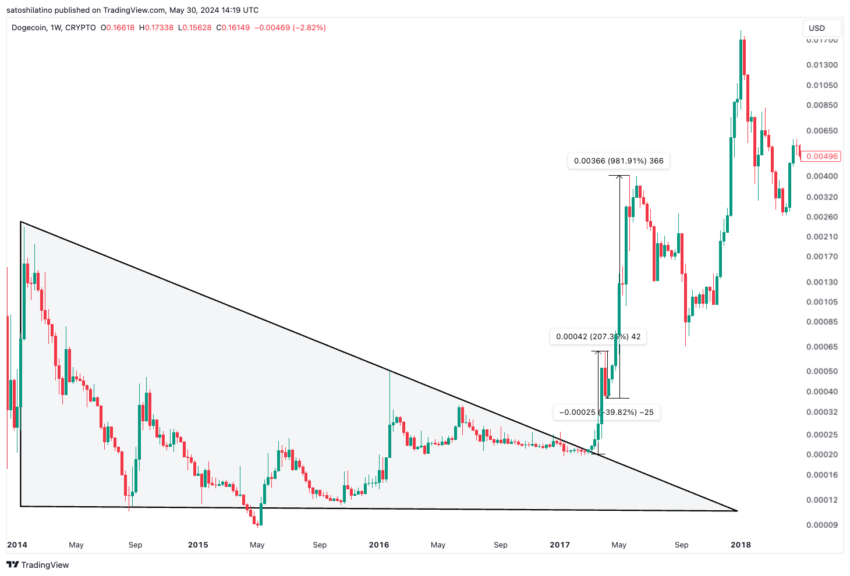
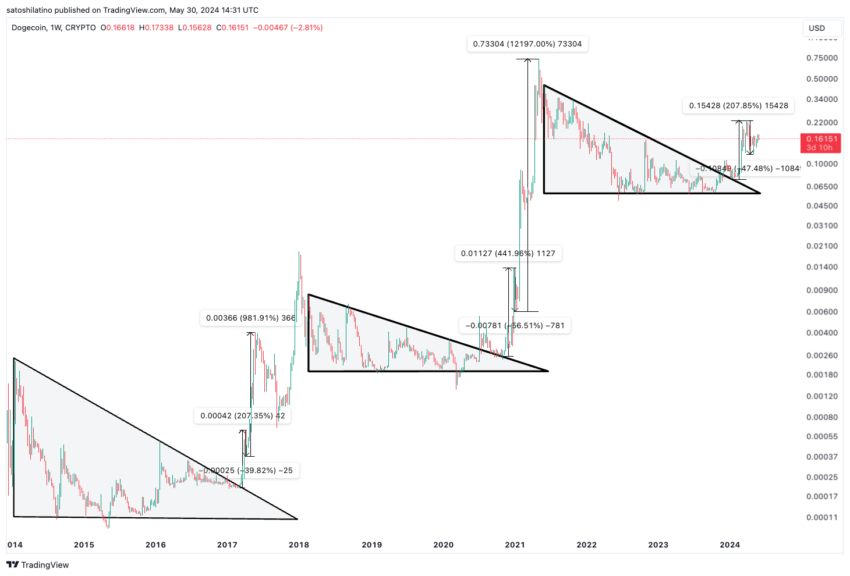
For instance, Dogecoin reached a market peak of $0.00232 in January 2014. After this high, DOGE’s price declined, forming a series of lower highs while maintaining a flat support level at $0.00010.
In March 2017, Dogecoin broke out of this descending triangle pattern, resulting in a 207.35% surge. Following this upswing, DOGE experienced a 39.82% retracement before skyrocketing by an impressive 981.91%.
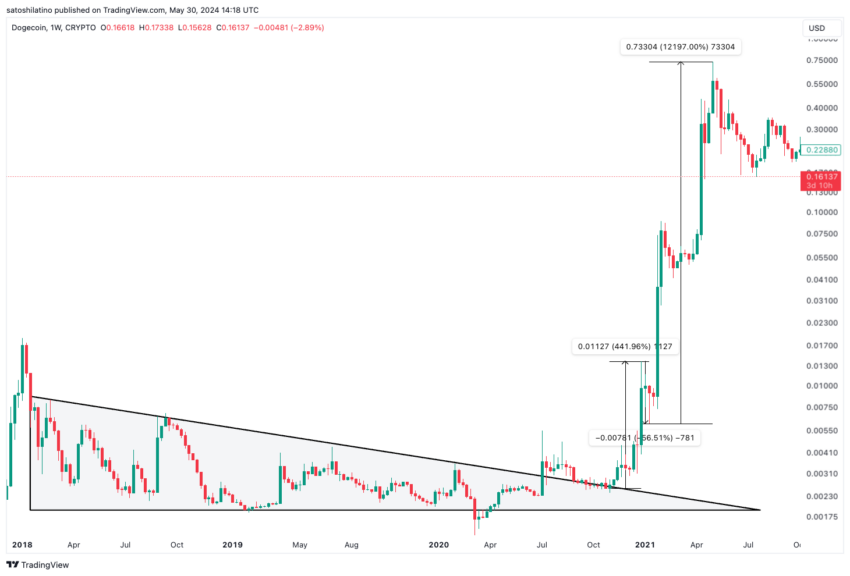
Similarly, in January 2018, Dogecoin reached an all-time high of $0.01877, marking the start of a downward trend. As DOGE’s price formed a series of lower highs, it developed a descending triangle pattern, with a strong support level at $0.00191.
In November 2020, Dogecoin broke through the triangle’s resistance line, triggering a 441.96% bull rally. This was followed by a 56.31% correction, after which DOGE’s price skyrocketed by an astounding 12,197%.
These patterns reflect Dogecoin’s potential for significant gains following a descending triangle breakout.
DOGE’s Current Governing Pattern
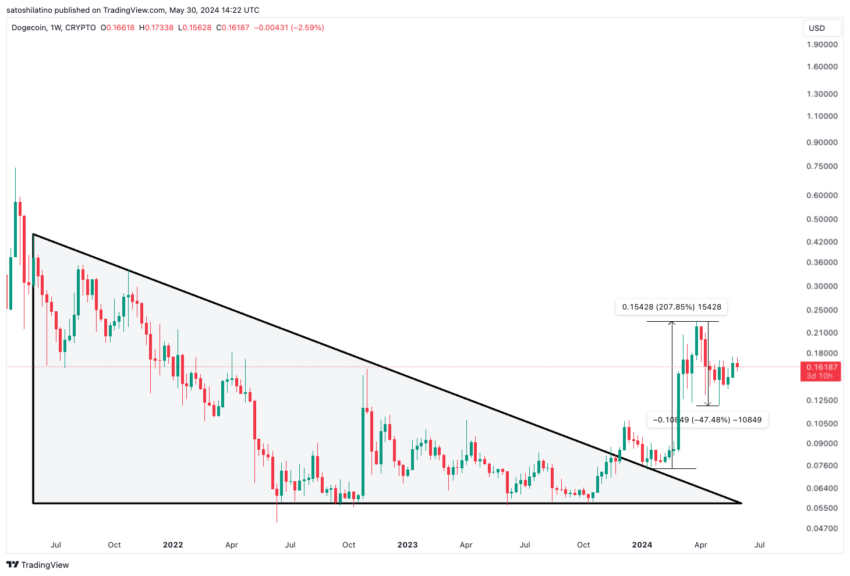
Following the all-time high of $0.73905 in May 2021, Dogecoin entered a bear market, forming a descending triangle pattern. In January 2024, Dogecoin broke out of this pattern, experiencing a 207.85% price increase. As seen in previous cycles, DOGE’s price retraced by 47.48%.
If history repeats itself, Dogecoin may be on the verge of entering a new bull market.
The descending triangle’s implications are profound. Initial selling pressure gives way to strong support, indicating buyer accumulation. A breakout above the descending resistance line can lead to significant upward price movement as bearish pressure dissipates.
Dogecoin’s consistent historical behavior of breaking out of descending triangles and entering bull runs highlights the importance of patience and strategic analysis. While past performance does not guarantee future results, the pattern provides a compelling case for optimism.
Read more: Dogecoin (DOGE) Price Prediction 2024/2025/2030
Summary and Conclusion
Dogecoin’s recent price action aligns with historical patterns, suggesting a potential bullish reversal. Historical data from 2017 and 2021 shows that Dogecoin often follows descending triangle breakouts with substantial gains.
For traders, the descending triangle pattern offers a strategic framework for entering positions. With a well-placed stop-loss and target price, traders can manage risk while positioning for potential gains.
The current market phase, marked by a 47.48% correction, could be the precursor to another significant bull run for Dogecoin. Patience and strategic analysis, informed by historical patterns, could yield substantial rewards for Dogecoin investors.
Read more: How To Buy Dogecoin (DOGE) and Everything You Need To Know
Overall, understanding the descending triangle pattern and its implications provides valuable insights into Dogecoin’s price action. This knowledge, combined with strategic trading approaches, can help investors navigate the cryptocurrency market and capitalize on potential upward trends.
Disclaimer
In line with the Trust Project guidelines, this price analysis article is for informational purposes only and should not be considered financial or investment advice. BeInCrypto is committed to accurate, unbiased reporting, but market conditions are subject to change without notice. Always conduct your own research and consult with a professional before making any financial decisions. Please note that our Terms and Conditions, Privacy Policy, and Disclaimers have been updated.


Aayush Jindal, a luminary in the world of financial markets, whose expertise spans over 15 illustrious years in the realms of Forex and cryptocurrency trading. Renowned for his unparalleled proficiency in providing technical analysis, Aayush is a trusted advisor and senior market expert to investors worldwide, guiding them through the intricate landscapes of modern finance with his keen insights and astute chart analysis.
From a young age, Aayush exhibited a natural aptitude for deciphering complex systems and unraveling patterns. Fueled by an insatiable curiosity for understanding market dynamics, he embarked on a journey that would lead him to become one of the foremost authorities in the fields of Forex and crypto trading. With a meticulous eye for detail and an unwavering commitment to excellence, Aayush honed his craft over the years, mastering the art of technical analysis and chart interpretation.
As a software engineer, Aayush harnesses the power of technology to optimize trading strategies and develop innovative solutions for navigating the volatile waters of financial markets. His background in software engineering has equipped him with a unique skill set, enabling him to leverage cutting-edge tools and algorithms to gain a competitive edge in an ever-evolving landscape.
In addition to his roles in finance and technology, Aayush serves as the director of a prestigious IT company, where he spearheads initiatives aimed at driving digital innovation and transformation. Under his visionary leadership, the company has flourished, cementing its position as a leader in the tech industry and paving the way for groundbreaking advancements in software development and IT solutions.
Despite his demanding professional commitments, Aayush is a firm believer in the importance of work-life balance. An avid traveler and adventurer, he finds solace in exploring new destinations, immersing himself in different cultures, and forging lasting memories along the way. Whether he’s trekking through the Himalayas, diving in the azure waters of the Maldives, or experiencing the vibrant energy of bustling metropolises, Aayush embraces every opportunity to broaden his horizons and create unforgettable experiences.
Aayush’s journey to success is marked by a relentless pursuit of excellence and a steadfast commitment to continuous learning and growth. His academic achievements are a testament to his dedication and passion for excellence, having completed his software engineering with honors and excelling in every department.
At his core, Aayush is driven by a profound passion for analyzing markets and uncovering profitable opportunities amidst volatility. Whether he’s poring over price charts, identifying key support and resistance levels, or providing insightful analysis to his clients and followers, Aayush’s unwavering dedication to his craft sets him apart as a true industry leader and a beacon of inspiration to aspiring traders around the globe.
In a world where uncertainty reigns supreme, Aayush Jindal stands as a guiding light, illuminating the path to financial success with his unparalleled expertise, unwavering integrity, and boundless enthusiasm for the markets.


A financial analyst has publicly criticized the use of global M2 money supply data to predict Bitcoin (BTC) price movements, calling such analyses mathematically unsound and misleading.
The criticism comes amid a surge in the global M2 money supply to an all-time high. Several analysts are forecasting similar trends for BTC.
Is Global M2 Money Data a Reliable Predictor for Bitcoin Price Movements?
The analyst, known as TXMCtrades, shared his thoughts on X (formerly Twitter). He specifically pointed to a chart by macro investor Raoul Pal that compared Bitcoin’s price to global M2.
TXMCtrades argued that charting global M2 daily or weekly is fundamentally flawed due to the inconsistent update frequencies of the underlying data. According to him, doing so distorts the information by amplifying short-term fluctuations instead of providing an accurate, long-term trend.
“People, you can’t create a daily or weekly time series of “Global M2” when the United States is only updating M2 on a weekly basis and all others are monthly!” the post read.
He explained that many countries have yet to update their figures beyond February, creating significant gaps in the dataset. TXMCtrades contended that this inconsistency results in a metric that largely reflects foreign exchange (FX) fluctuations rather than actual money supply dynamics.
“You’re looking at an M2 weighted inverse dollar exchange rate 95% of the time. Be better at math!” he added.
He also highlighted broader concerns about the misuse of global M2. The analyst stressed that China, which constitutes 46% of global M2, is the only major economy with a broad money supply above its post-COVID peak in dollar terms.
“They are currently trying to ease out of an ongoing multi-year debt deflation and doing a pretty shit job of it. Their M2 goes straight up,” TXMCtrades remarked.
Meanwhile, US M2 remains below its 2022 peak. In addition, the analyst emphasized that it is growing at its slowest pace since Bitcoin’s inception, excluding the 2022-2024 period. This suggests that the US is not experiencing rapid money supply growth, which could impact inflation or other economic trends.
This disparity, TXMCtrades argues, further undermines the reliability of global M2 as a predictor of Bitcoin price movements. The analyst also disputed the use of “random offsets” to align global M2 with Bitcoin price movements, a method employed by several analysts.
For instance, Raoul Pal has suggested a 12-week lag between global M2 and Bitcoin’s price. Meanwhile, Colin Talks Crypto proposes a 15.4-week lag. Meanwhile, Mr. Wall Street estimates the lag to be between 10.7 and 15 weeks. Some have even extended the M2 correlation to predict altcoin prices, such as Solana (SOL).
“SOL has been following Global M2 Money Supply (+100 days) its last two legs up. If this continues, SOL is set to pump massively within the next 2 weeks,” analyst Curb posted.
Nonetheless, the analyst stated that offsets are often arbitrary and don’t reflect the actual dynamics of money supply or asset prices.
“Money is money, it doesn’t have a wait time,” he claimed.
The analyst suggested that such models are overfitted to recent historical data and lack a strong foundation for forecasting. Lastly, TXMCtrades called for greater rigor in financial analysis. He urged analysts to “stop proliferating scammy analysis” and adopt more mathematically sound approaches to understanding cryptocurrency price dynamics.
Disclaimer
In adherence to the Trust Project guidelines, BeInCrypto is committed to unbiased, transparent reporting. This news article aims to provide accurate, timely information. However, readers are advised to verify facts independently and consult with a professional before making any decisions based on this content. Please note that our Terms and Conditions, Privacy Policy, and Disclaimers have been updated.

Reason to trust
![]()
Strict editorial policy that focuses on accuracy, relevance, and impartiality
Created by industry experts and meticulously reviewed
The highest standards in reporting and publishing
Strict editorial policy that focuses on accuracy, relevance, and impartiality
Morbi pretium leo et nisl aliquam mollis. Quisque arcu lorem, ultricies quis pellentesque nec, ullamcorper eu odio.
Ethereum price started a fresh decline below the $1,650 zone. ETH is now consolidating and might decline further below the $1,550 support zone.
- Ethereum started a fresh decline below the $1,650 and $1,620 levels.
- The price is trading below $1,600 and the 100-hourly Simple Moving Average.
- There is a new connecting bearish trend line forming with resistance at $1,600 on the hourly chart of ETH/USD (data feed via Kraken).
- The pair could start a fresh increase if it clears the $1,655 resistance zone.
Ethereum Price Faces Resistance
Ethereum price struggled to continue higher above $1,700 and started a fresh decline, like Bitcoin. ETH declined below the $1,620 and $1,600 support levels. It even spiked below $1,550.
A low was formed at $1,538 and the price is now correcting some losses. There was a move above the $1,565 level. The price climbed above the 23.6% Fib retracement level of the downward move from the $1,690 swing high to the $1,538 low.
Ethereum price is now trading below $1,600 and the 100-hourly Simple Moving Average. On the upside, the price seems to be facing hurdles near the $1,600 level. There is also a new connecting bearish trend line forming with resistance at $1,600 on the hourly chart of ETH/USD.
The next key resistance is near the $1,615 level or the 50% Fib retracement level of the downward move from the $1,690 swing high to the $1,538 low. The first major resistance is near the $1,650 level. A clear move above the $1,650 resistance might send the price toward the $1,690 resistance.

An upside break above the $1,690 resistance might call for more gains in the coming sessions. In the stated case, Ether could rise toward the $1,750 resistance zone or even $1,800 in the near term.
Another Decline In ETH?
If Ethereum fails to clear the $1,600 resistance, it could start another decline. Initial support on the downside is near the $1,560 level. The first major support sits near the $1,535 zone.
A clear move below the $1,535 support might push the price toward the $1,500 support. Any more losses might send the price toward the $1,420 support level in the near term. The next key support sits at $1,400.
Technical Indicators
Hourly MACD – The MACD for ETH/USD is losing momentum in the bearish zone.
Hourly RSI – The RSI for ETH/USD is now above the 50 zone.
Major Support Level – $1,535
Major Resistance Level – $1,650

Crypto Whales Bag $20M In AAVE & UNI, Are DeFi Tokens Eyeing Price Rally?

BNB Price Eyes Breakout, But $600 Remains A Stubborn Ceiling

Bitcoin and Global M2 Money Supply: A Misleading Connection?

Semler Scientific Files To Buy $500-M In Bitcoin

77K Ethereum Moved to Derivatives—Is Another Price Crash Looming?

Ethereum Price Struggles to Rebound—Key Hurdles In The Way

2.52 Million Altcoins Are Ruining Crypto’s Future

Animoca Brands Valuation Tanks 75% In Two Years, Here’s Why

Crypto exchange BingX hacked for $43 million

Are The Big Players Losing Interest?

Hong Kong’s Securities Association Tips Authorities On Crypto Self-Regulation

Coinbase cbBTC Set to go Live on Solana
2.52 Million Altcoins Are Ruining Crypto’s Future
Animoca Brands Valuation Tanks 75% In Two Years, Here’s Why
Crypto exchange BingX hacked for $43 million
Are The Big Players Losing Interest?
Hong Kong’s Securities Association Tips Authorities On Crypto Self-Regulation
Coinbase cbBTC Set to go Live on Solana
-
 Altcoin18 hours ago
Mantra (OM) Price Pumps As Founder Reveals Massive Token Burn Plan
-
 Altcoin24 hours ago
Expert Reveals Current Status Of 9 Ripple ETFs
-

 Ethereum20 hours ago
Ethereum Breakout Imminent? Analyst Expects ETH Price Surge To $2,000
-

 Market24 hours ago
Cardano (ADA) Pressure Mounts—More Downside on the Horizon?
-

 Market18 hours ago
This Crypto Security Flaw Could Expose Seed Phrases
-

 Bitcoin23 hours ago
China Liquidates Seized Crypto to Boost Struggling Treasury
-
 Altcoin23 hours ago
Bitcoin & Others Slip As Trump Imposes Up To 245% Tariff On China
-

 Market22 hours ago
Ethereum Price Dips Again—Time to Panic or Opportunity to Buy?
