
Market
Bearish Momentum at Key Levels

Cardano (ADA) shows bearish momentum with critical support and resistance levels dictating potential price movements.
On-chain data reveals declining user engagement and short-term trading activity, impacting Cardano’s market outlook.
Cardano Technical Analysis on the 4-Hour Timeframe
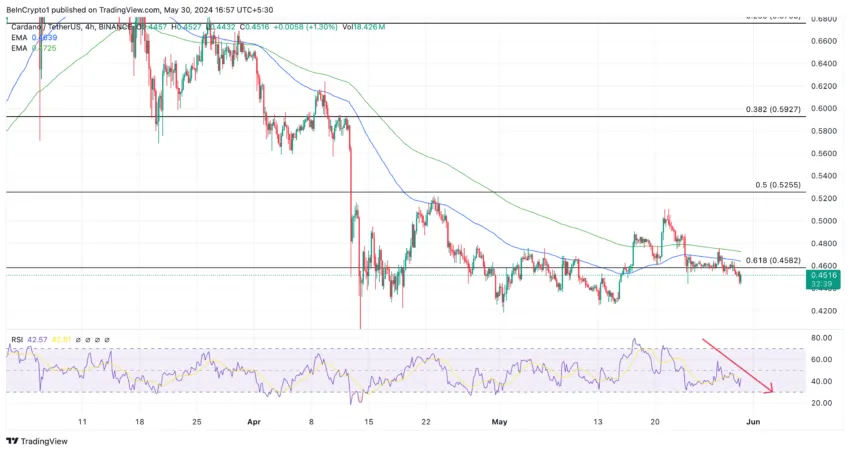
The ADA/USDT chart shows a bearish trend in the 4-hour timeframe. The price is below both the 100 EMA ($0.464) and the 200 EMA ($0.472). This indicates short and medium-term bearish momentum. The price is also struggling below the 0.618 Fibonacci level at $0.458, which is a crucial support.
The Relative Strength Index (RSI) is 42.57, below the neutral 50 level, suggesting strong selling pressure. The downward trend in RSI confirms the bearish sentiment. If the RSI continues to drop, it may signal further downside potential.
Key support is at $0.458, with a breakdown potentially leading to $0.420. Resistance levels to watch are $0.525 and $0.592. A move above these levels would indicate a bullish reversal. Currently, the sentiment remains bearish unless these resistance levels are broken.
Read More: How To Buy Cardano (ADA) and Everything You Need To Know
Analyzing Cardano’s Blockchain Activity
Daily Active Addresses Analysis
Notably, the green line representing active addresses shows a downward trend, indicating a decline in user engagement and transactions over time. This decline is a bearish signal, reflecting waning interest or activity in the Cardano network, which can impact its overall valuation and market sentiment.
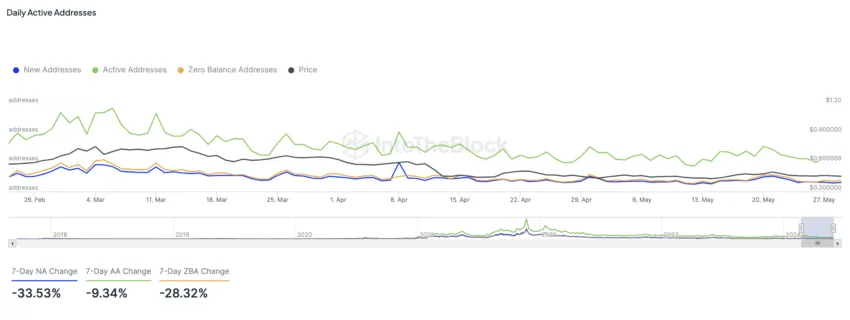
A key observation is the blue line (new addresses) superposition and the orange line (zero balance addresses). This alignment suggests that new entrants into the ADA ecosystem are not retaining their coins. Instead, they are either quickly selling off their ADA or using it in ways that result in zero balances.
This behavior indicates a lack of long-term commitment from new users, which is a bearish fundamental sign for Cardano. Without new investors holding onto their ADA, sustained growth and stability in price become challenging.
Furthermore, the percentage changes highlight the bearish trend. Over the past 7 days, new addresses have decreased by 33.53%, active addresses by 9.34%, and zero balance addresses by 28.32%. These metrics reinforce the narrative of declining interest and participation in the ADA network.
With fewer new addresses and a high number of zero balance addresses, the fundamental outlook remains bearish, suggesting potential further downside for ADA unless there is a significant shift in on-chain activity and investor behavior.
Addresses by Time Held Analysis
The chart illustrating addresses by time held provides a comprehensive view of the Cardano holding behavior. The green area represents Cruisers (holding for 1-12 months), and the orange area denotes Traders (holding for less than a month).
Read more: Cardano (ADA) Price Prediction 2024/2025/2030
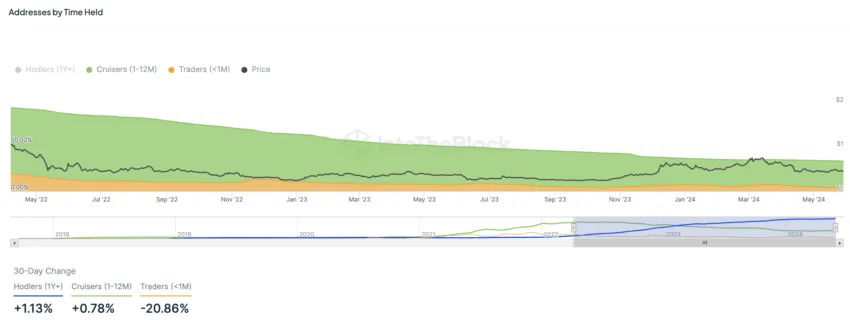
A significant observation is the decline in the proportion of traders, which has reduced by 20.86% over the past 30 days. This suggests a reduced short-term speculation and trading activity, which is typically bearish.
Traders’ diminishing presence indicates that fewer investors are actively trading ADA in the short term, possibly due to a lack of confidence in immediate price appreciation or volatile market conditions.
Strategic Recommendations
Monitor Resistance Levels: Monitor the resistance levels closely, especially the 0.618 Fibonacci level at $0.458. A break above this level could signal market optimism and a potential price reversal, shifting the outlook from bearish to neutral.
Evaluate Engagement Metrics: Observe the trends in active addresses and the balance behavior of new addresses. The superposition of new and zero-balance addresses indicates reduced engagement, which could impact price stability.
Adjust Trading Strategies: Given the reduction in short-term traders and the current bearish to neutral sentiment, consider short-term trading opportunities while being cautious of potential further downside. Be prepared to pivot strategies if a breakout above key resistance levels occurs, signaling a possible bullish reversal.
Disclaimer
In line with the Trust Project guidelines, this price analysis article is for informational purposes only and should not be considered financial or investment advice. BeInCrypto is committed to accurate, unbiased reporting, but market conditions are subject to change without notice. Always conduct your own research and consult with a professional before making any financial decisions. Please note that our Terms and Conditions, Privacy Policy, and Disclaimers have been updated.


On Friday, Solana (SOL) soared to a new all-time high (ATH), now trading at approximately $261. This breakthrough surpasses its previous peak set in November 2021.
Solana’s rise to a new ATH marks an increase of over 32 times from its lows recorded in December 2022.
Solana Hits All-Time High as Gary Gensler Plans Resignation
Solana’s path to this new high has been anything but smooth. After reaching its previous high in 2021, the platform faced a downturn in 2022 amid a broader crypto bear market, further exacerbated by technical issues and network downtimes.
The collapse of FTX in November 2022 pushed Solana’s price down to around $8.

However, Solana has since made a remarkable recovery, increasing more than 32-fold from its low. Now, Solana enthusiasts believe that SOL could eventually outpace Ethereum (ETH) in market capitalization.
“Solana has been at an all-time high by market cap for a while actually. Now, we’re finally in price discovery. The flippening is coming,” Birch, the founder of PathCrypto, said.
The surge in Solana’s market value coincides with the news of SEC Chairman Gary Gensler’s planned resignation, slated for January 20, 2025, as Donald Trump assumes office.
Known for his strict regulatory stance on cryptocurrencies, Gensler’s departure signals a potential shift toward a more crypto-friendly administration. Consequently, this political change is stoking speculations about the approval of a Solana exchange-traded fund (ETF). According to Fox Business journalist Eleanor Terrett, the SEC has begun engaging with issuers to explore the possibility of a Solana ETF.
“Talks between SEC staff and issuers looking to launch a Solana spot ETF are “progressing” with the SEC now engaging on S-1 applications. Recent engagement from staff, coupled with the incoming pro-crypto administration, is sparking a renewed sense of optimism that a Solana ETF could be approved sometime in 2025,” Terrett claimed.
Previous efforts to launch a Solana ETF were stalled by regulatory roadblocks, often stopping early in the process. However, the changing political environment and the SEC’s increased openness have reignited hopes within the crypto community. Recent filings for a Solana ETF by Canary Capital and BitWise reflect a growing interest and anticipation for regulatory approval.
Despite these encouraging developments, the odds of a Solana ETF approval in 2024 remain low, with Polymarket estimates placing it at around 4%.

Meanwhile, the crypto community is also closely watching Bitcoin as it approaches the highly anticipated $100,000 mark. On Friday, Bitcoin recorded a new high of about $99,300. This milestone is viewed as a pivotal moment for Bitcoin and could impact other cryptocurrencies, including Solana.
Disclaimer
In adherence to the Trust Project guidelines, BeInCrypto is committed to unbiased, transparent reporting. This news article aims to provide accurate, timely information. However, readers are advised to verify facts independently and consult with a professional before making any decisions based on this content. Please note that our Terms and Conditions, Privacy Policy, and Disclaimers have been updated.
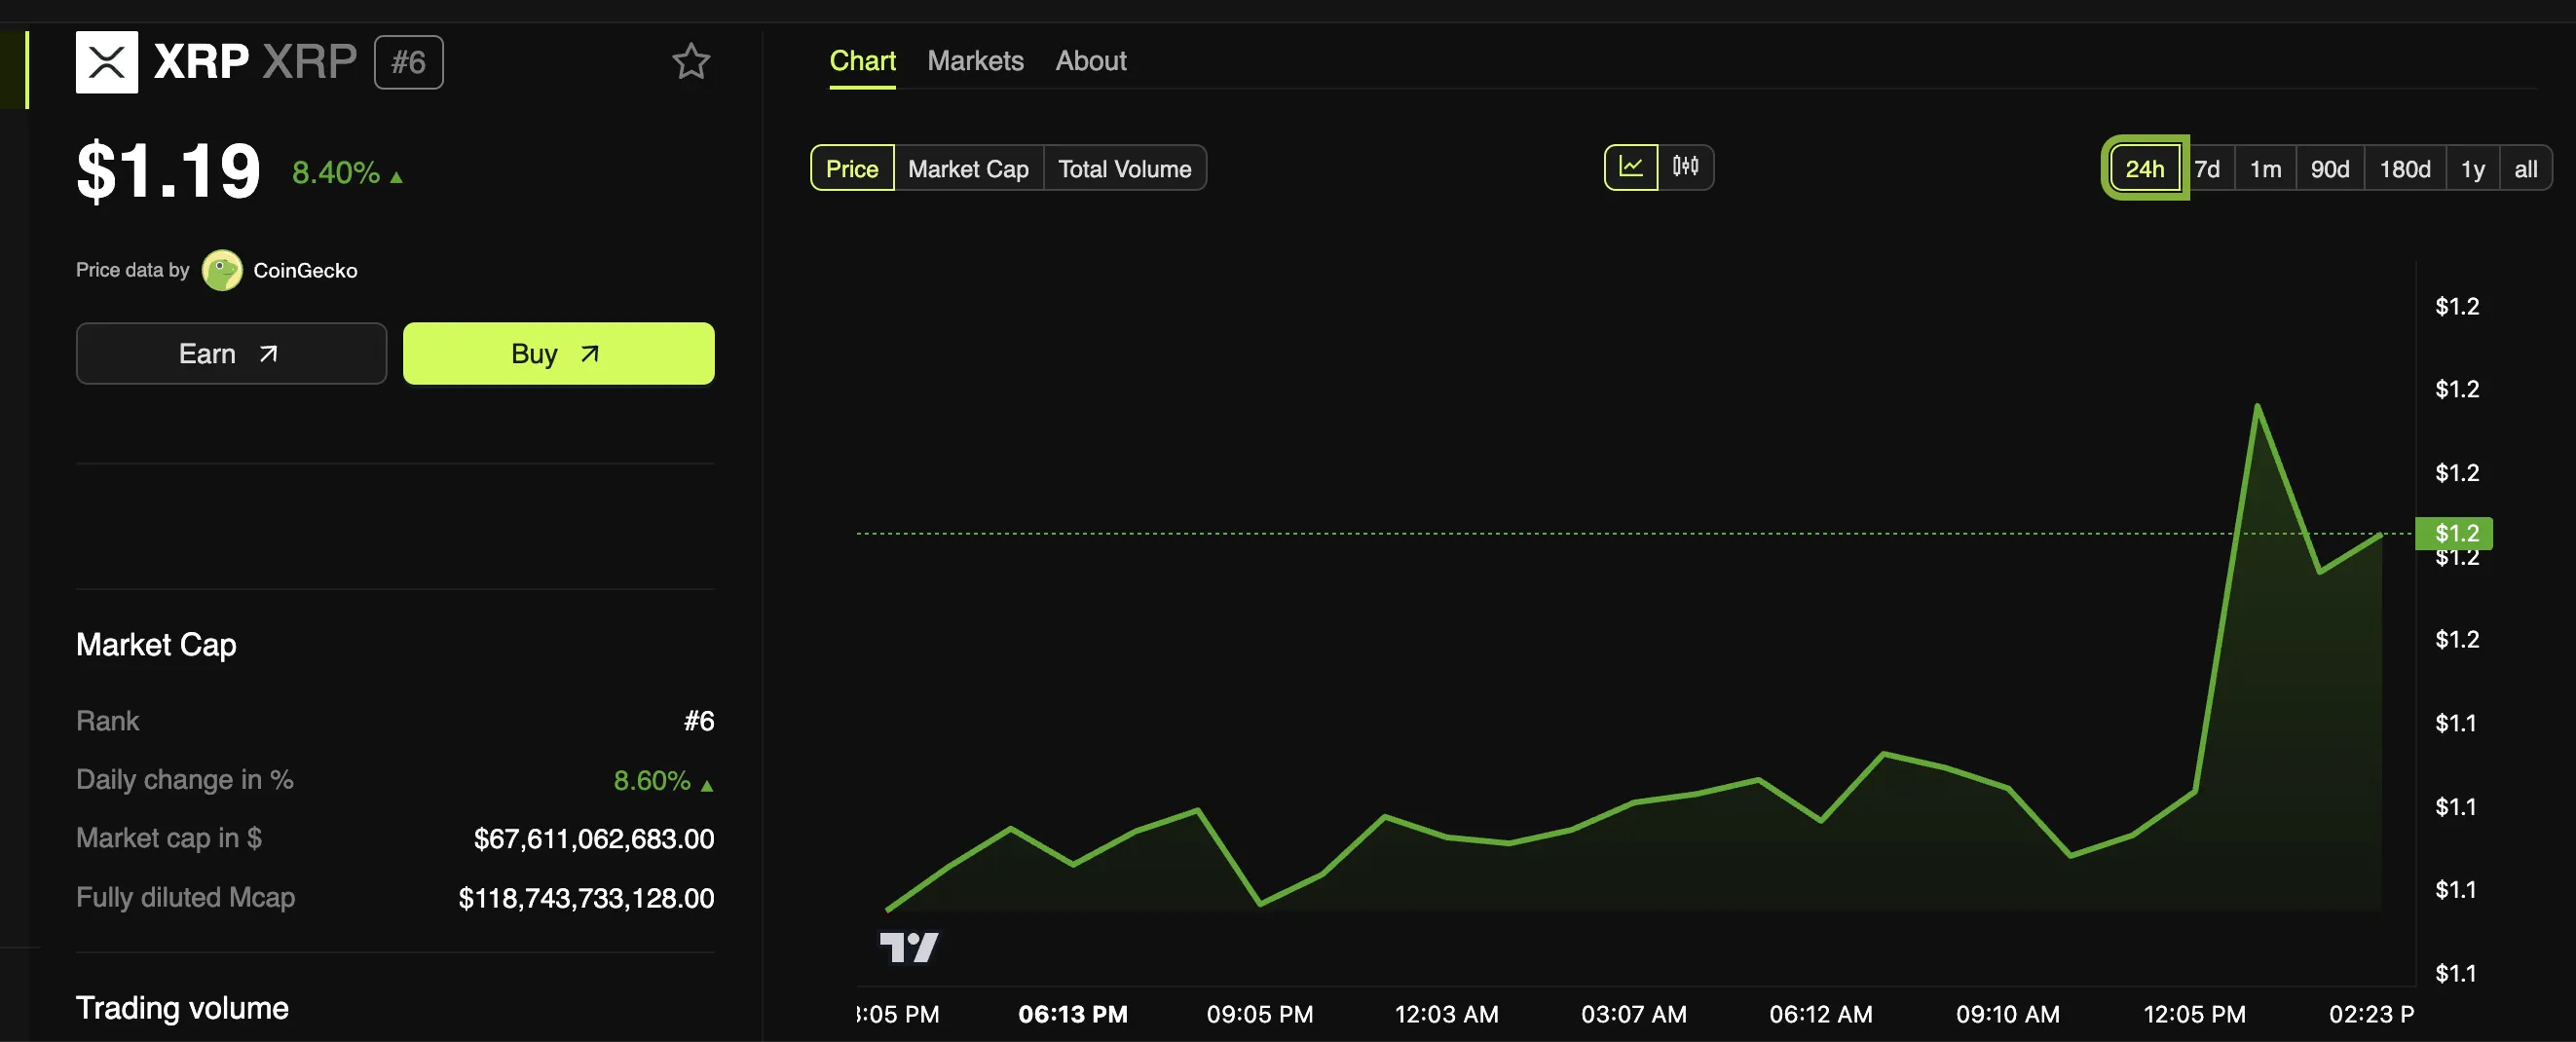
XRP price rallied above the $1.15 and $1.20 resistance levels. The price is up over 25% and might rise further above the $1.420 resistance.
- XRP price started a fresh surge above the $1.20 resistance level.
- The price is now trading above $1.250 and the 100-hourly Simple Moving Average.
- There was a break above a key bearish trend line with resistance at $1.1400 on the hourly chart of the XRP/USD pair (data source from Kraken).
- The pair is up over 25% and it seems like the bulls are not done yet.
XRP Price Eyes Steady Increase
XRP price formed a base above $1.050 and started a fresh increase. There was a move above the $1.150 and $1.20 resistance levels. It even pumped above the $1.25 level, beating Ethereum and Bitcoin in the past two sessions.
There was also a break above a key bearish trend line with resistance at $1.1400 on the hourly chart of the XRP/USD pair. A high was formed at $1.4161 and the price is now consolidating gains. It is trading above the 23.6% Fib retracement level of the upward move from the $1.0649 swing low to the $1.4161 high.
The price is now trading above $1.30 and the 100-hourly Simple Moving Average. On the upside, the price might face resistance near the $1.400 level. The first major resistance is near the $1.420 level. The next key resistance could be $1.450.

A clear move above the $1.450 resistance might send the price toward the $1.50 resistance. Any more gains might send the price toward the $1.550 resistance or even $1.620 in the near term. The next major hurdle for the bulls might be $1.750 or $1.80.
Are Dips Supported?
If XRP fails to clear the $1.420 resistance zone, it could start a downside correction. Initial support on the downside is near the $1.3350 level. The next major support is near the $1.2850 level.
If there is a downside break and a close below the $1.2850 level, the price might continue to decline toward the $1.240 support or the 50% Fib retracement level of the upward move from the $1.0649 swing low to the $1.4161 high in the near term. The next major support sits near the $1.20 zone.
Technical Indicators
Hourly MACD – The MACD for XRP/USD is now gaining pace in the bearish zone.
Hourly RSI (Relative Strength Index) – The RSI for XRP/USD is now above the 50 level.
Major Support Levels – $1.3350 and $1.2850.
Major Resistance Levels – $1.4000 and $1.4200.

ETF issuer WisdomTree’s European division just announced a new ETP based on XRP. This product is currently available in four EU countries, which has led XRP’s price to jump slightly.
ETPs are a common issuer strategy to earn revenue without ETF approval, but Europe will not necessarily approve one even if the US does so.
WisdomTree’s XRP ETP
WisdomTree, one of the Bitcoin ETF issuers in the US, announced that its European branch is offering an exchange-traded product (ETP) based on XRP. This new product is currently available in Germany, Switzerland, France, and the Netherlands. A growing number of issuers have filed for an XRP ETF, but WisdomTree is taking a slightly different tack.
“The WisdomTree Physical XRP ETP offers a simple, secure, and low-cost way to gain exposure to XRP, one of the largest cryptocurrencies by market capitalization. Backed 100% by XRP, XRPW is the lowest-priced XRP ETP in Europe, providing direct spot price exposure,” the announcement claimed.
The possibility of an official XRP ETF is growing with the current bull market, and Ripple CEO Brad Garlinghouse considers it “inevitable.” Still, it hasn’t happened yet, and ETP offerings allow issuers to somewhat address customers’ requirements. BitWise, which has also filed for an XRP ETF in the US, recently acquired a European ETP issuer to enter the same market.
WisdomTree, however, is no stranger to this market strategy. In May this year, it won approval to offer ETPs based on Bitcoin and Ethereum to British investors.
The UK has not yet approved a full ETF for either of these assets, but WisdomTree still gained market access. Even a fraction of the XRP market could also prove lucrative; the asset’s value spiked today.
WisdomTree Europe’s strategy page does not describe any further actions upon full approval. Even if the US approves an XRP ETF under the SEC’s new leadership, that won’t necessarily benefit WisdomTree’s European branch. For now, these ETPs built on XRP will have to suffice for this market.
Disclaimer
In adherence to the Trust Project guidelines, BeInCrypto is committed to unbiased, transparent reporting. This news article aims to provide accurate, timely information. However, readers are advised to verify facts independently and consult with a professional before making any decisions based on this content. Please note that our Terms and Conditions, Privacy Policy, and Disclaimers have been updated.

XRP Price Rally to $2 As Paul Atkins Leads to Replace US SEC Chair Gary Gensler

Solana Hits New All-Time High After 3 Years

Bitcoin’s Put-to-Call Ratio Tops 1.0: Bearish Signs Ahead?
Solana Hits New ATH On Huge Whale Accumulation, More Gains Ahead?

XRP Price 25% Rally: Breaking Barriers and Surpassing Odds

Dogecoin Hashrate Surges To New All-Time High Amid Rise In Positive Momentum

2.52 Million Altcoins Are Ruining Crypto’s Future

Animoca Brands Valuation Tanks 75% In Two Years, Here’s Why

Crypto exchange BingX hacked for $43 million

Are The Big Players Losing Interest?

Hong Kong’s Securities Association Tips Authorities On Crypto Self-Regulation

Coinbase cbBTC Set to go Live on Solana
2.52 Million Altcoins Are Ruining Crypto’s Future
Animoca Brands Valuation Tanks 75% In Two Years, Here’s Why
Crypto exchange BingX hacked for $43 million
Are The Big Players Losing Interest?
Hong Kong’s Securities Association Tips Authorities On Crypto Self-Regulation
Coinbase cbBTC Set to go Live on Solana
-

 Market21 hours ago
South Korea Unveils North Korea’s Role in Upbit Hack
-
 Altcoin23 hours ago
Why FLOKI Price Hits 6-Month Peak With 5% Surge?
-

 Bitcoin16 hours ago
Marathon Digital Raises $1B to Expand Bitcoin Holdings
-
 Market16 hours ago
ETH/BTC Ratio Plummets to 42-Month Low Amid Bitcoin Surge
-

 Market15 hours ago
SEC Moves Toward Solana ETF Approval Amid Pro-Crypto Shift
-
 Altcoin19 hours ago
Sui Network Back Online After 2-Hour Outage, Price Slips
-
 Altcoin18 hours ago
Dogecoin Whale Accumulation Sparks Optimism, DOGE To Rally 9000% Ahead?
-
 Altcoin21 hours ago
Vitalik Buterin, Coinbase’s Jesse Pollack Buy Super Anon (ANON) Tokens On Base