
Market
Why Litecoin (LTC) Isn’t the Best Buy Right Now

The price of Litecoin (LTC) and investors have been reeling from the massive 30% decline LTC observed in early April.
But before the altcoin could recover from this, the investors seem to be choosing a different, more bearish path.
Litecoin investors seek profits
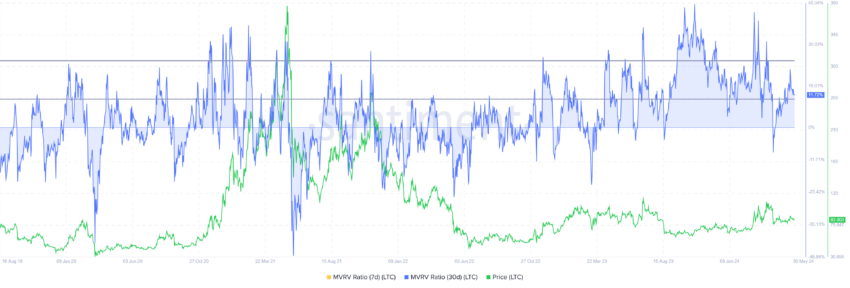
Litecoin’s price has been struggling to recover from the early April correction, as evidenced by the lack of profits recorded across the network. Since recovery will take a while, LTC holders seem to be looking to tap out before their losses rise.
This can be observed in the Market Value to Realized Value (MVRV) ratio, which evaluates investor profit or loss. Litecoin’s 30-day MVRV is currently at 11%, indicating profit and potentially leading to selling. Historically, LTC corrections happen when the MVRV is in the 10% to 24% range, known as the danger zone.
This is the case with Litecoin’s price as well.
Secondly, the change in the behavior of the investors is in line with the market sentiment, which is visible on the Relative Strength Index (RSI). The Relative Strength Index (RSI) is a momentum oscillator that measures the speed and change of price movements, ranging from 0 to 100. An RSI above 70 indicates overbought conditions, while an RSI below 30 indicates oversold conditions.
Read More: How To Buy Litecoin (LTC) and Everything You Need To Know
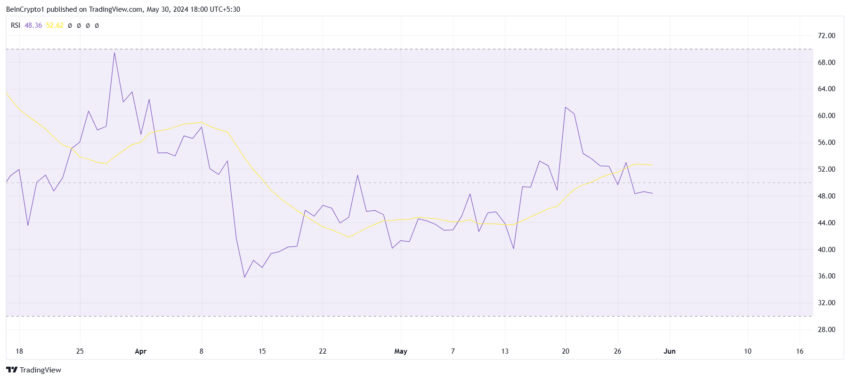
Although LTC is not overbought, it is still below the neutral line marked at 50.0. Cementing this line as a support floor is considered a bullish sign. But Litecoin might not be looking at this in the immediate future.
LTC Price Prediction: Staying Above $80
Litecoin’s price has been struggling to breach above $90, which would flip the 38.2% Fibonacci Retracement into support. But worse than this, LTC fell below the 23.6% Fib line.
This Fib level is known as the bear market support floor, and sustaining above it is considered a bullish sign. But a dip below it is a bearish signal. If Litecoin’s price follows this path, it could observe a drawdown to $80.
Read More: Litecoin (LTC) Price Prediction 2024/2025/2030
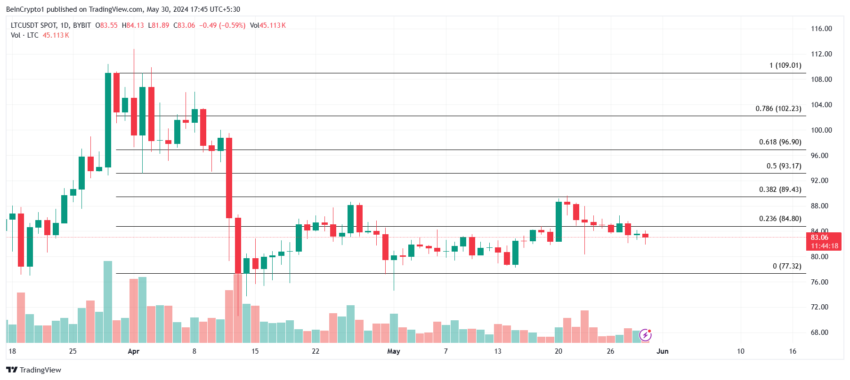
However, if the broader market cues change and Litecoin’s price turns bullish, it could reclaim the 23.6% Fib line as support. This might trigger recovery again, and a breach of $90 would invalidate the bearish thesis.
Disclaimer
In line with the Trust Project guidelines, this price analysis article is for informational purposes only and should not be considered financial or investment advice. BeInCrypto is committed to accurate, unbiased reporting, but market conditions are subject to change without notice. Always conduct your own research and consult with a professional before making any financial decisions. Please note that our Terms and Conditions, Privacy Policy, and Disclaimers have been updated.


Representative Jordan Pace introduced legislation to create a Bitcoin Reserve for South Carolina, joining a nationwide effort. Currently, nearly half of all US states have an active bill to create a similar Reserve.
However, the talking point that this bill “allows 10% of state funds” in Bitcoin investments is taking off like wildfire. It may scare off fiscal conservatives, which contributed to recent failures.
South Carolina Joins the Bitcoin Reserve Race
Since President Trump announced his intention to create a US Bitcoin Reserve, many state governments have attempted to create smaller models.
In the last month, these efforts have been intensifying, with more and more states joining the effort. Today, South Carolina filed its own Bitcoin Reserve bill, allowing the state to make substantial purchases:
“The State Treasurer may invest in digital assets including, but not limited to, Bitcoin with money that is unexpended, unencumbered, or uncommitted. The amount of money that the State Treasurer may invest in digital assets from a fund specified in this section may not exceed ten precent of the total funds under management,” it reads.
State Representative Jordan Pace proposed South Carolina’s Bitcoin Reserve legislation. He claimed that this bill “gives the Treasurer new tools to protect taxpayer dollars from inflation,” one of crypto’s most well-known use cases. Pace is currently the bill’s only sponsor, and it’s unclear what chances it has of passing.
Still, there may be challenges ahead. Similar proposals in other Republican-led states—like Montana and Wyoming—have already failed. This was largely due to concerns over using public funds to buy cryptocurrency.
Even though Trump backs the idea on a national level, not all GOP lawmakers are convinced at the state level.
That said, there are some signs of progress elsewhere. For example, Texas has advanced its Bitcoin Reserve bill, achieving bipartisan support. A key reason for its success is that the bill doesn’t require the state to make crypto purchases; it simply allows them at the Treasurer’s discretion.
Likewise, South Carolina’s bill wouldn’t force the state to invest 10% of its funds into Bitcoin. It just opens the door for that possibility, giving the state financial flexibility rather than a mandate.
Disclaimer
In adherence to the Trust Project guidelines, BeInCrypto is committed to unbiased, transparent reporting. This news article aims to provide accurate, timely information. However, readers are advised to verify facts independently and consult with a professional before making any decisions based on this content. Please note that our Terms and Conditions, Privacy Policy, and Disclaimers have been updated.


The FDIC and CFTC have both been working to change previous crypto guidelines. As federal regulators reconcile with the industry, they are removing old rules that specifically target crypto.
The former institution is removing the requirement that banks report crypto business, while the latter holds crypto to the same standards as other industries.
FDIC and CFTC Change Crypto Policies
The FDIC is one of the top financial regulators in the US, and it’s turning over a new leaf. After being one of the principal architects of Operation Choke Point 2.0, it recently began declassifying documents and changing rules that allowed crypto debanking.
Today, the agency is revoking a 2022 directive that impacted banks’ interactions with crypto:
“With today’s action, the FDIC is turning the page on the flawed approach of the past three years. I expect this to be one of several steps the FDIC will take to lay out a new approach for how banks can engage in crypto- and blockchain-related activities in accordance with safety and soundness standards,” said FDIC Acting Chairman Travis Hill.
Specifically, it rescinded a rule that mandated that all banks and institutions under its supervision notify the FDIC of any crypto involvement. The new guideline claims that banks “may engage in permissible crypto-related activities without receiving prior FDIC approval” without enacting any other policies.
Since Gary Gensler left the SEC, all the top US financial regulators have been trying to rework their relationship with crypto. In an apparent coincidence, the CFTC made a very similar move to the FDIC by rescinding two crypto guidelines.
Both of these actions did not establish a new policy; they merely removed the old ones.
Essentially, both of the CFTC’s rule changes are set to ensure that crypto-related derivatives are subject to the same requirements as non-crypto ones. This is somewhat surprising, considering that the industry has typically tried to insist that it necessitates specific regulations.
However, this is largely beside the point. The FDIC and CFTC are both working to remove previous guidelines that opposed the crypto industry.
These institutions will undoubtedly be amenable to creating new ones in the spirit of cooperation. In the meantime, this olive branch can help build a lot of goodwill.
Disclaimer
In adherence to the Trust Project guidelines, BeInCrypto is committed to unbiased, transparent reporting. This news article aims to provide accurate, timely information. However, readers are advised to verify facts independently and consult with a professional before making any decisions based on this content. Please note that our Terms and Conditions, Privacy Policy, and Disclaimers have been updated.

Pi Network (PI) has been under heavy selling pressure, with its price down more than 61% over the last 30 days. Despite a recent partnership with the Telegram Crypto Wallet, PI has struggled to regain momentum, as technical indicators remain mostly bearish.
Its BBTrend has been negative for 12 consecutive days, and although the RSI has recovered slightly from oversold levels, it still sits below the neutral 50 mark. With the downtrend firmly intact and critical support levels approaching, PI’s next move will likely depend on whether buyers can step in and reverse the current trajectory.
PI BBTrend Has Been Negative For 12 Days
Pi Network (PI) continues to face bearish pressure, as reflected in its BBTrend indicator, which remains deep in negative territory at -22.34.
This is despite recent headlines about the Telegram Crypto Wallet integrating Pi Network, news that has yet to translate into sustained upward momentum.
The BBTrend hit a recent low of -41 on March 21 and has stayed negative since March 16, marking twelve consecutive days of bearish trend signals. This prolonged weakness highlights the ongoing struggle for buyers to regain control of the market.
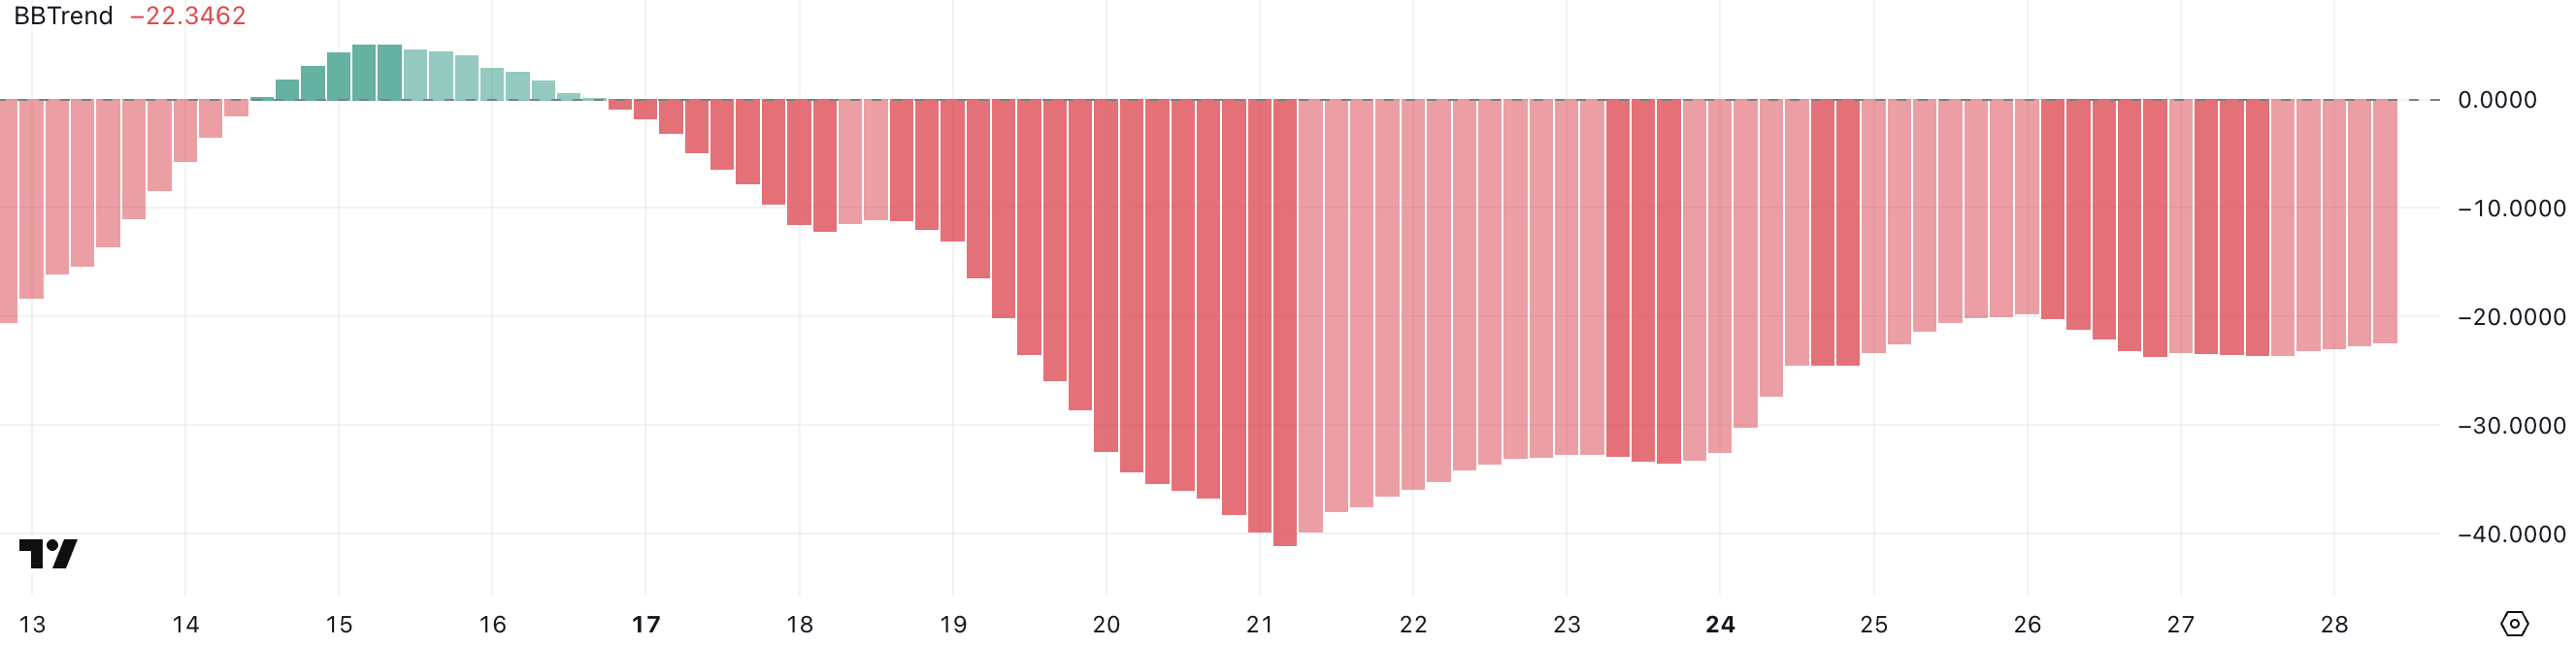
BBTrend, or Bollinger Band Trend, is a momentum-based indicator that helps gauge the strength and direction of a trend. Positive BBTrend values indicate bullish momentum, while negative values point to bearish sentiment—the further from zero, the stronger the trend.
With PI’s BBTrend sitting at -22.34, the market remains firmly under bearish influence, even if the worst of the recent downtrend may be easing slightly from its extreme lows.
Unless this trend flips back into positive territory soon, PI’s price could remain under pressure, with buyers staying cautious despite the recent integration news.
Pi Network RSI Has Recovered From Oversold But Still Lacks Bullish Momentum
Pi Network is showing early signs of recovery in momentum, with its Relative Strength Index (RSI) rising to 40.45 after hitting 23.8 just two days ago.
While this rebound suggests a reduction in overselling pressure, PI’s RSI hasn’t crossed above the neutral 50 mark in the past two weeks—highlighting ongoing weakness in bullish conviction.
Despite the slight uptick, the market has yet to see enough strength to shift sentiment meaningfully in favor of buyers. This cautious climb could either lead to a breakout or stall into continued consolidation.
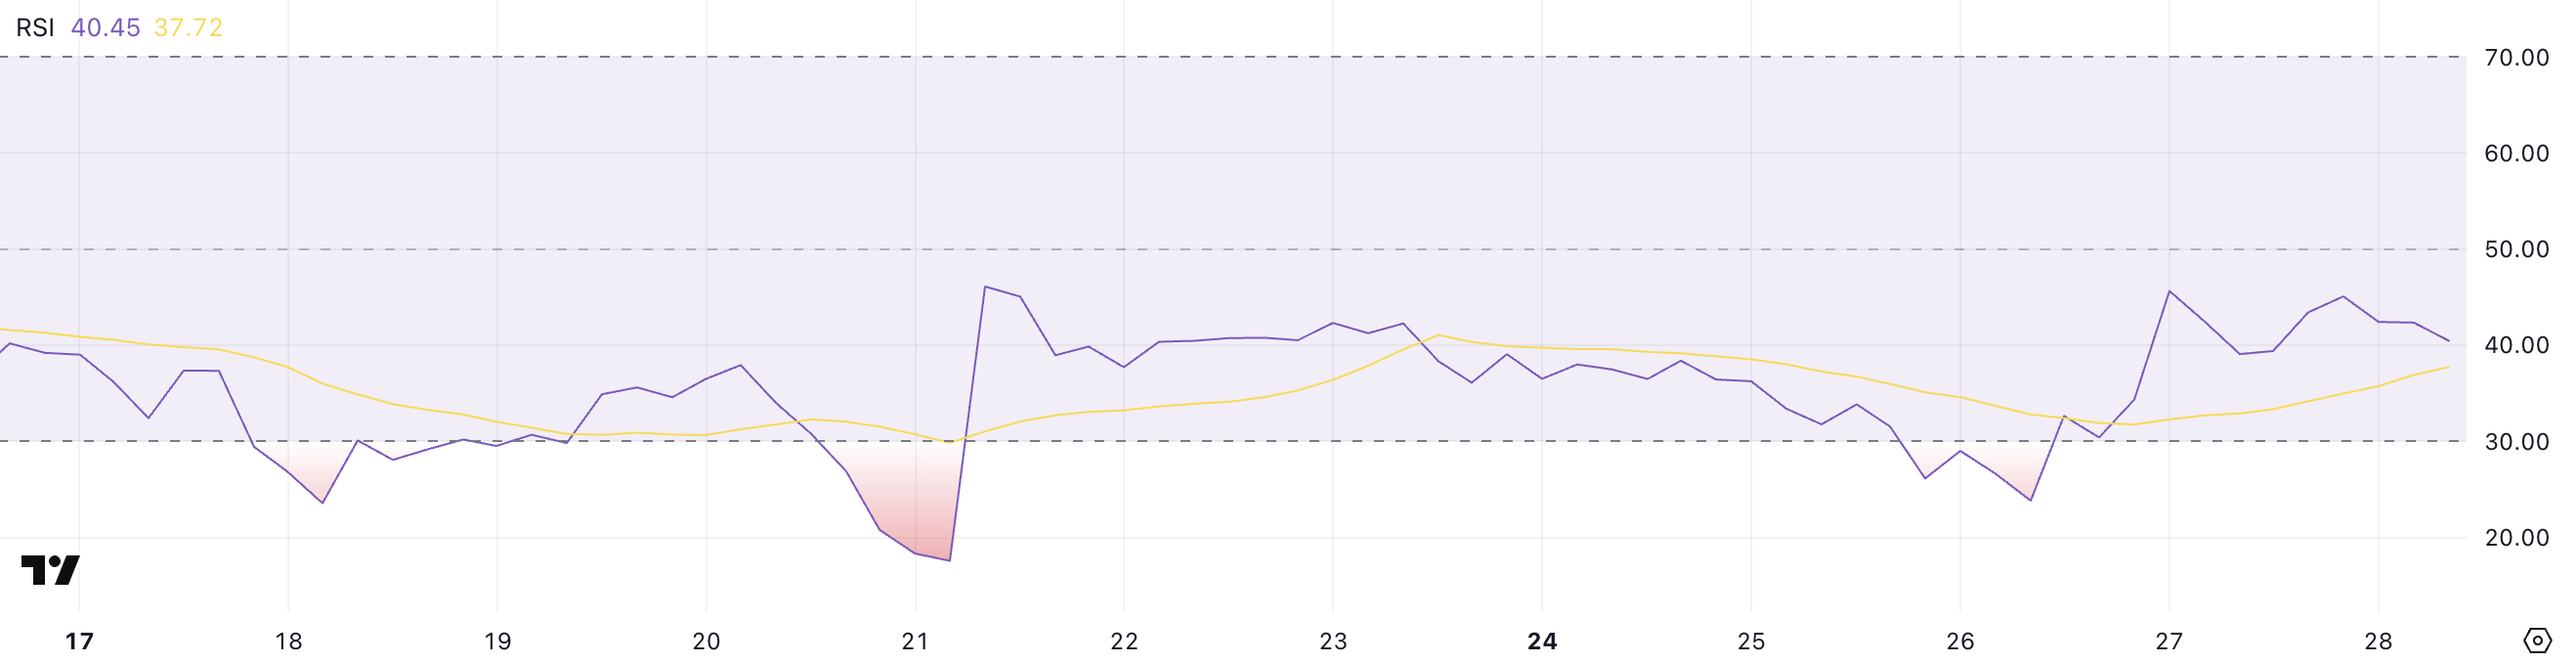
The RSI, or Relative Strength Index, is a momentum oscillator that measures the speed and change of price movements. It ranges from 0 to 100, with values above 70 indicating overbought conditions and those below 30 suggesting the asset is oversold.
With PI’s RSI currently at 40.45, it’s in a neutral-to-bearish zone—no longer extremely oversold but still lacking strong buying pressure.
For a clearer trend reversal, the RSI would likely need to break above 50, which hasn’t happened in two weeks. Thus, the current move is more of a potential bottoming attempt rather than a confirmed shift.
Will PI Continue Its Correction?
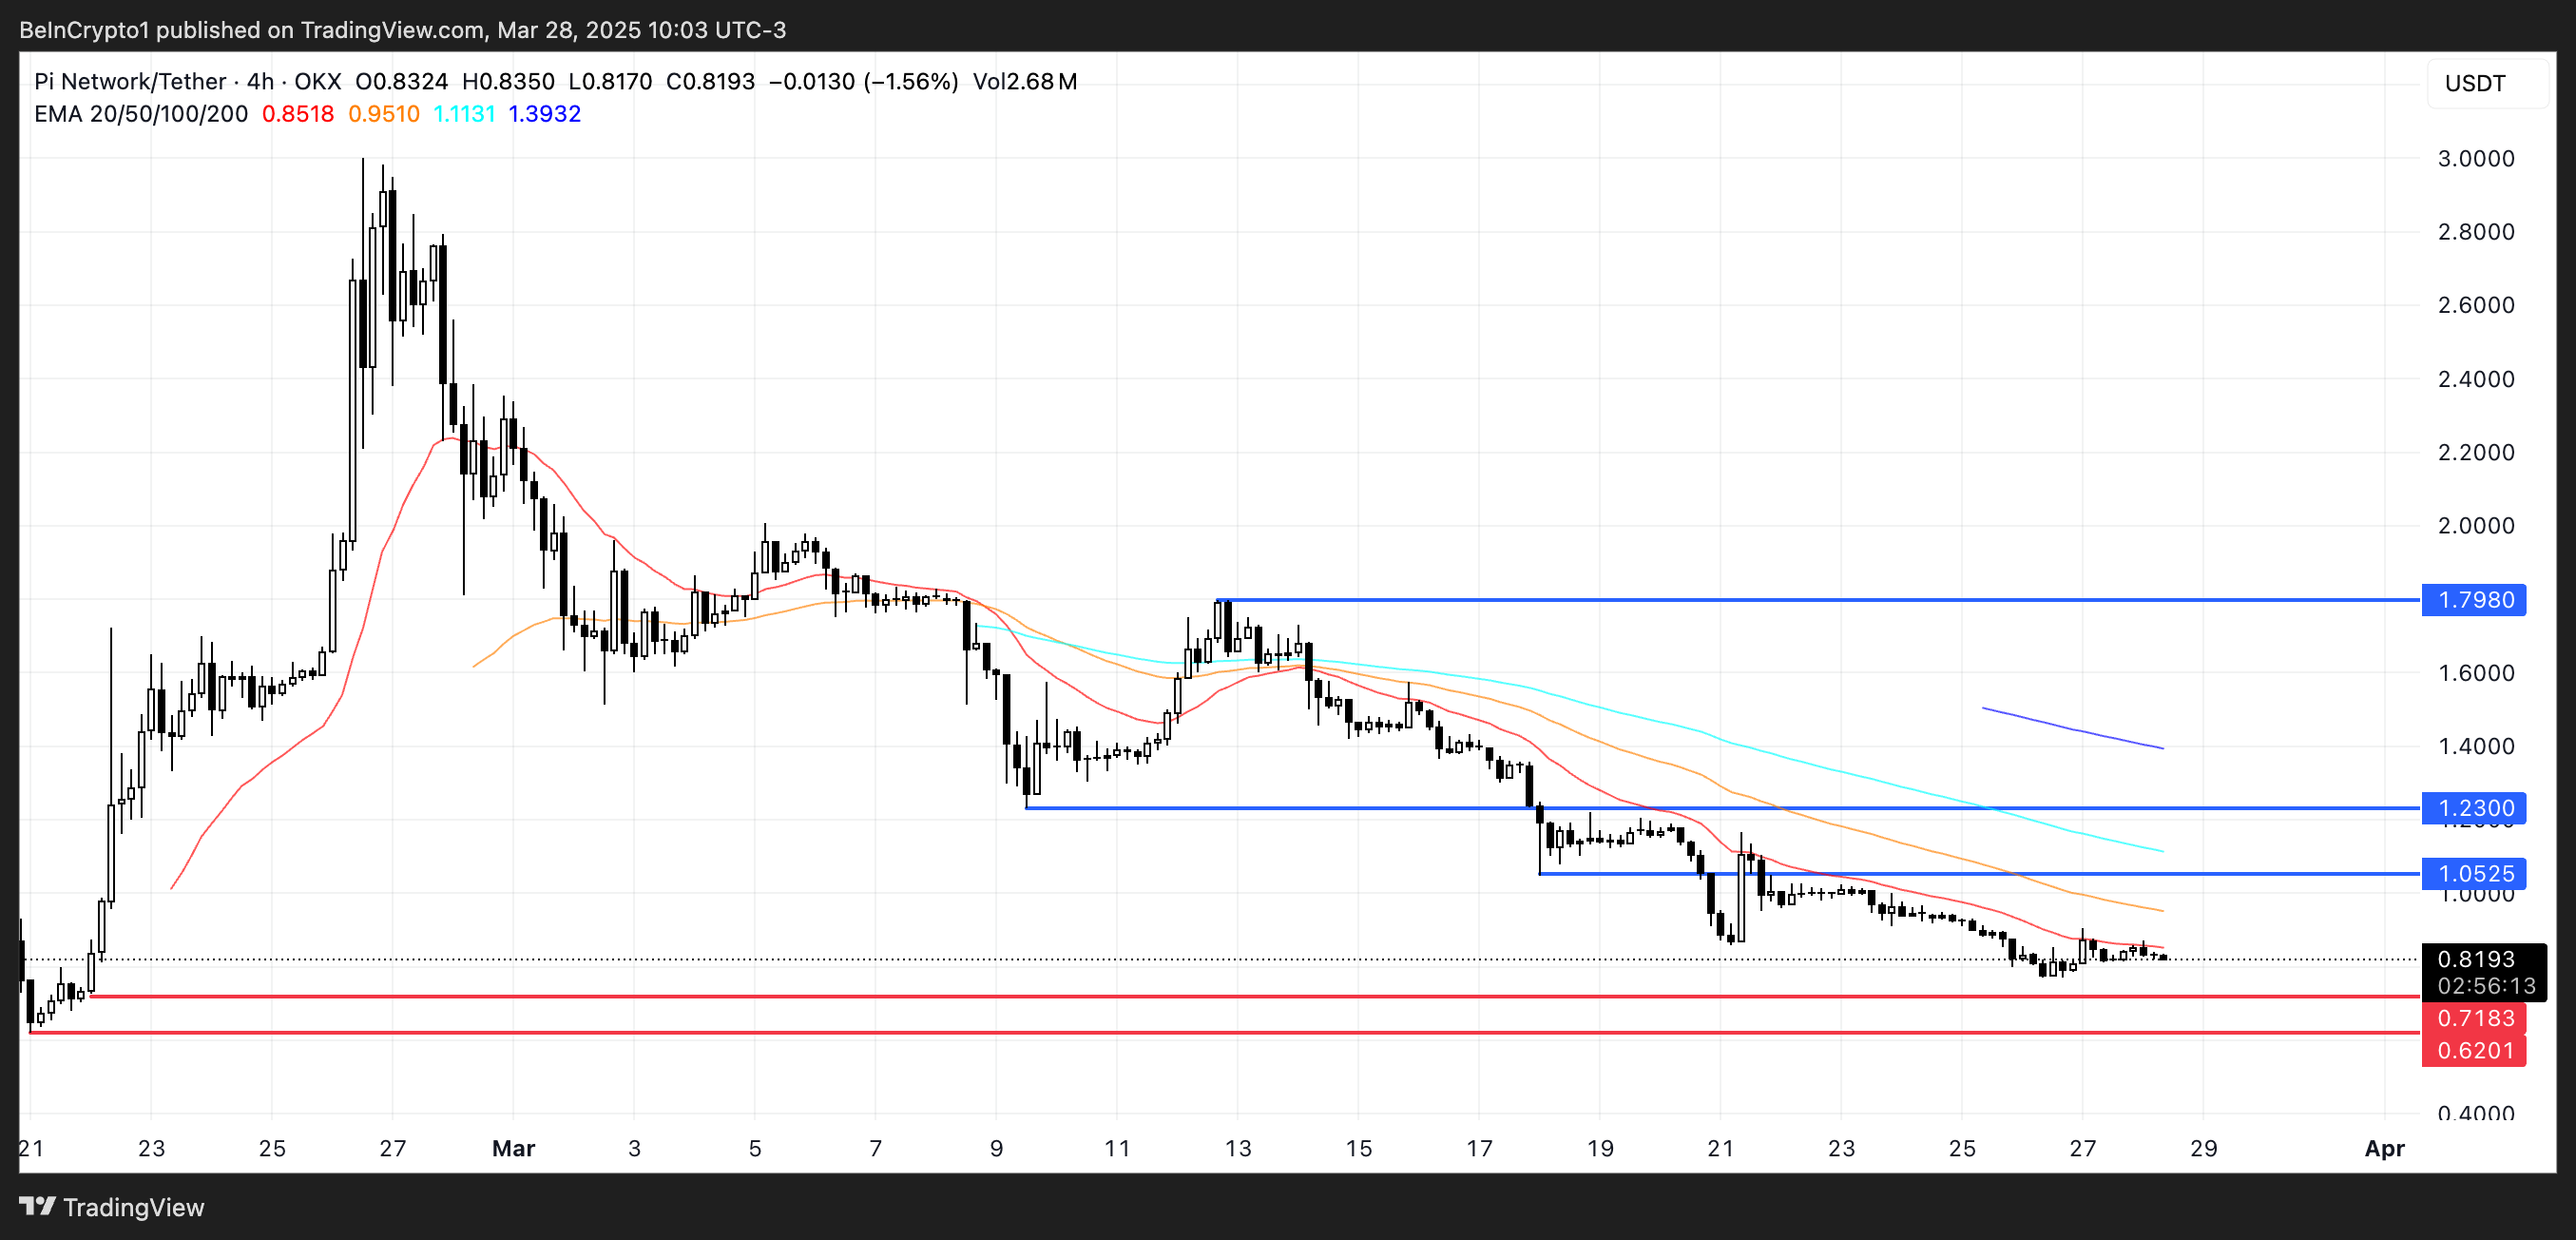
PI price is currently trading within a well-established downtrend, as indicated by the alignment of its EMA (Exponential Moving Average) lines—where shorter-term EMAs remain firmly below longer-term ones.
This setup reflects persistent selling pressure, and if the correction continues, PI could revisit key support levels at $0.718, with a potential drop to $0.62 if that floor fails to hold.
However, recent signs of life in the RSI hint that a short-term rebound might be brewing, offering some hope for a recovery.
If bullish momentum builds, PI could challenge resistance at $1.05 in the near term. A breakout above that level would shift sentiment and open the door for further gains, with $1.23 and even $1.79 as potential targets if the uptrend strengthens.
Disclaimer
In line with the Trust Project guidelines, this price analysis article is for informational purposes only and should not be considered financial or investment advice. BeInCrypto is committed to accurate, unbiased reporting, but market conditions are subject to change without notice. Always conduct your own research and consult with a professional before making any financial decisions. Please note that our Terms and Conditions, Privacy Policy, and Disclaimers have been updated.

South Carolina Could Spend 10% of Funds on Bitcoin Reserve

FDIC and CFTC Rescind Old Crypto Guidelines

Pi Network (PI) Drops Further Despite Telegram Wallet Deal

Chainlink Price Leads Altcoin Selloff, Where Is LINK Price Floor?

XRP Price Eyes 20% Move With Golden Pocket Appearance

Is Bitcoin About To Skyrocket Or Crash? What Truflation Says

2.52 Million Altcoins Are Ruining Crypto’s Future

Animoca Brands Valuation Tanks 75% In Two Years, Here’s Why

Crypto exchange BingX hacked for $43 million

Are The Big Players Losing Interest?

Hong Kong’s Securities Association Tips Authorities On Crypto Self-Regulation

Coinbase cbBTC Set to go Live on Solana
2.52 Million Altcoins Are Ruining Crypto’s Future
Animoca Brands Valuation Tanks 75% In Two Years, Here’s Why
Crypto exchange BingX hacked for $43 million
Are The Big Players Losing Interest?
Hong Kong’s Securities Association Tips Authorities On Crypto Self-Regulation
Coinbase cbBTC Set to go Live on Solana
-

 Bitcoin23 hours ago
Strategic Bitcoin Reserve Proposed by Brazil’s VP Advisor
-

 Market22 hours ago
XRP Price Slides Slowly—Is a Bigger Drop Coming?
-
 Market23 hours ago
Terra’s Crypto Claims Portal Opens Soon: Key Dates and Info
-
 Altcoin22 hours ago
Why Is Pi Network Coin Price Up 5% Despite Altcoins Market Correction?
-

 Regulation13 hours ago
FDIC Revises Crypto Guidelines Allowing Banks To Enter Digital Assets
-

 Market24 hours ago
Dogecoin (DOGE) Faces Market Correction—Will Buyers Step Back In?
-

 Ethereum17 hours ago
Ethereum Fails To Break $2,100 Resistance – Growing Downside Risk?
-

 Market17 hours ago
Analysts Reveal Q2 Crypto Market Outlook: BTC at $200,000?