
Market
Will It Hold or Break Out Bullishly?

HBAR’s current price action is crucial for traders looking to capitalize on long-term trends. The daily analysis highlights key support and resistance levels that could dictate future movements.
On the daily timeframe, HBAR is above the 200-week EMA. This level now acts as a critical support that the bulls need to maintain to maintain positive momentum.
Hedera Weekly Outlook
The HBAR/USDT pair is navigating a crucial technical landscape. Hedera price action is influenced by key indicators, including the 100-day and 200-day exponential moving averages (EMAs) and significant weekly baseline plateaus.
Long-term support levels include $0.067 and $0.073. These have historically acted as strong supports, preventing further declines.
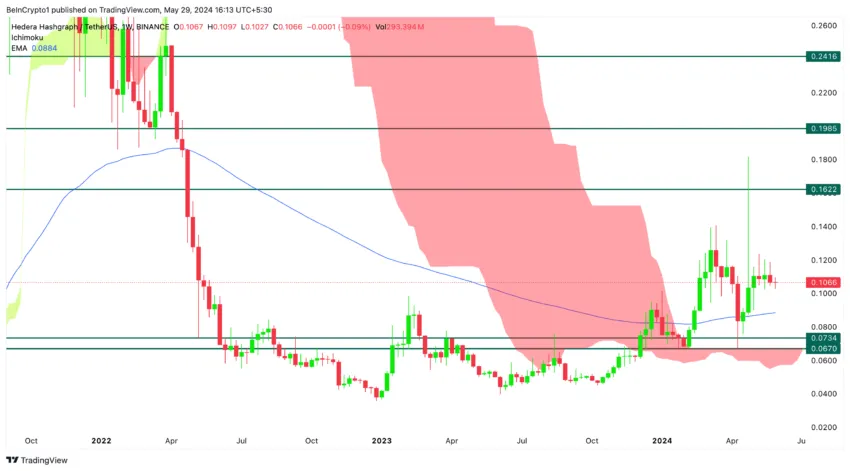
Long-term resistance levels to watch on a weekly basis are $0.162, which represents a significant barrier to a major potential price breakout, $0.198, which indicates a possible price ceiling, and $0.241, which represents a major hurdle to upward movement.
Read More: What Are Tokenized Real-World Assets (RWA)?
These levels are more important than those on the daily chart due to their long-term implications, providing more reliable signals for traders and investors.
Hedera Daily Outlook
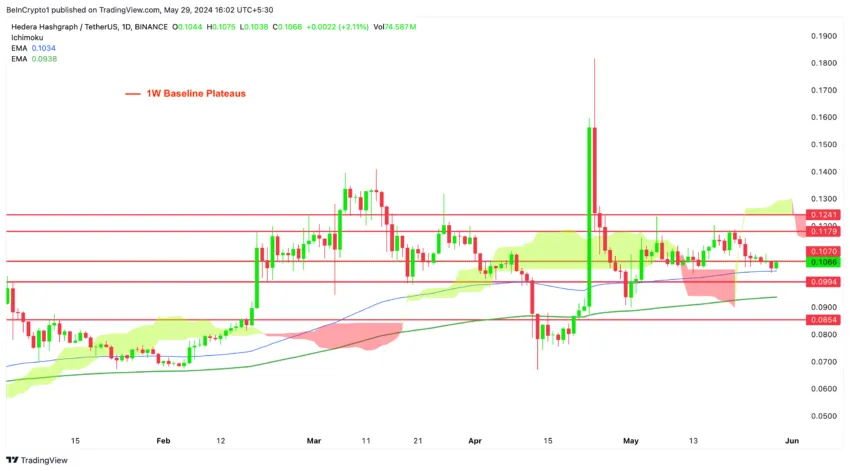
The price is above the 200-day EMA on the daily timeframe, indicating a bullish sentiment in the long-term trend. This level now acts as a critical support that the bulls need to maintain to maintain positive momentum.
The price also trades slightly above the 100-day EMA, suggesting medium-term support. However, the close proximity to this EMA indicates potential volatility and underscores the importance of maintaining this level to avoid further downside risk.
Weekly Baseline Plateaus
These lines represent pivotal support and resistance levels derived from the weekly Ichimoku baselines (in red), which are crucial in dictating price movements.
Mid-Term Resistance and Support Levels for HBAR/USDT
The key resistance levels for the HBAR/USDT pair are $0.124, $0.118, and $0.107. These levels represent significant barriers where the price may encounter selling pressure. On the support side, the critical levels to watch are $0.099, $0.090, and $0.085.
These levels are essential as they indicate where the price may find buying interest and potentially rebound.
The Ichimoku Cloud serves as an indicator of future support and resistance zones. The current price position below the cloud suggests a neutral to slightly bearish sentiment.
The cloud is transitioning from red to green, indicating potential bullish momentum if the price can break above and sustain levels within the cloud.
The HBAR price is currently at $0.106, positioned between resistance at $0.107 and support at $0.099. This tight range suggests a consolidation phase in which the market awaits a decisive breakout or breakdown.
Read More: Hedera (HBAR) Price Prediction 2024/2025/2030
The close proximity to both the 100-day and 200-day EMAs highlights the critical nature of this range. A breakout above $0.1070 could target higher resistance levels at $0.118 and $0.1241, while a breakdown below $0.0994 could lead to a test of lower support levels at $0.0900 and $0.0854.
Strategic Recommendations
Bearish to Neutral Outlook
The current outlook for Hedera is bearish to neutral in the mid-term. If the price tests the daily Ichimoku cloud on the upside, this could trigger a change in market sentiment, shifting from bearish to bullish and potentially reaching the critical resistance of $0.162.
Traders should closely monitor the price action around the key support and resistance levels and be prepared for potential volatility.
Disclaimer
In line with the Trust Project guidelines, this price analysis article is for informational purposes only and should not be considered financial or investment advice. BeInCrypto is committed to accurate, unbiased reporting, but market conditions are subject to change without notice. Always conduct your own research and consult with a professional before making any financial decisions. Please note that our Terms and Conditions, Privacy Policy, and Disclaimers have been updated.


Reserve Rights (RSR) has experienced a notable 22% increase in its price over the last 24 hours. This surge follows the news of Paul Atkins, former Reserve Rights Foundation advisor, becoming the new chair of the US Securities and Exchange Commission (SEC).
Additionally, US President Donald Trump’s decision to pause reciprocal tariffs has added a layer of optimism to the cryptocurrency market, further buoying RSR’s price.
Reserve Rights Investors May Note Profits Soon
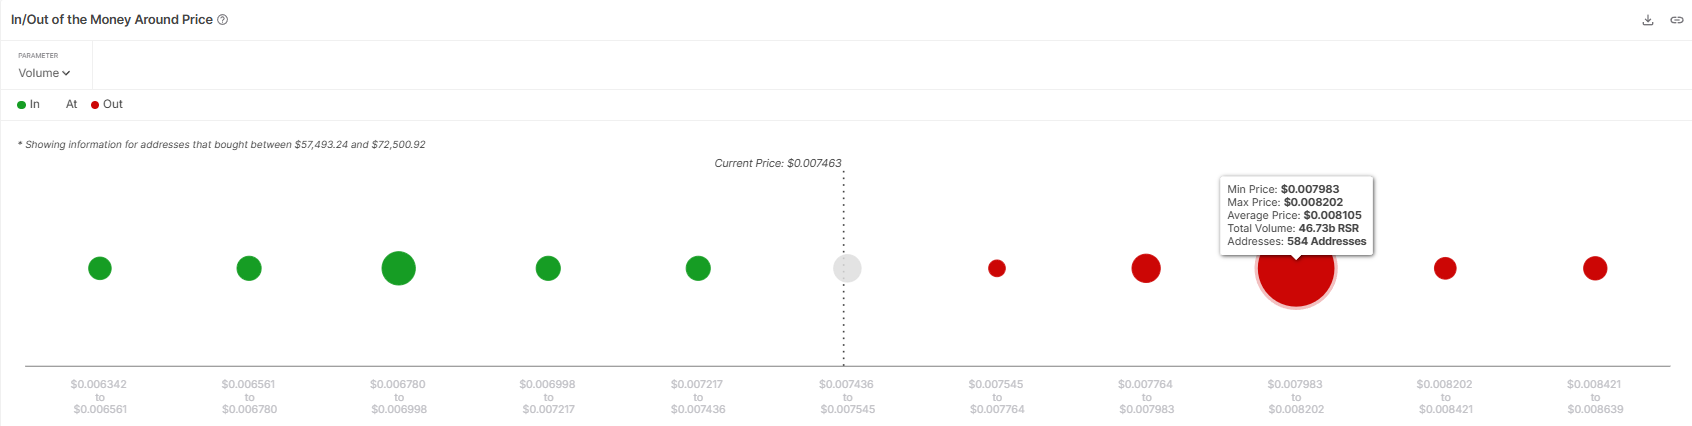
The market sentiment surrounding RSR remains cautiously optimistic, driven by a significant accumulation of tokens. According to the IOMAP, around 46.73 billion RSR tokens, valued at over $350 million, are currently sitting at a price range between $0.007983 and $0.008202.
These tokens have not yet reached a profit zone, but an 8% rally would make them profitable for investors. As these large holders are likely to maintain a bullish outlook, the anticipation of possible profits could further strengthen the buying sentiment, contributing to a price increase.
However, if the holders aim to sell for a break-even, it might negatively impact the RSR price rally.
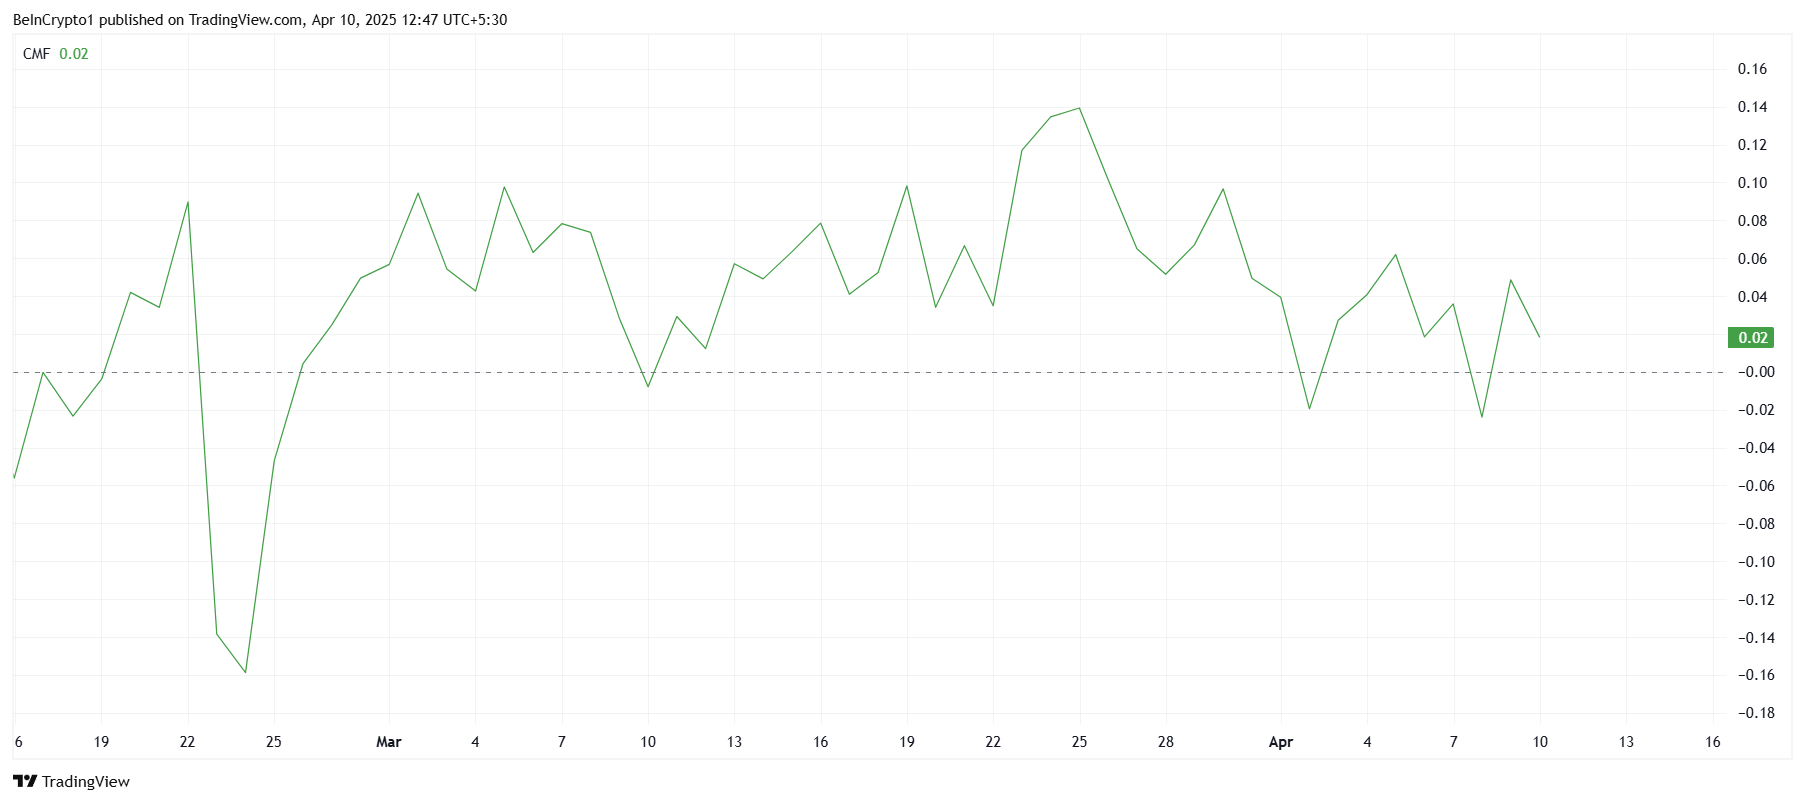
Despite the news of Paul Atkins becoming SEC Chair, the overall macro momentum for RSR appears to be lackluster. The Chaikin Money Flow (CMF) indicator, which measures market liquidity and investor buying pressure, has not seen any sharp upticks, even after the recent announcements.
This suggests that, while the netflows have been positive, they remain underwhelming compared to the size of the positive developments. If RSR’s price continues its uptick in the coming days, there is a chance that the CMF will start to reflect stronger positive sentiment.
RSR Price Is Rising
Reserve Rights (RSR) price is currently trading at $0.007543, with a strong support level at $0.007386. Given the 22% rally over the last 24 hours, it is possible that the token will continue to rise if it holds above this support.
A bounce off $0.007386 could see RSR making its way to $0.008196. This would bring the altcoin closer to a profitable range for many investors as well as imbue confidence regarding further rally.

However, should RSR fail to breach the $0.008196 resistance or fall below the support of $0.007386, the altcoin’s price could drop to $0.006601 or even lower towards $0.005900. This would significantly damage the bullish thesis and extend recent losses, potentially leading to a further period of consolidation.
Disclaimer
In line with the Trust Project guidelines, this price analysis article is for informational purposes only and should not be considered financial or investment advice. BeInCrypto is committed to accurate, unbiased reporting, but market conditions are subject to change without notice. Always conduct your own research and consult with a professional before making any financial decisions. Please note that our Terms and Conditions, Privacy Policy, and Disclaimers have been updated.

President Donald Trump’s latest decision to pause most of his tariffs has sparked a rally in stocks, bonds, the dollar, and cryptocurrencies. However, experts believe that the tariff delay may be creating a “dead cat bounce” in the market.
This recovery follows Trump’s earlier imposition of reciprocal tariffs on all nations, including a significant 104% tariff on Chinese imports. The announcement rattled markets, triggering a considerable downturn.
Is the Crypto Market Surge Just Another Dead Cat Bounce in Disguise?
BeInCrypto reported that Trump’s 90-day tariff pause excluded China. Importantly, following Beijing’s retaliatory measures, the tariffs have now escalated to 125%.
Nevertheless, the move has significantly boosted markets. The total cryptocurrency market capitalization surged by 5.5% in the past 24 hours, with Bitcoin (BTC) reclaiming the $80,000 mark.
Other major cryptocurrencies, such as Ethereum (ETH), XRP (XRP), and Solana (SOL), also recorded double-digit gains, signaling renewed investor optimism.

Yet, beneath the surface of this rally, skepticism remains prevalent. Jacob King, analyst and CEO of WhaleWire newsletter, warned that the tariff delay is setting a trap for retail investors.
“We’ve officially entered the dead cat bounce phase: delay the tariffs, bait the retail crowd back in, and set the stage for the next red wave,” he posted.
He predicts that while retail investors pile into the market, institutions will use the opportunity to “quietly dump their bags,” foreshadowing a sharp downturn. Many echo King’s concerns. Moreover, economics professor Steve Hanke was even more direct.
“If Trump continues to play his tariff cards, the rally will represent nothing more than a dead cat bounce,” Hanke said.
In fact, some investors are planning to sell to avoid losses.
“This is the 90 day dead cat exit bounce. sell in may and go away,” another analyst wrote.
Nonetheless, Amit, an investor and analyst, offered a different view. He suggested that the previous market bounce was a dead cat bounce because it was not based on any solid, fundamental reason.
This time, however, the analyst pointed out that there is an actual reason for market optimism.
“The difference here, and why selling into the rip *might* not be the best, is that if tariffs are truly delayed — well folks we have a fundamental catalyst for the markets,” he remarked.
He explained that the initial 10% tariffs were already priced in the market. However, the market could stabilize if the 90-day tariff pause extends indefinitely and leads to a deal with China.
“We also have sold off a ton assuming these tariffs would be in effect. Jobs data is fine. If the tariffs aren’t the issue, not saying we need to visit 7000 spx anytime soon, but it may not be a deadcat given this catalyst could be long-lasting,” Amit added.
It is worth noting that the term “dead cat bounce”—a temporary recovery in asset prices after a steep decline, followed by a continued downtrend—has surged in online searches, reaching levels not seen since the COVID-19 pandemic.
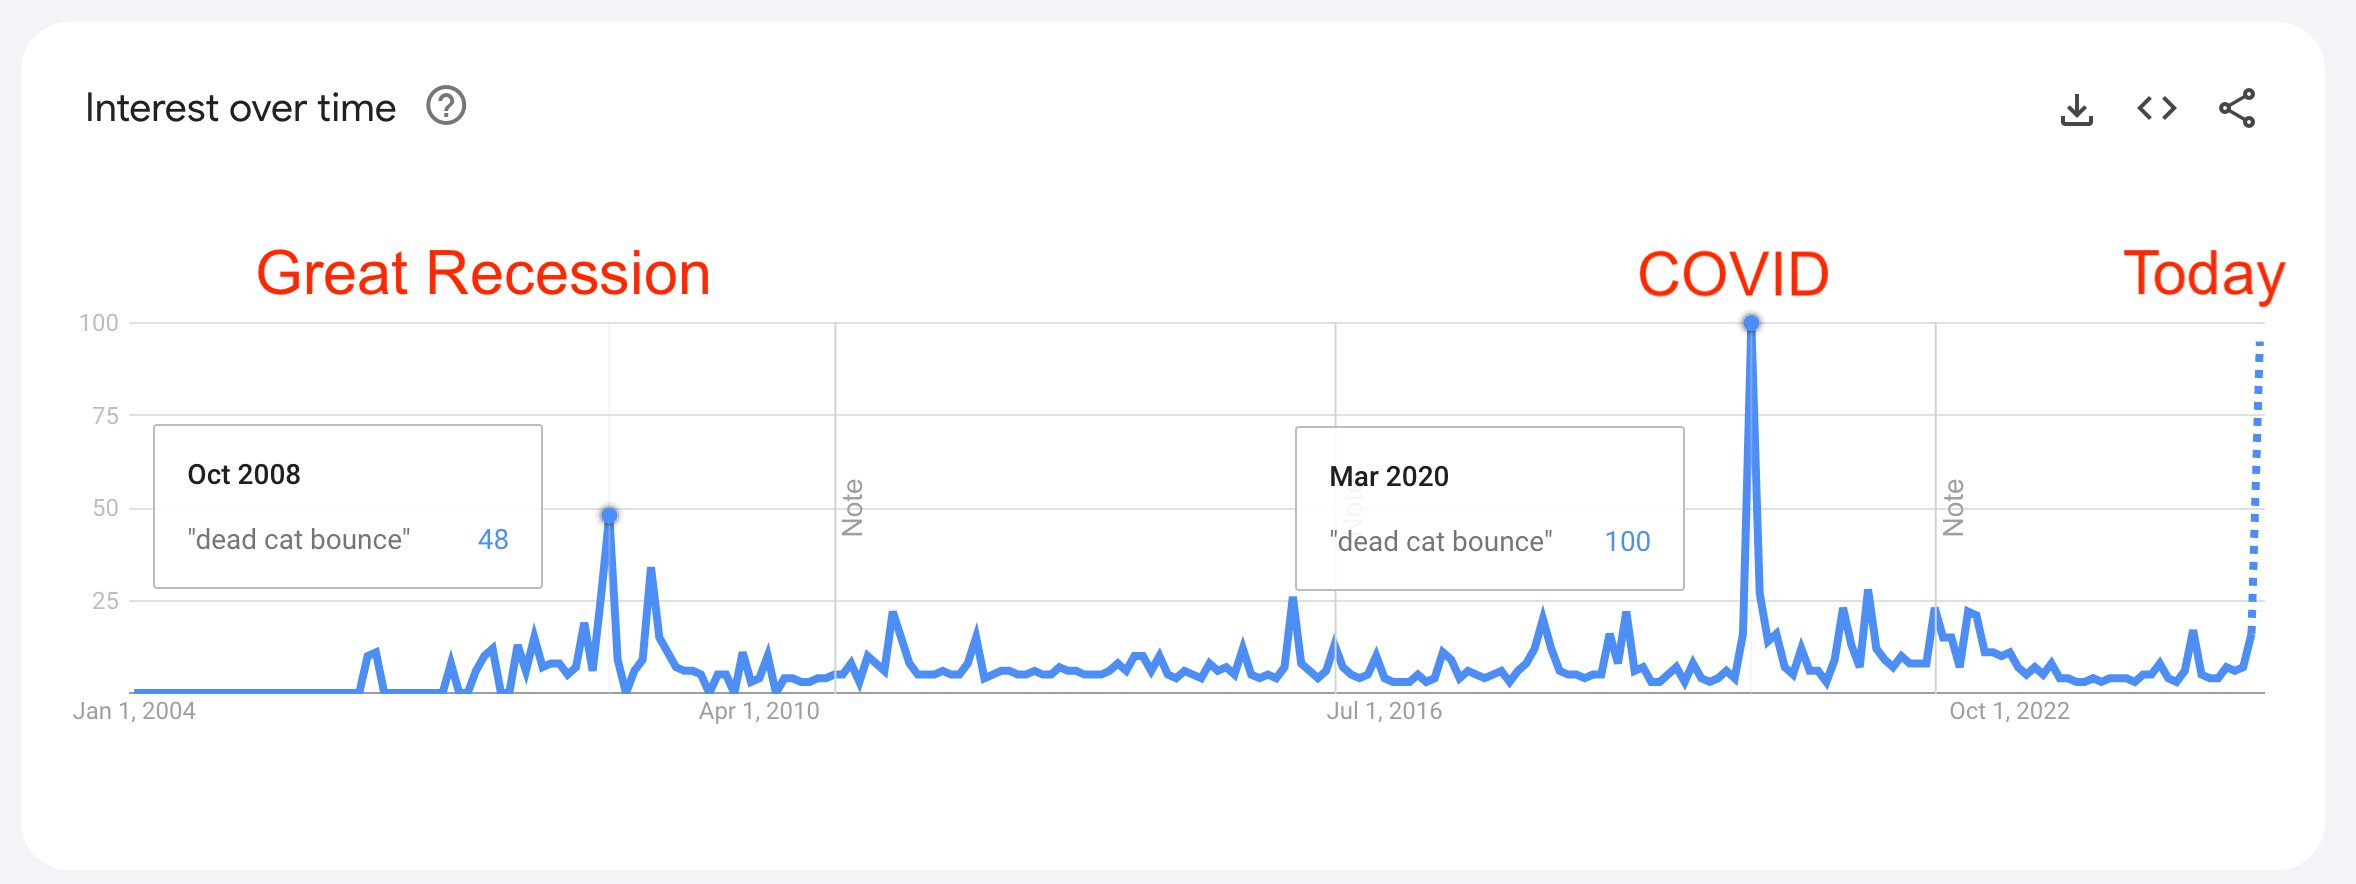
During that period, markets like Bitcoin and stocks staged a V-shaped recovery fueled by quantitative easing (QE). BeInCrypto reported that this time, there is increased speculation that the Fed might return to QE in response to rising market volatility and financial instability.
If QE is revived, it could have a major impact on financial markets, including cryptocurrencies. The sector could see a strong rebound similar to past QE periods. Previously, Arthur Hayes, former CEO of BitMEX, predicted that Bitcoin could surge to $250,000 by the end of 2025 if this materializes.
Disclaimer
In adherence to the Trust Project guidelines, BeInCrypto is committed to unbiased, transparent reporting. This news article aims to provide accurate, timely information. However, readers are advised to verify facts independently and consult with a professional before making any decisions based on this content. Please note that our Terms and Conditions, Privacy Policy, and Disclaimers have been updated.
Ethereum (ETH), the second-largest cryptocurrency by market capitalization, has faced significant price challenges this year, drawing sharp criticism from the community. It has been battered by escalating geopolitical tensions and broader market uncertainty.
Yet, market watchers believe that a recovery could be on the horizon. They point to several catalysts that may drive the price momentum starting now.
Will Ethereum’s Price Recover? Experts Weigh In
Analyst Ted Pillows recently highlighted a series of major events scheduled for May 2025 that could drive Ethereum’s price upward, including a surge in tokenization. In a post on X (formerly Twitter), Pillows drew attention to the Pectra upgrade, expected on May 7. This upgrade introduces several major enhancements to staking, deposit processing, blob capacity, account abstraction, and more.
Moreover, he pointed to the likely introduction of ETH-staking exchange-traded funds (ETFs). Since the introduction of spot ETH ETFs last year, their performance has been underwhelming compared to spot Bitcoin (BTC) ETFs.
In fact, many believe that the lack of staking yields in Ethereum ETFs is hindering their growth. Nonetheless, this may change soon. In February 2025, Cboe filed a request with the SEC to allow the 21Shares Core Ethereum ETF to stake ETH held by the Trust.
The next month, a similar request for the Fidelity Ethereum Fund followed. In addition, NYSE also filed on behalf of the Bitwise Ethereum ETF in late March.
“Each event could potentially push ETH up by $1,000,” Pillows wrote.
Pillows also noted that Ethereum is currently “the most hated token,” drawing parallels to Solana (SOL) after it crashed to $8. However, his observation isn’t without merit, as community sentiment does reflect substantial pessimism towards the altcoin.
“If you had invested $10,000 in Ethereum 7 years ago.You would still have $10,000 today. Trump you destroyed us man!” a user remarked.
Despite this, many view ETH’s low price as a favorable time to buy in. According to an analyst, ETH is currently undervalued. He emphasized that its market price has dropped below the realized price for the first time since 2020.
“Generational ETH buy opportunity!” the analyst claimed.
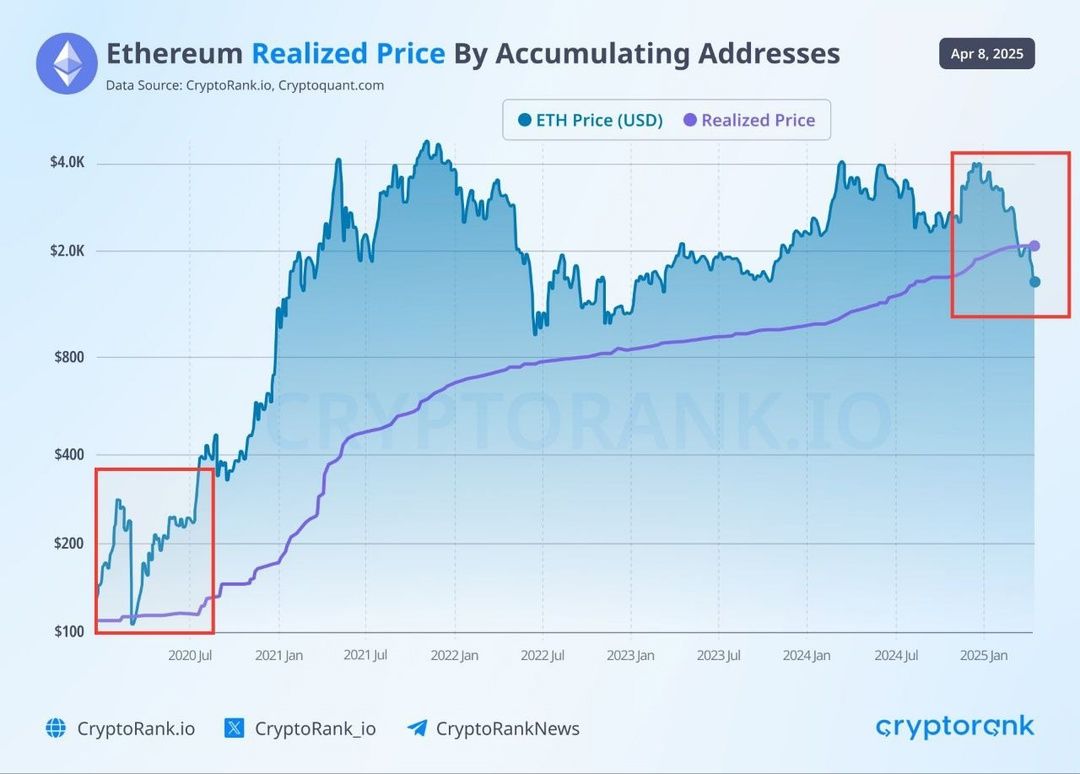
BeInCrypto’s latest analysis corroborated ETH’s undervalued state, as evidenced by the MVRV Ratio’s position in the “opportunity zone.”
Notably, optimism has arisen amid ETH’s recent recovery. Following the SEC’s approval of options trading on BlackRock’s iShares Ethereum ETF (ETHA), the altcoin saw a positive price uptick.
Moreover, President Trump’s decision to pause nearly all tariffs for 90 days also led to a broader market recovery. That’s not all. Trump further boosted market sentiment by declaring,
“This is a great time to buy!”

As a result, ETH surged by double digits over the past day. At press time, it was trading at $1,613, reflecting a 13.7% rise.
Disclaimer
In adherence to the Trust Project guidelines, BeInCrypto is committed to unbiased, transparent reporting. This news article aims to provide accurate, timely information. However, readers are advised to verify facts independently and consult with a professional before making any decisions based on this content. Please note that our Terms and Conditions, Privacy Policy, and Disclaimers have been updated.

RSR Price Climbs 22% After Paul Atkins Gets Named SEC Chair

Is Trump’s Tariff Delay Masking a Crypto Dead Cat Bounce?

Blockchain in the Ballot Box? NY Assembly Considers Tech to Fight Election Fraud

Experts Reveal What Could Drive Ethereum’s Price Recovery

Most Altcoins Now In ‘Opportunity’ Zone, Santiment Reveals

THORWallet CEO Explains Why DeFi is Here to Stay

2.52 Million Altcoins Are Ruining Crypto’s Future

Animoca Brands Valuation Tanks 75% In Two Years, Here’s Why

Crypto exchange BingX hacked for $43 million

Are The Big Players Losing Interest?

Hong Kong’s Securities Association Tips Authorities On Crypto Self-Regulation

Coinbase cbBTC Set to go Live on Solana
2.52 Million Altcoins Are Ruining Crypto’s Future
Animoca Brands Valuation Tanks 75% In Two Years, Here’s Why
Crypto exchange BingX hacked for $43 million
Are The Big Players Losing Interest?
Hong Kong’s Securities Association Tips Authorities On Crypto Self-Regulation
Coinbase cbBTC Set to go Live on Solana
-

 Altcoin14 hours ago
NFT Drama Ends For Shaquille O’Neal With Hefty $11 Million Settlement
-
 Bitcoin10 hours ago
MicroStrategy Bitcoin Dump Rumors Circulate After SEC Filing
-

 Market22 hours ago
How Ripple’s $1.25 Billion Deal Could Surge XRP Demand
-
 Altcoin21 hours ago
Pepe Coin Whales Offload Over 1 Trillion PEPE
-

 Bitcoin19 hours ago
Will the Corporate Bitcoin Accumulation Trend Continue in 2025?
-
 Market19 hours ago
Paul Atkins SEC Confirmation Vote
-

 Bitcoin23 hours ago
Why Bitcoin’s Value Could Benefit from Trade War, Analyst Explains
-

 Bitcoin22 hours ago
Goldman Sachs Raises US Recession Odds to 45%