
Ethereum
Analyst Says Ethereum Flippening Bitcoin Is Only A Matter Of Time: Here’s Why

In 2017-2018, the debate was whether Tron would surpass Ethereum to second place. But, looking at how things have evolved, the debate has been settled.
Ethereum is the most dominant smart contracts platform. However, this has not prevented analysts from comparing Bitcoin and the world’s most valuable altcoin.
Will ETH Finally Flip BTC?
Taking to X, one user claims that Ethereum only needs time to flip Bitcoin as the crypto leader. Citing multiple factors, the analyst said Ethereum is better placed to take over from the first cryptocurrency, pointing to, among others, the larger user base and the benefits smart contracts bring to the equation.
Looking at CoinMarketCap data, Bitcoin has a market cap of over $1.3 trillion, with each coin trading for over $68,000 at spot rates when writing on May 28. Meanwhile, Ethereum is perched at second.
Although it has been one of the top performers in the last week, stretching gains versus Bitcoin, each coin is changing hands for over $3,800. It has a market cap of over $465 billion at this level.
Comparing the two, Bitcoin is roughly three times more valuable than Ethereum. Even with the larger market cap, derived from its first mover advantage, one analyst thinks Ethereum is superior.
For instance, the observer said Ethereum has a significantly larger user base than Bitcoin. The broader user base is because developers can launch protocols on the platform. Some of the most popular ones, like Uniswap and Aave, generate more daily fees than Bitcoin.
Besides this, the analyst said Ethereum serves as a store of value and a medium of exchange. These features give it more edge than Bitcoin, which purely exists as a transactional layer for moving value trustlessly and cheaply across borders.
From an infrastructure perspective, the analyst argues that being an Ethereum validator is easier than running a Bitcoin mining rig. Over 1.9 million Ethereum validators have staked at least 32 ETH for a chance to validate a block of transactions and earn rewards. On the other hand, Bitcoin mining requires specialized hardware. Mining rigs are usually expensive and scarce.
Spot Ethereum ETF Listings Approval And The Security Question
While the United States Securities and Exchange Commission’s (SEC) decision to approve spot Ethereum exchange-traded fund (ETF) listing is bullish, whether ETH is a security or a commodity remains to be clarified. Bitcoin, by comparison, enjoys a clearer designation as a commodity.
The United States SEC has not explicitly declared ETH a security. However, ConsenSys recently sued the agency, claiming they considered ETH a security internally. There is a clash since the Commodity Futures Trading Commission (CFTC), a sister agency to the SEC, categorizes ETH as a commodity.
Even as the debate rages on, analysts claim it would be endorsing ETH as a commodity if the commission approves form S-1 for registration.
Feature image from Canva, chart from TradingView


A quant has revealed how Ethereum (ETH) saw a death cross in this indicator shortly before bearish momentum took the asset in full force.
Ethereum Formed A Death Cross In Funding Rates Earlier
In a CryptoQuant Quicktake post, an analyst has shared a chart for the Funding Rates of Ethereum. The “Funding Rates” refers to a metric that keeps track of the amount of periodic fee that traders on the derivatives market are exchanging between each other right now.
When the value of this indicator is positive, it means the long contract holders are paying a premium to the short investors in order to hold onto their positions. Such a trend suggests a bullish sentiment is shared by the majority of the derivatives traders.
On the other hand, the metric being under the zero mark implies a bearish mentality is dominant in the sector, as short holders are overwhelming the long ones.
Now, here is the chart for the Ethereum Funding Rates posted by the quant, which shows the trend in the 50-day and 200-day simple moving averages (SMAs) of the indicator over the last couple of years:

Looks like these two lines saw a crossover earlier in the year | Source: CryptoQuant
As displayed in the above graph, the 50-day SMA of the Ethereum Funding Rates crossed under the 200-day SMA in January of this year. This suggests that the optimism in the market witnessed a shift.
From the graph, it’s visible that since the crossover in the two SMAs of the indicator has emerged, the ETH price has been sharply moving down. The trend isn’t unique to the asset, as the wider cryptocurrency sector has also seen a similar pattern, with investors becoming risk-averse.
In the first half of last year, the Funding Rates observed the same type of crossover, and then, the Ethereum price followed up with a period of bearish action.
It wasn’t until the reverse crossover happened, with the 50-day SMA finding a break above the 200-day SMA, that bullish momentum returned in the cryptocurrency market. The same pattern was also seen back in 2023.
It’s possible that for constructive price action to return for Ethereum and other assets, a bullish crossover in the Funding Rates may once again have to take place. “When the speculators return and start using their greedy leverage, the crypto bull market will begin,” notes the analyst.
When this would happen, however, is anyone’s guess, as the 50-day and 200-day SMAs of the indicator are currently quite far apart. In 2024, the lines took many months before they crossed back, so it’s possible that it will take some time for the crossover to occur now as well.
ETH Price
Ethereum is moving to end the month of March on a red note as its price has fallen to the $1,800 level, after seeing a decline of almost 14% in the past week.
The trend in the ETH price over the last five days | Source: ETHUSDT on TradingView
Featured image from Dall-E, CryptoQuant.com, chart from TradingView.com
Editorial Process for bitcoinist is centered on delivering thoroughly researched, accurate, and unbiased content. We uphold strict sourcing standards, and each page undergoes diligent review by our team of top technology experts and seasoned editors. This process ensures the integrity, relevance, and value of our content for our readers.

Comparing current price action with past performances, Ethereum, the second-largest crypto asset, seems to have witnessed its worst-ever first quarter as it draws closer to its end. However, many investors are expressing interest in ETH’s prospects again, purchasing the asset in huge chunks.
Investors Buying The Ethereum’s Price Dip
Ethereum has continued to struggle to undergo a major upward move even as other digital assets make history in the ongoing market cycle. Despite the recent pullback in ETH’s price, Ali Martinez, a seasoned crypto analyst and trader, has highlighted a renewed bullish sentiment among investors.
Specifically, investors are seizing the opportunity to stack up on ETH in light of ongoing price correction, signaling interest and confidence in the asset’s long-term potential. This buying activity suggests that seasoned traders are considering the current drop as a strategic entry or buying point.
According to Ali Martinez, the development was spotted as Ethereum encountered a significant resistance wall between the $2,200 and $2,580 price mark. Examining the data from IntoTheBlock, the expert reported that over 12.43 million investors purchased a massive portion of 66.18 million ETH within the $2,200 and $2,580 price zones.
These kinds of accumulation show that both retail and institutional investors are hopeful about the market. Should this substantial buying activity extend, Ali Martinez is confident that bullish momentum might build up for ETH, leading to a break above the zone.

Market analyst and trader CryptoELITES predicts a robust upswing for ETH to new all-time highs in the upcoming weeks. CryptoELITES prediction is based on past price trends in which ETH witnessed a massive rally after a lengthy period of downward movements.
Delving into the recent price action, the expert believes ETH’s correction has reached a bottom similar to the 2017 and 2021 bull market cycles. With the altcoin potentially reaching a bottom, CryptoELITES anticipates an over 700% upsurge in 2025.
A 700% surge will bring the altcoin’s price to the $15,000 milestone before the ongoing bull market cycle completes. Given that Ethereum is mirroring past trends, a possible price reversal could be on the horizon.
ETH Eyeing A Breakout From Key Chart Pattern
While ETH is facing volatility, it is presently at a critical junction that might determine its next move. Jonathan Carter, a crypto and technical analyst, reveals that Ethereum is holding above the lower boundary of a Descending Triangle formation after navigating its price in the 4-hour time frame.
At this zone, the asset might muster enough momentum for a rebound. Carter expects a bounce from the current support zone to push ETH toward key resistance levels at $1,950, $2,080, $2,230, and $2,320. However, if the altcoin falls below the support, the price may drop further to the downside.
Featured image from Pexels, chart from Tradingview.com
Editorial Process for bitcoinist is centered on delivering thoroughly researched, accurate, and unbiased content. We uphold strict sourcing standards, and each page undergoes diligent review by our team of top technology experts and seasoned editors. This process ensures the integrity, relevance, and value of our content for our readers.

Reason to trust
![]()
Strict editorial policy that focuses on accuracy, relevance, and impartiality
Created by industry experts and meticulously reviewed
The highest standards in reporting and publishing
Strict editorial policy that focuses on accuracy, relevance, and impartiality
Morbi pretium leo et nisl aliquam mollis. Quisque arcu lorem, ultricies quis pellentesque nec, ullamcorper eu odio.
The Ethereum price has finally broken out of a months-long consolidation pattern, signaling the possible start of a significant bullish move. The recent breakout of an Ascending Triangle formation suggests that ETH is set for more gains, with a crypto analyst suggesting a price target of $7,800 in the coming months.
Ethereum Price Targets $7,700 ATH
The Ethereum price is believed to be targeting a new all-time high of $7,800 after its recent breakout from an Ascending Triangle. For months now, the cryptocurrency has been trading within this classic bullish chart pattern, where prices make higher lows while facing strong resistance at a fixed level.
Related Reading
This consolidation pattern has been active since late 2024, establishing strong resistance at $4,000. TradingView analyst Sohaibfx has predicted that if Ethereum can surpass this resistance level, it would confirm a bullish trend, leading to a strong upward continuation in its price.
Looking at the analyst’s price chart, Ethereum spent several months navigating between $2,000 and $4,000 in Q1 2025. This region represented an accumulation phase where buyers had quietly built their positions in anticipation of a potential rally.
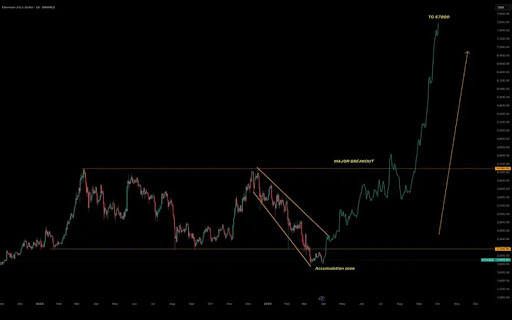
A descending channel marked in orange in the price chart also shows that Ethereum had experienced a significant pullback mid-to-late 2024 before breaking out. This was likely the final shakeout before it regained its bullish momentum.
According to Sohaibfx, a measured move of the Ascending Triangle suggests that Ethereum is poised for an explosive 333% surge to $7,800. This bullish target is calculated by determining the height of the triangle, which is the difference between its base at $2,000 and resistance level at $4,000.
When the price breaks above the resistance, the common method for estimating the possible next move is to add the triangle’s height to the breakout point, which gives a technical target of $6,000. However, based on past price behaviour and strong buying momentum, the Ethereum price could push even higher, with $7,800 being a key psychological level.
Support Levels And Momentum Indicators To Watch
In his price analysis, Sohaibfx has pinpointed the $4,000 and $3,000 price levels as support levels for Ethereum. This support should act as a safety net, where buyers are likely to step in to prevent further decline after Ethereum reaches its projected $7,800 target.
Related Reading
Moving forward, the analyst highlights key momentum indicators that should be monitored. While the analyst’s chart does not specify indicators like Moving Average Convergence Divergence (MACD) or Relative Strength Index (RSI), Ethereum’s sharp upward move suggests that strong momentum will be a major contributor to its rise to a new ATH.
Sohaibfx has advised traders to watch out for RSI levels above 70, as overbought conditions could signal a potential pullback while Ethereum approaches higher levels.
Featured image from Adobe Stock, chart from Tradingview.com

Hedera (HBAR) Bears Dominate, HBAR Eyes Key $0.15 Level

Charles Hoskinson Reveals How Cardano Will Boost Bitcoin’s Adoption

Coinbase Tries to Resume Lawsuit Against the FDIC

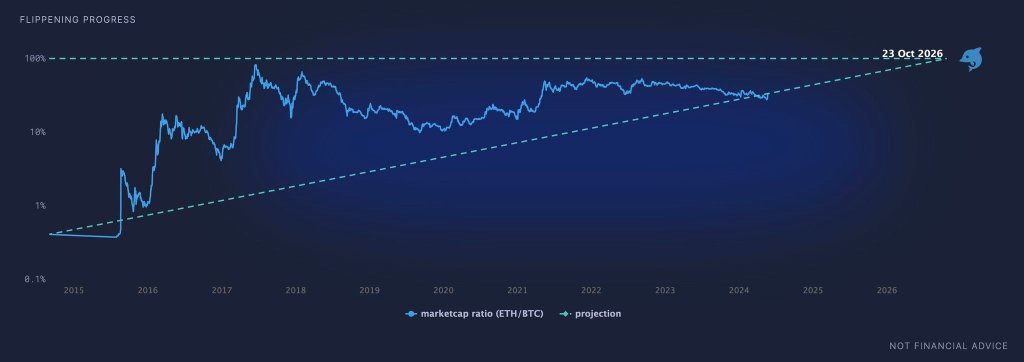
Ethereum Bitcoin Ratio Drops to Record Low, What Next for ETH?

BlackRock’s Larry Fink Thinks Crypto Could Harm The Dollar

Ethereum May Have To Undo This Death Cross For Bull’s Return

2.52 Million Altcoins Are Ruining Crypto’s Future

Animoca Brands Valuation Tanks 75% In Two Years, Here’s Why

Crypto exchange BingX hacked for $43 million

Are The Big Players Losing Interest?

Hong Kong’s Securities Association Tips Authorities On Crypto Self-Regulation

Coinbase cbBTC Set to go Live on Solana
2.52 Million Altcoins Are Ruining Crypto’s Future
Animoca Brands Valuation Tanks 75% In Two Years, Here’s Why
Crypto exchange BingX hacked for $43 million
Are The Big Players Losing Interest?
Hong Kong’s Securities Association Tips Authorities On Crypto Self-Regulation
Coinbase cbBTC Set to go Live on Solana
-

 Market20 hours ago
Bitcoin Bears Tighten Grip—Where’s the Next Support?
-

 Market19 hours ago
Ethereum Price Weakens—Can Bulls Prevent a Major Breakdown?
-
 Altcoin24 hours ago
Cardano Price Eyes Massive Pump In May Following Cyclical Patern From 2024
-
 Market12 hours ago
Strategic Move for Trump Family in Crypto
-

 Market7 hours ago
BNB Breaks Below $605 As Bullish Momentum Fades – What’s Next?
-

 Market11 hours ago
Top Crypto Airdrops to Watch in the First Week of April
-
 Market6 hours ago
Trump Family Gets Most WLFI Revenue, Causing Corruption Fears
-
 Altcoin10 hours ago
$33 Million Inflows Signal Market Bounce