
Market
Will It Break Out Soon?

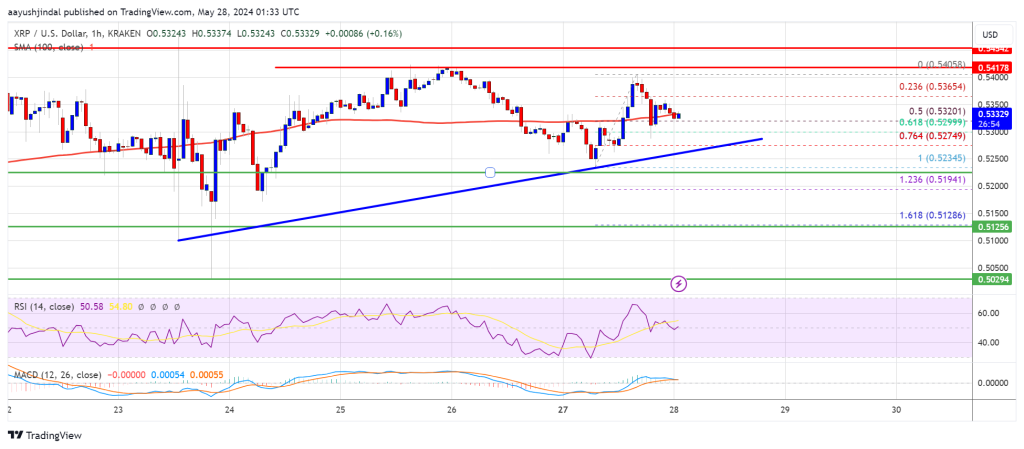
XRP price again struggled to continue higher above the $0.540 resistance. It is now consolidating near $0.5320 and might aim for an upside break.
- XRP is still facing many hurdles near the $0.5420 zone.
- The price is now trading near $0.5320 and the 100-hourly Simple Moving Average.
- There is a connecting bullish trend line forming with support near $0.5265 on the hourly chart of the XRP/USD pair (data source from Kraken).
- The pair could start a fresh increase if the bulls remain active above the $0.5220 zone.
XRP Price Holds Support
In the past few sessions, XRP price traded in a positive zone like Bitcoin and Ethereum. However, the bears were active near the $0.540 and $0.5420 resistance levels.
The recent high was formed at $0.5405 and the price is now correcting gains in a range. There was a move below the $0.5340 support zone and the price spiked below the 50% Fib retracement level of the upward move from the $0.5234 swing low to the $0.5405 high.
However, the bulls are active near the $0.530 zone and the 61.8% Fib retracement level of the upward move from the $0.5234 swing low to the $0.5405 high. There is also a connecting bullish trend line forming with support near $0.5265 on the hourly chart of the XRP/USD pair.
The pair is now trading near $0.5320 and the 100-hourly Simple Moving Average. Immediate resistance is near the $0.5365 level. The first key resistance is near $0.5420. A close above the $0.5420 resistance zone could send the price higher. The next key resistance is near $0.5450.
If there is a close above the $0.5450 resistance level, there could be a steady increase toward the $0.5550 resistance. Any more gains might send the price toward the $0.5720 resistance.
More Downsides?
If XRP fails to clear the $0.5420 resistance zone, it could continue to move down. Initial support on the downside is near the $0.5265 level and the trend line.
The next major support is at $0.520. If there is a downside break and a close below the $0.520 level, the price might gain bearish momentum. In the stated case, the price could decline and retest the $0.5120 support in the near term.
Technical Indicators
Hourly MACD – The MACD for XRP/USD is now losing pace in the bullish zone.
Hourly RSI (Relative Strength Index) – The RSI for XRP/USD is now above the 50 level.
Major Support Levels – $0.5300 and $0.5200.
Major Resistance Levels – $0.5365 and $0.5420.


Sui, a Layer-1 network, announced a new partnership with investment firm Franklin Templeton. This partnership includes capital investment in Sui and support for the firm’s blockchain development.
Despite a few vague details, the exact nature of the working relationship between the two companies remains unclear.
Sui Partners Franklin Templeton
Sui, the prominent Layer-1 blockchain, recently partnered with investment firm Franklin Templeton. This partnership will prioritize supporting a developer ecosystem rather than focusing directly on SUI development. The firm claimed Franklin Templeton has been supporting blockchain projects since 2018, and its CEO has espoused blockchain technology.
“Franklin Templeton Digital Assets has previously invested in the Sui ecosystem, and this new partnership will provide further benefit by seeking value creation opportunities to allow Sui builders to deploy novel technology onchain,” Sui claimed in a social media post.
As of yet, the firm has publicly revealed very few exact details about the partnership’s planned blockchain developments. Instead, the firm discussed several of its existing projects that attracted Franklin Templeton’s attention: its DeFi central limit order book, a decentralized mobile carrier, and an MPC network.
Still, this information does provide a few clues about the investment firm’s intentions. Earlier this year, Franklin Templeton explored DePin projects, considering them a possible lucrative development area. The firm has also been investing heavily in tokenization. It may help Sui by supporting its blockchain developers in these areas, especially DePin.
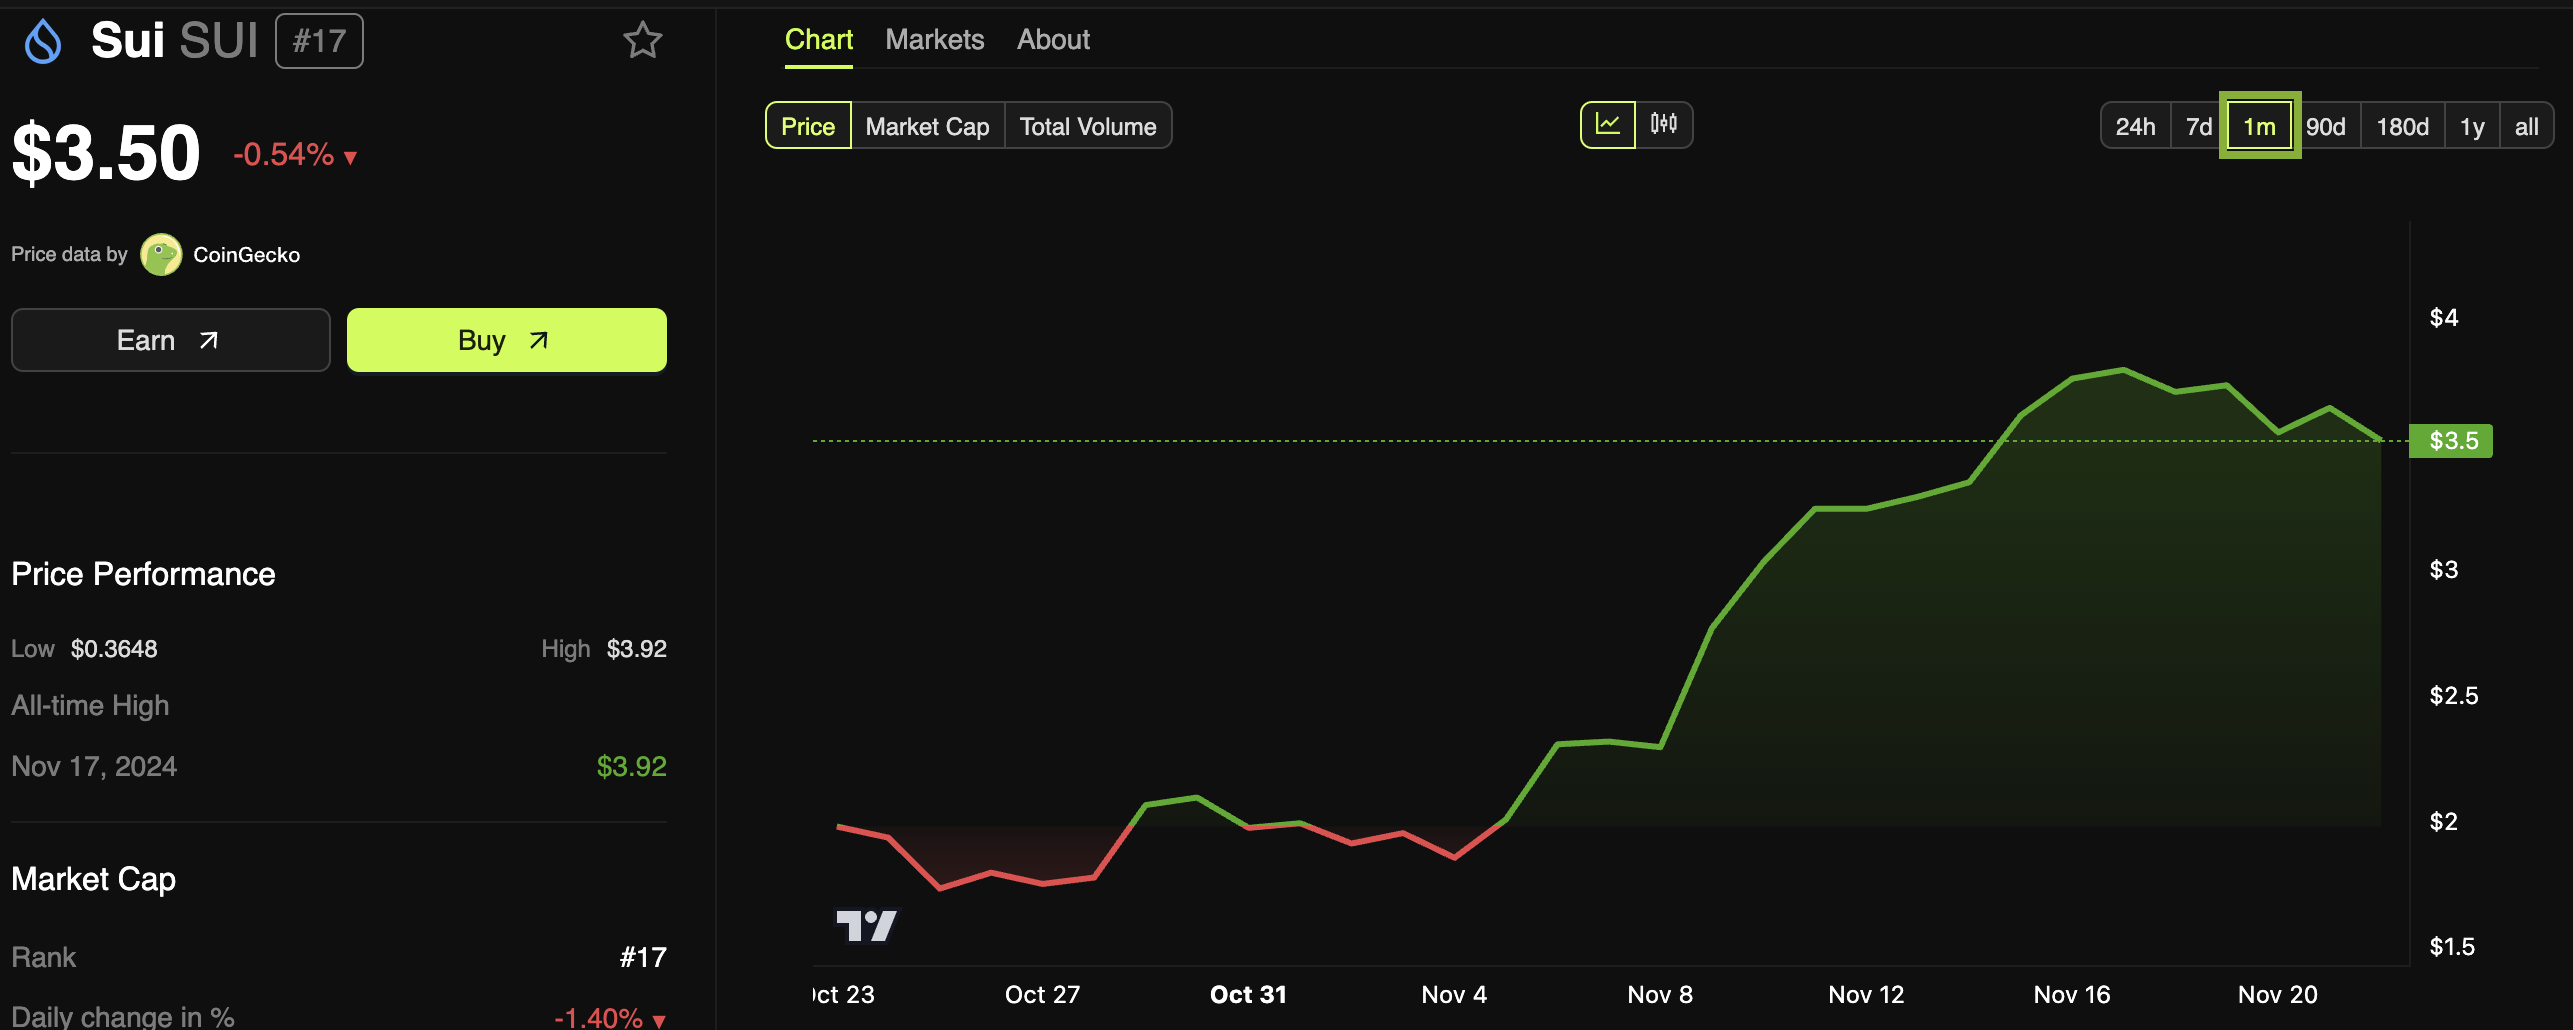
Sui, for its part, is performing quite well lately. It recently went on a remarkable bull run, climbing 74% in one month before hitting an all-time high on November 20. Yesterday, its blockchain stopped producing blocks for nearly two hours, but its token price remained impressively steady. These fundamentals could make Sui an attractive partner for Franklin Templeton.
Franklin Templeton has not yet made any direct announcements about this partnership. Sui additionally posted a more developed press release, but it did not have substantially different information than the talking points in its main announcement. Suffice it to say that Franklin Templeton is investing in Sui blockchain development.
Disclaimer
In adherence to the Trust Project guidelines, BeInCrypto is committed to unbiased, transparent reporting. This news article aims to provide accurate, timely information. However, readers are advised to verify facts independently and consult with a professional before making any decisions based on this content. Please note that our Terms and Conditions, Privacy Policy, and Disclaimers have been updated.

Several altcoins are trending today for various reasons. CoinGecko data shows that all these cryptocurrencies share one thing in common: their prices have risen in the last 24 hours.
This notable hike could be linked to broader market recovery. That said, the top three altcoins trending today are Mythos (MYTH), MAD (MAD), and Mode (MODE).
Mythos (MYTH)
Mythos tops the list of trending altcoins today, specifically due to its 45% price increase in the last seven days. As a project built on the Ethereum blockchain, MYTH’s price also increased due to the rise in ETH’s value.
As of this writing, MYTH’s price is $0.27 but has encountered resistance around the same area. However, the Awesome Oscillator (AO), which measures momentum, shows that the sentiment around the altcoin remains bullish.
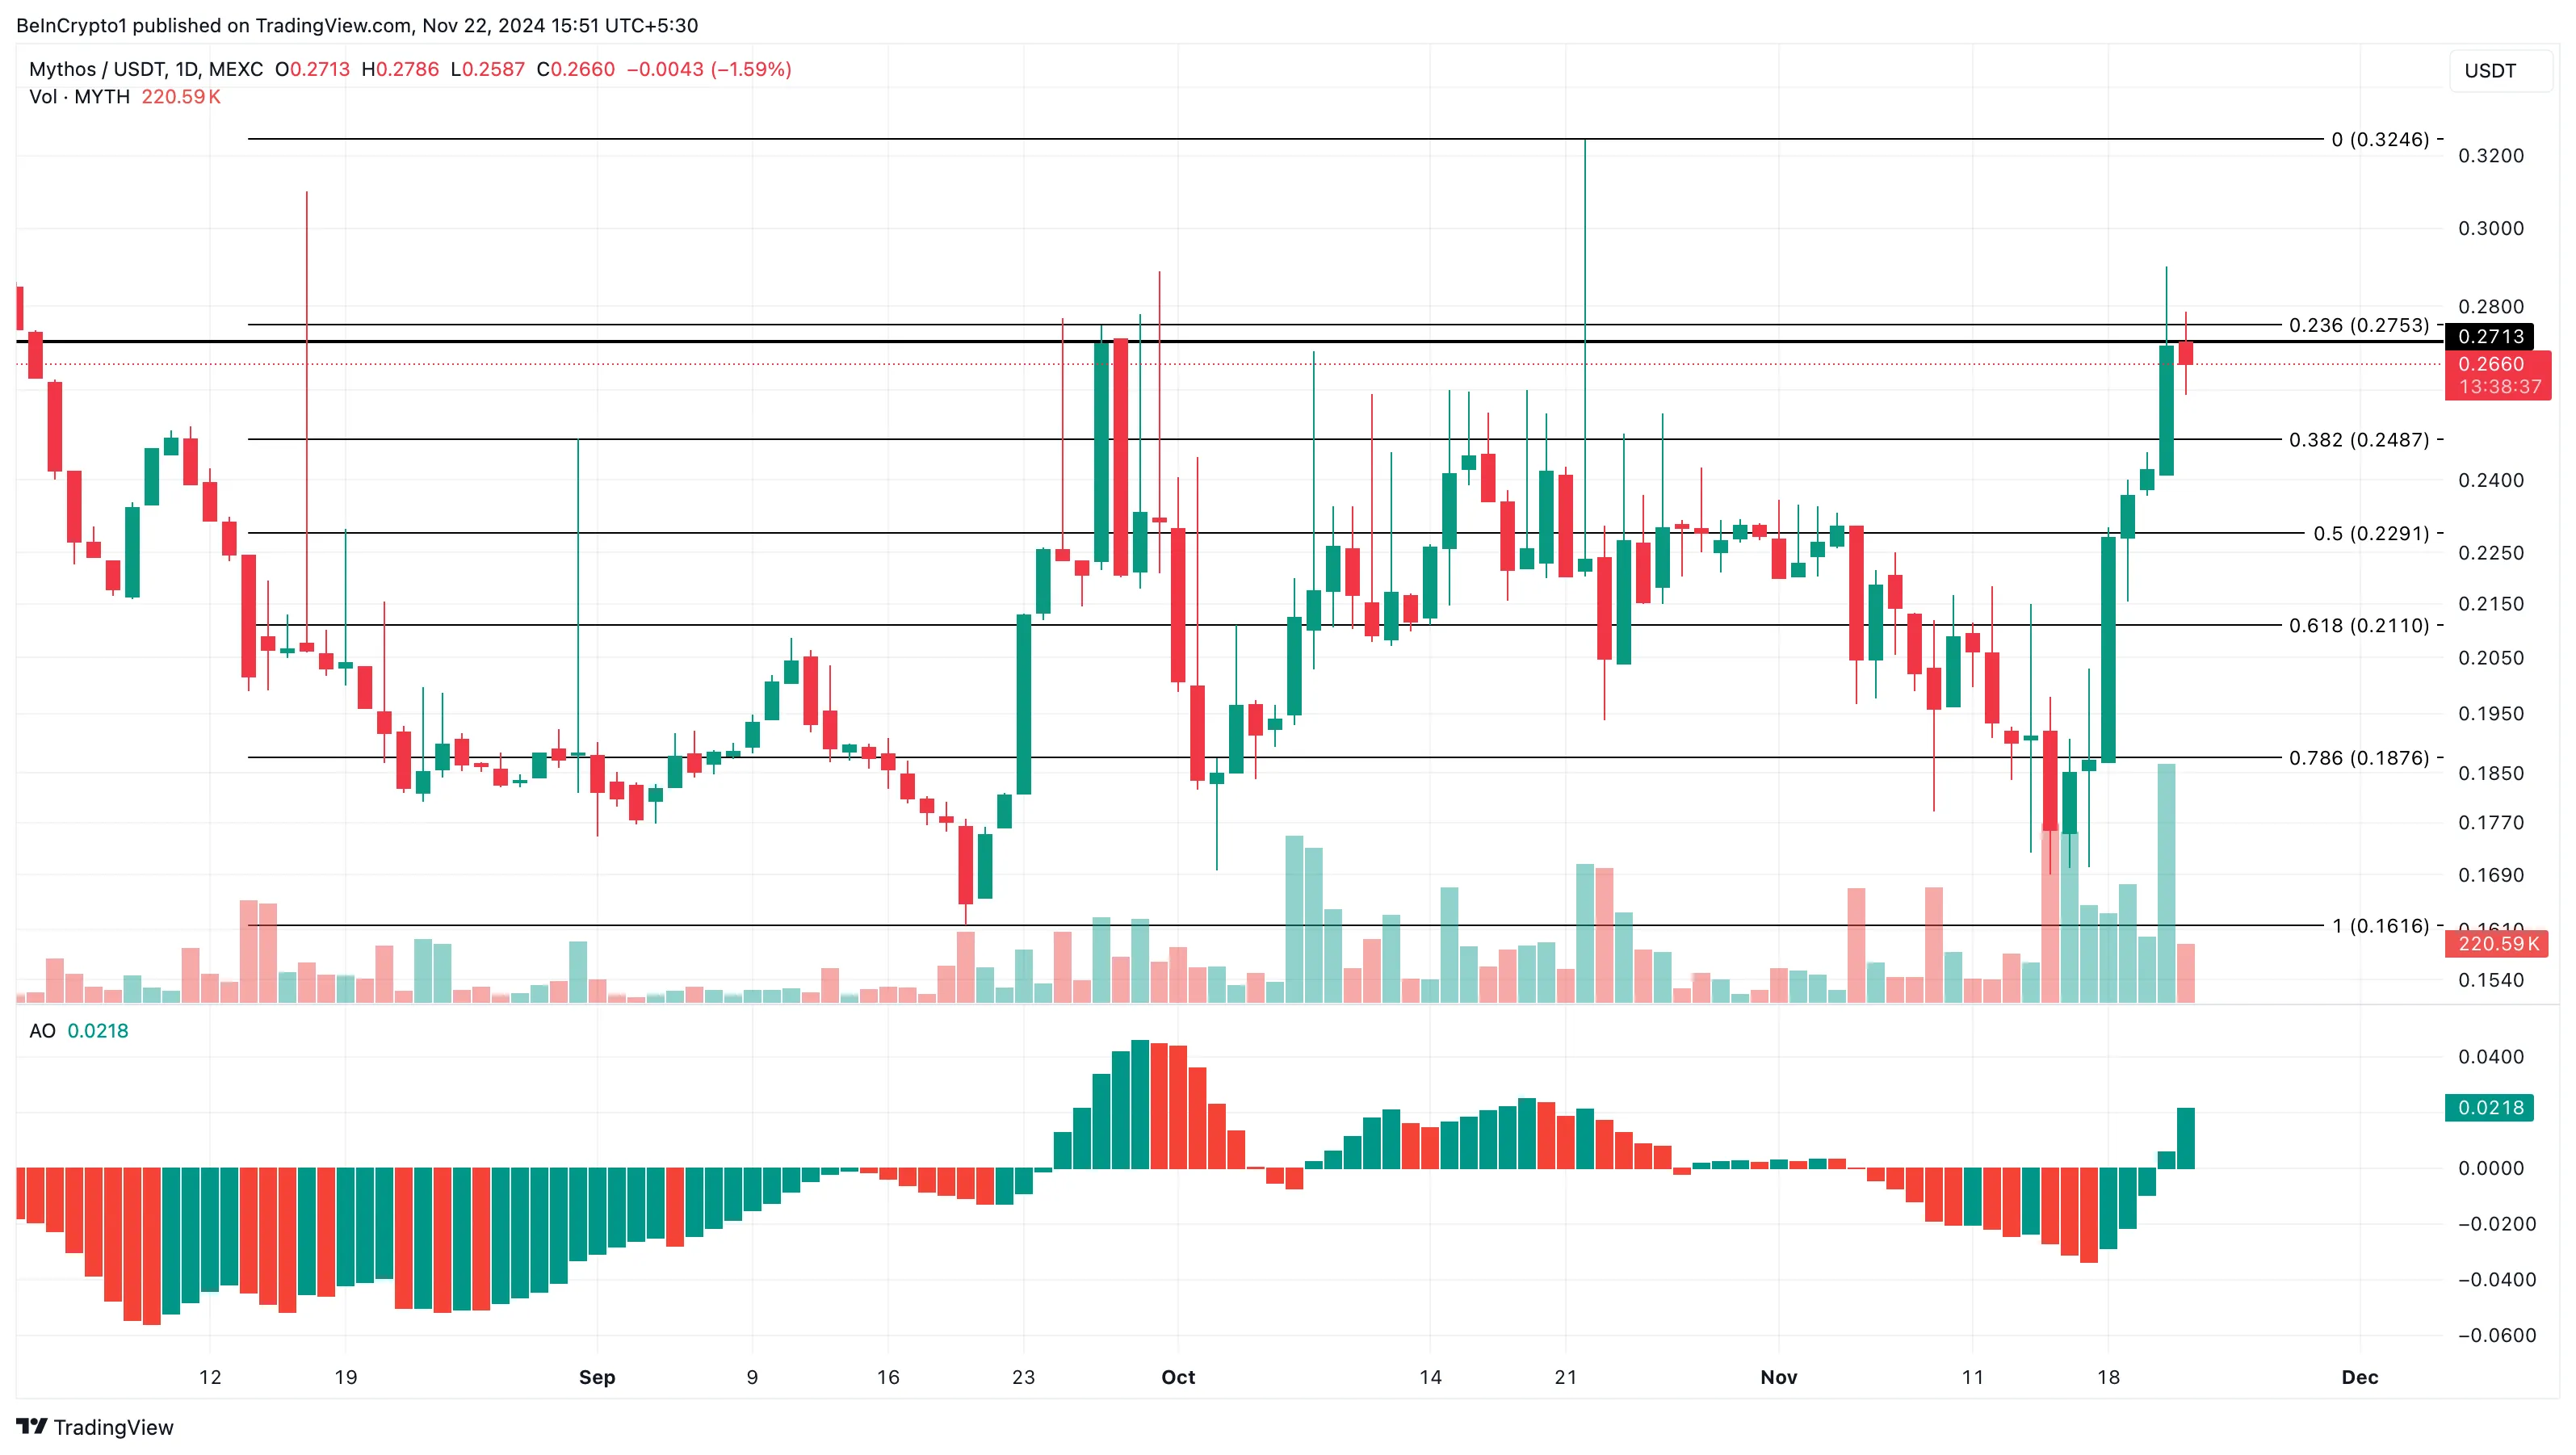
In this scenario, MYTH’s price is likely to bounce toward $0.32. However, if momentum turns bearish and the AO reading drops to the negative area, this might not happen. Should that be the case, the altcoin’s value might decline to $0.21.
MAD (MAD)
Another crypto among the altcoins trending today is MAD, a meme coin built on the Solana blockchain. MAD is trending because its value has spiked by 85% in the last 24 hours and over 600% within the last seven days.
This rise in price could be linked to a surge in buying pressure. From a technical point of view, despite the hike, the Bull Bear Power (BBP), which measures the strength of buyers compared to sellers, reveals that bulls are still in control.
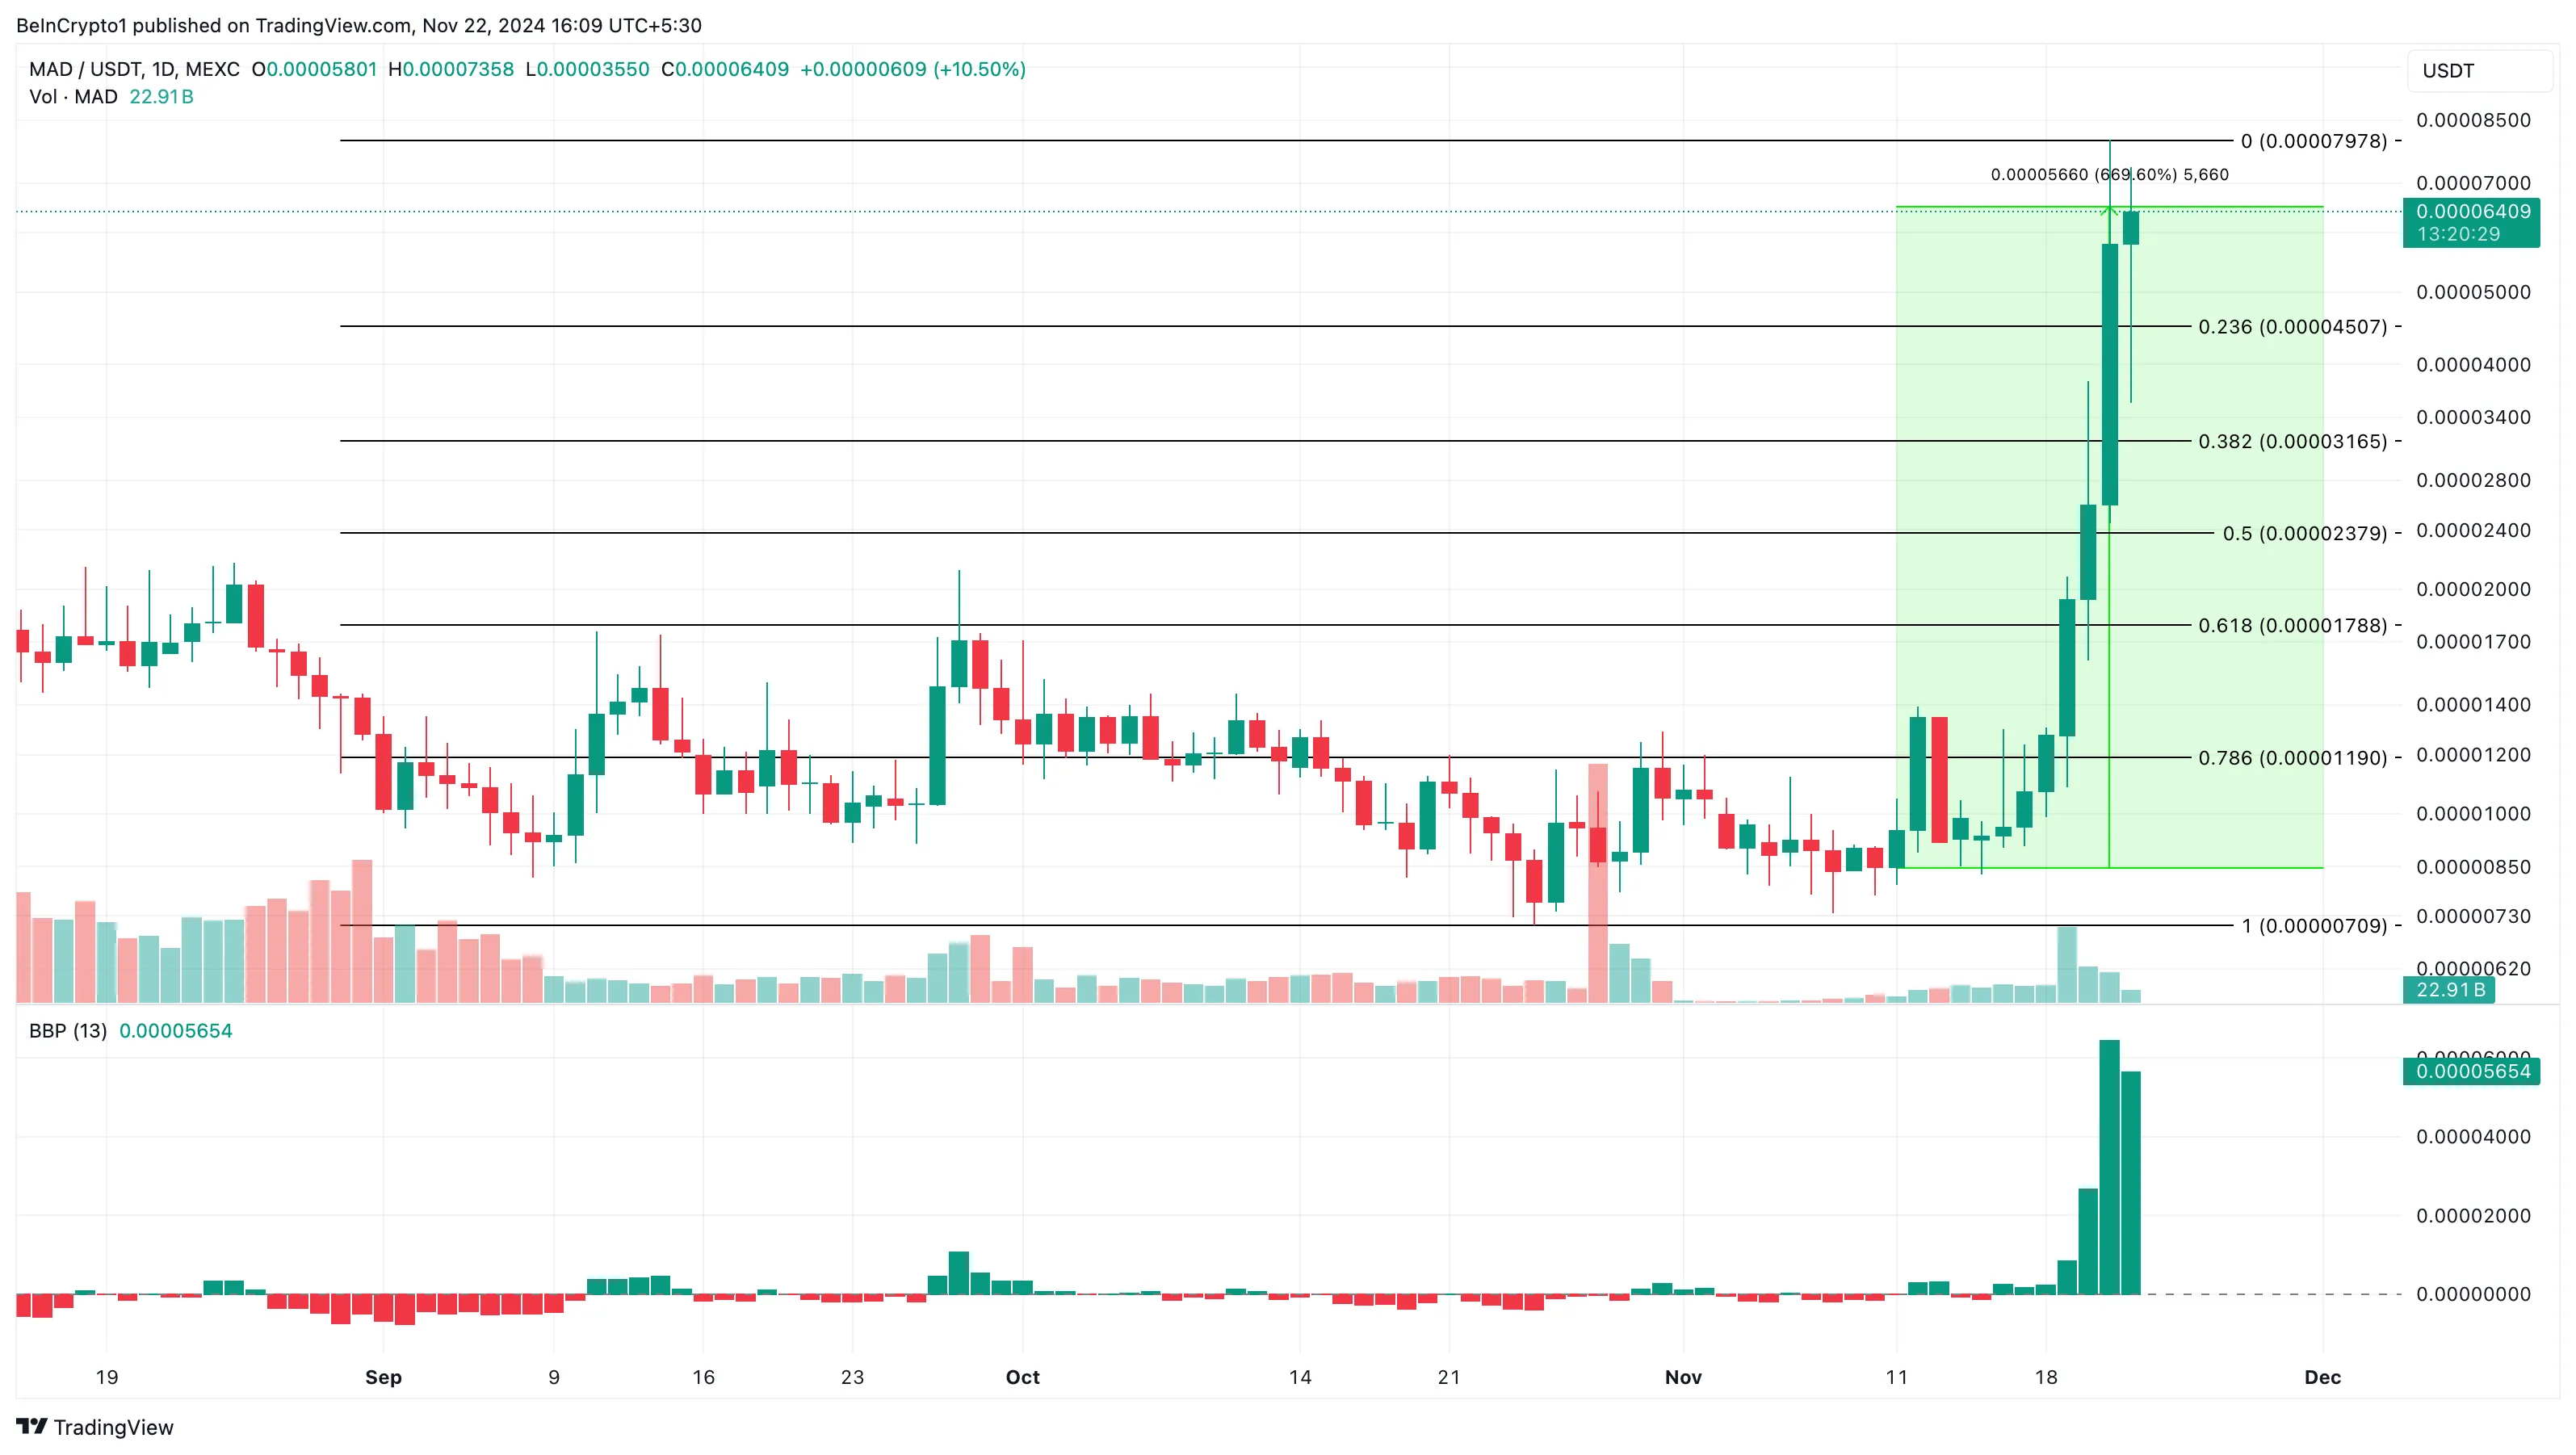
If this continues, MAD’s price could rise to $0.00010. However, if cryptocurrency holders decide to sell in large volumes, this might not happen. Instead, the altcoin’s value could sink to $0.000045.
Mode (MODE)
Like yesterday, Mode is also one of the trending altcoins today. Unlike its price action on November 21, MODE’s price has increased 26.50% in the last 24 hours.
Between August and the first few days of this month, MODE’s price traded within a descending triangle. This bearish pattern ensures that the altcoin value failed to notch a significant hike.
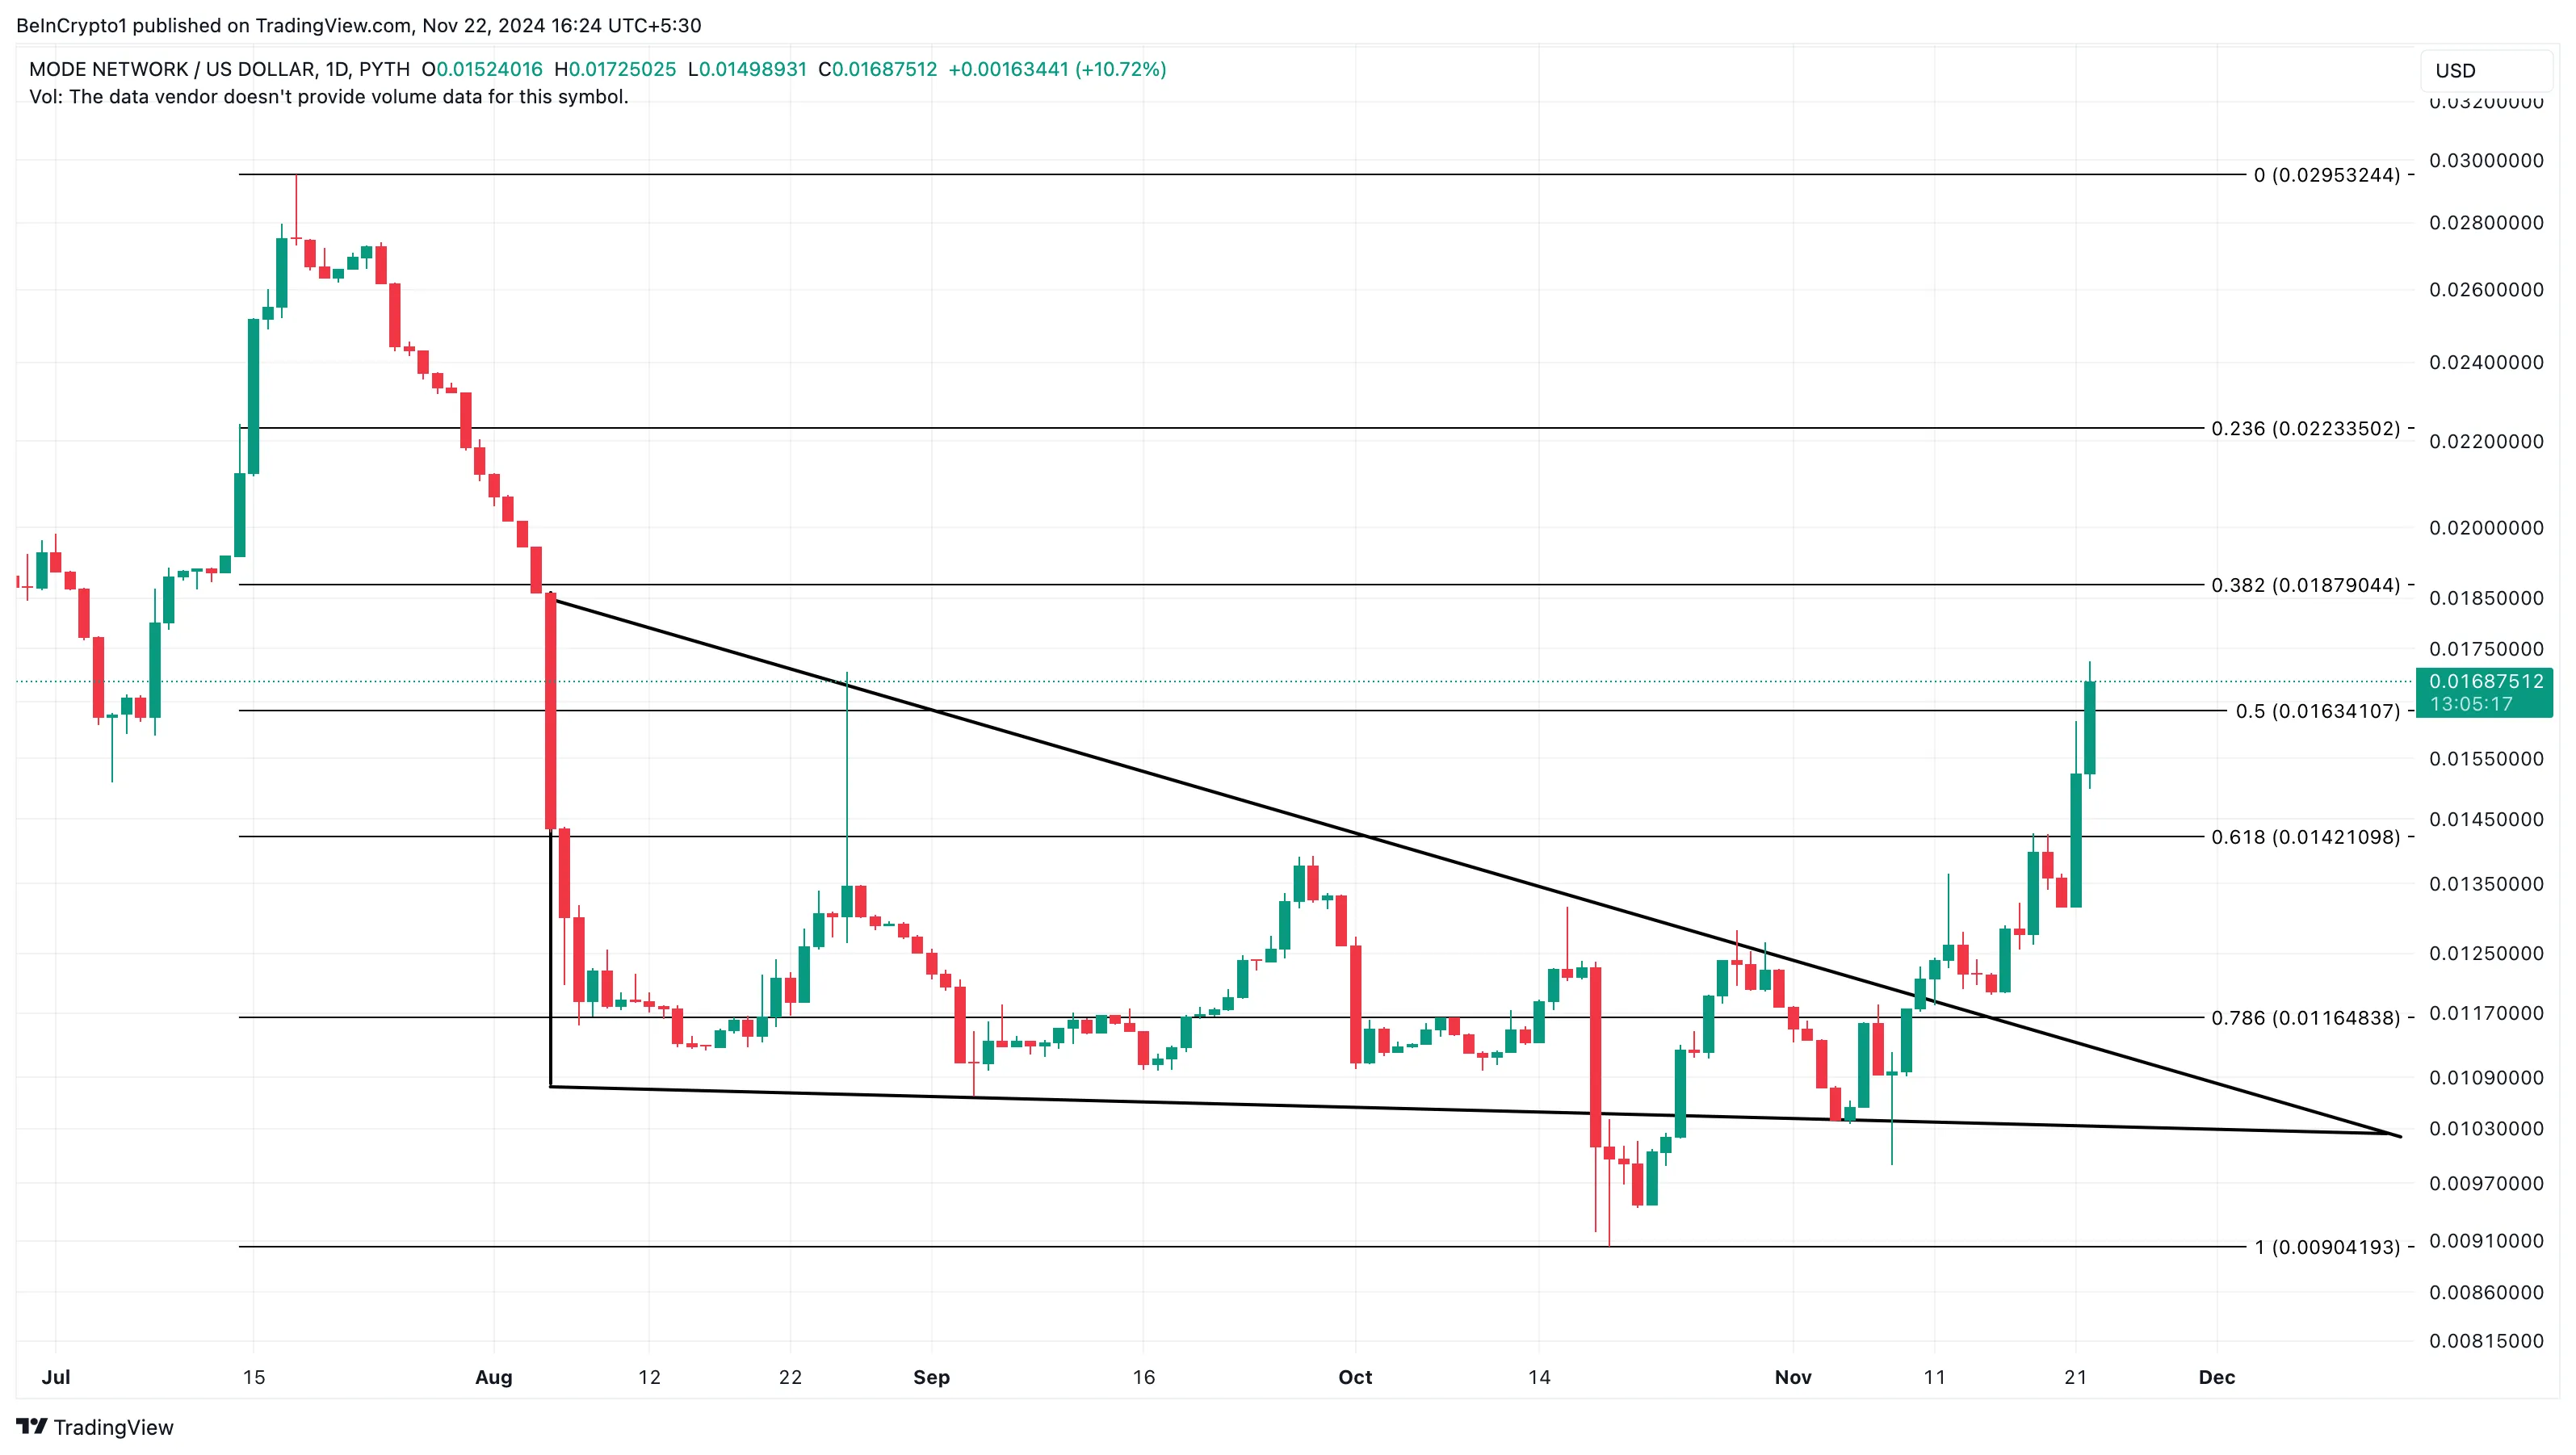
However, at press time, it broke out, as BeInCrypto had predicted earlier. With the current price movement, MODE is likely to raise $0.022 in the short term. But in a scenario where selling pressure rises, that might not happen. Instead, it might drop to $0.012.
Disclaimer
In line with the Trust Project guidelines, this price analysis article is for informational purposes only and should not be considered financial or investment advice. BeInCrypto is committed to accurate, unbiased reporting, but market conditions are subject to change without notice. Always conduct your own research and consult with a professional before making any financial decisions. Please note that our Terms and Conditions, Privacy Policy, and Disclaimers have been updated.


The crypto market recorded several important developments this week, from regulatory advancements to significant legal rulings. Taken together, the highlights display how the global cryptocurrency ecosystem continues to advance.
The following is a roundup of crucial developments that happened this week but will continue shaping the sector.
Gary Gensler’s to Resign as SEC Chair
Gary Gensler, Chair of the US Securities and Exchange Commission (SEC), announced his resignation effective January 2025. The crypto industry had long anticipated his departure, which marks the end of a controversial tenure characterized by a strict approach to digital asset regulation.
“On January 20, 2025, I will be stepping down as SEC Chair,” he shared.
Gensler’s tenure saw multiple enforcement actions against crypto companies, leading to heightened scrutiny of projects like XRP, Solana, Cardano, and others. Against this backdrop, news of his imminent resignation had a notable impact on the cryptocurrency market. XRP, a token at the center of the SEC’s lawsuit against Ripple, and Solana (SOL) experienced significant rallies.
The rallies came as the crypto industry now anticipates a leadership change that could introduce clearer frameworks for digital assets. Gensler’s departure coincides with ongoing calls for balanced regulation, offering hope for less adversarial interactions between regulators and the crypto community.
US Eyes Crypto-Czar Role
The Trump administration is reportedly considering appointing a “crypto-czar” to shape and lead the nation’s approach to digital assets. Chris Giancarlo, the former chair of the Commodity Futures Trading Commission (CFTC), is among those under discussion for the role.
Other considerations include Coinbase CEO Brian Armstrong, who drew significant support from Cardano’s Charles Hoskinson. Similarly, Brian Brooks, former BinanceUS and Coinbase executive, is also on the list of considerations.
Beyond the crypto-czar role, Trump’s social media and technology company is also in talks to purchase crypto exchange Bakkt. The general sentiment is that purchasing Bakkt could bring Trump fresh skin in the game.
Russia’s Crypto Policy Shake-Up
As BeInCrypto reported, Russia has revised its crypto taxation bill, introducing measures to regulate and tax crypto transactions more effectively. The country has also banned crypto mining in occupied Ukrainian territories, citing security concerns.
“Starting Dec 2024, Russia’s Energy Ministry is clamping down on mining rigs in energy-stressed zones like Irkutsk, Chechnya, and DPR. The takeaway’s clear: energy ≠ infinite, and miners might need to get stealthy or pivot,” Mario Nawfal wrote on X (formerly Twitter).
These developments reflect Russia’s dual approach of harnessing crypto’s economic potential while maintaining stringent control over its use. Analysts warn that these policies could stifle innovation while ensuring compliance with state interests.
Bitfinex Hack Case: Couple Sentenced
BeInCrypto also reported on the US legal system’s sentencing of Heather Morgan, the wife of Ilya Lichtenstein, to prison for the infamous 2016 Bitfinex hack. This sentencing came shortly after Lichtenstein’s sentencing to five years in prison.
Morgan and her husband attempted to launder the loot through various means, including buying gold and NFTs. Of note, Lichtenstein’s sentence was far below his potential 20-year maximum, as he also cooperated significantly with the authorities.
These sentences reflect the ongoing efforts to bring crypto-related crimes to justice. It also highlights the importance of strong security and regulatory oversight in the industry. Notwithstanding, the 2016 Bitfinex attack remains one of the largest cryptocurrency thefts in history.
OCC Approves Bitcoin ETF Options Trading
This week, the Options Clearing Corporation (OCC) also approved Bitcoin ETF (exchange-traded funds) options trading. This decision marked a significant regulatory milestone in the US financial markets. This approval enhances market liquidity, providing institutional and retail investors with greater flexibility to hedge risks.
The move is expected to catalyze broader acceptance of Bitcoin ETFs, potentially driving increased trading volumes and market participation. Analysts believe this approval could pave the way for further advancements in Bitcoin-related financial products.
Author of “Softwar” Enters Presidential Race
To add to this list of interesting things that happened in the crypto market this week, Jason Lowery, the author of Softwar, is eyeing a position in the White House. His bid centered on Bitcoin adoption and national security. Lowery advocates for Bitcoin as a strategic asset, reflecting its potential to fortify the US against global economic uncertainties.
His interest reflects the growing intersection of politics and crypto as policymakers recognize Bitcoin’s strategic implications beyond its financial utility.
“I recommend Maj Jason Lowery for presidential advisor on the Advancement of Bitcoin as a National Strategic Asset,” one user on X pushed.
Grayscale’s Bitcoin Covered Call ETF
Further, Grayscale updated its Bitcoin Covered Call ETF, enhancing its utility for investors seeking income generation strategies. The ETF employs options strategies to provide returns, offering a unique way for investors to capitalize on Bitcoin’s volatility.
This product demonstrates the continued innovation in crypto financial instruments, catering to diverse investor needs amidst a fast-paced market.
“Grayscale wasting no time after BTC ETF options approval. They’ve filed an updated prospectus for their Bitcoin Covered Call ETF (no ticker yet). The fund will offer exposure to GBTC and BTC while writing and/or buying options contracts on Bitcoin ETPs for income,” James Seyffart remarked.
China Recognizes Crypto as Property
A landmark legal ruling also passed among top crypto news this week. As it happened, a Chinese court recognized cryptocurrency as legal property. The determination granted protections to crypto holders, with the decision coming amid China’s stringent crypto regulations. It offers a glimmer of hope for crypto enthusiasts in the region.
This ruling could influence future regulatory approaches, balancing state control with individual rights in the digital economy.
Paul Tudor Jones Doubles Down on Bitcoin
Additionally, hedge fund manager Paul Tudor Jones reaffirmed his commitment to Bitcoin this week. Jones revealed a continued stake in Bitcoin, citing the asset’s resilience amid economic uncertainty. The endorsement highlights Bitcoin’s enduring appeal among institutional investors, reinforcing its status as “digital gold” in turbulent financial landscapes.
“Billionaire hedge fund manager Paul Tudor Jones: All roads lead to inflation … I’m long gold, I’m long Bitcoin, I’m long commodities,” Michael Burry said, citing Jones.
His firm, Tudor Investment Corporation, also significantly increased its Bitcoin reserves, emphasizing its role as a hedge against inflation and geopolitical risks.
Poland’s Bitcoin Reserve Proposal
Beyond Paul Tudor Jones, another show of support for Bitcoin this week came from Polish lawmaker Sławomir Mentzen. The Presidential aspirant vowed to establish a Bitcoin reserve if elected, signaling a potential crypto-friendly policy shift in Poland.
“Poland should create a Strategic Bitcoin Reserve. If I become the President of Poland, our country will become a cryptocurrency haven, with very friendly regulations, low taxes, and a supportive approach from banks and regulators,” Mentzen shared.
His vision includes embracing Bitcoin as a hedge against economic instability and fostering blockchain innovation to strengthen the national economy. His proposal resonates with growing trends among nations exploring Bitcoin adoption to safeguard financial sovereignty.
Mentzen’s promise reflects a rising sentiment across Europe toward leveraging crypto for economic resilience. If realized, this policy could position Poland among a handful of nations integrating Bitcoin into their fiscal strategies. It would also signal a pivotal shift in European crypto policy frameworks.
Disclaimer
In adherence to the Trust Project guidelines, BeInCrypto is committed to unbiased, transparent reporting. This news article aims to provide accurate, timely information. However, readers are advised to verify facts independently and consult with a professional before making any decisions based on this content. Please note that our Terms and Conditions, Privacy Policy, and Disclaimers have been updated.

Blockchain Association Outlines 5 Crypto Priorities For Donald Trump’s Administration

Sui Partners with Franklin Templeton for Blockchain Development
Altcoins Trending Today — November 22: MYTH, MAD, MODE
Sui and Franklin Templeton Team Up To Drive DeFi Adoption: Details

DOGE Price To Hit $2.4 As Elon Musk Shares New Update On D.O.G.E.

Gensler’s Exit, Bitfinex Hack, Bitcoin in the US

2.52 Million Altcoins Are Ruining Crypto’s Future

Animoca Brands Valuation Tanks 75% In Two Years, Here’s Why

Crypto exchange BingX hacked for $43 million

Are The Big Players Losing Interest?

Hong Kong’s Securities Association Tips Authorities On Crypto Self-Regulation

Coinbase cbBTC Set to go Live on Solana
2.52 Million Altcoins Are Ruining Crypto’s Future
Animoca Brands Valuation Tanks 75% In Two Years, Here’s Why
Crypto exchange BingX hacked for $43 million
Are The Big Players Losing Interest?
Hong Kong’s Securities Association Tips Authorities On Crypto Self-Regulation
Coinbase cbBTC Set to go Live on Solana
-

 Regulation21 hours ago
UK to unveil crypto and stablecoin regulatory framework early next year
-

 Market23 hours ago
Why SUI Network Outage Did Not Cause a Price Crash
-
 Market22 hours ago
Cardano (ADA) Price Hits 41% Weekly Growth, $1 Target in Sight
-
 Market20 hours ago
Trump Media Files Trademark for Crypto Platform TruthFi
-

 Market18 hours ago
GOAT Price Sees Slower Growth After Reaching $1B Market Cap
-
Altcoin18 hours ago
Dogecoin Code Appears In CyberTruck And Model 3 Website, Will Tesla Accept DOGE Payments For Cars Soon?
-
 Regulation24 hours ago
Gary Gensler To Step Down As US SEC Chair In January
-

 Ethereum24 hours ago
Analyst Reveals When The Ethereum Price Will Reach A New ATH, It’s Closer Than You Think