
Market
Friend.tech Faces Token Drop Amid Co-Founder’s Departure Plans

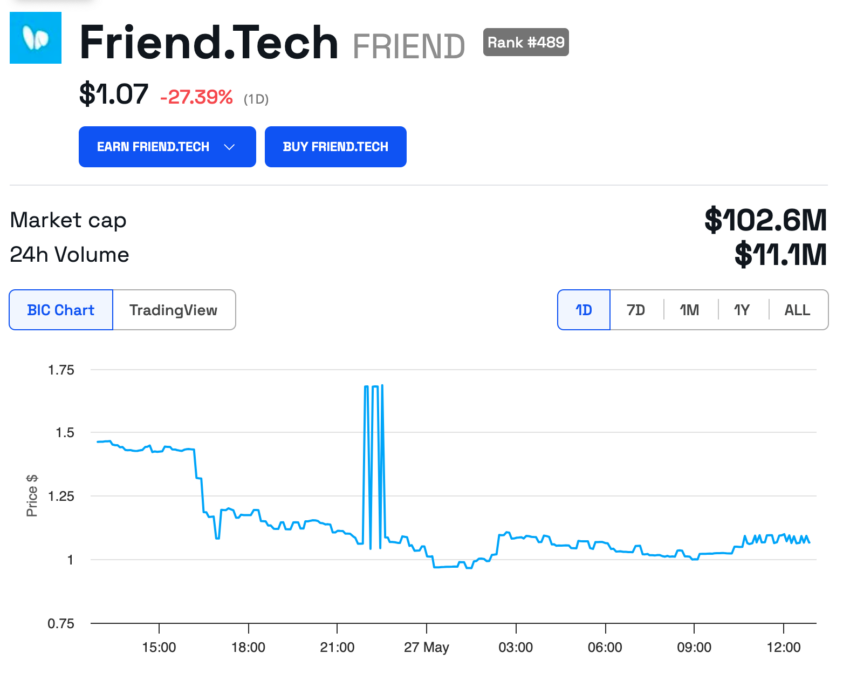
The native token of Friend.tech, a Web3 social network, sharply declined in value today.
The massive drop followed a social media post from the project’s co-founder, Racer, indicating a desire to leave the Base network.
Racer’s Post Causes Sharp Decline in FRIEND Value
Friend.tech’s token, FRIEND, dropped by over 27% after Racer’s post. His message on X offered $200,000 for a system design to migrate Friend.tech off Base without significant user issues.
“System design bounty: If you can figure out a way to migrate friendtech off Base without major issues for users, and it works well enough for us to use, we will pay you $200K,” Racer posted.
Read more: What is Friend.Tech? A Deep Dive Into The Web3 Social Media App
The relationship between Friend.tech and Base has been rocky. Racer noted that Farcaster investors misconstrued their project at launch, straining the relationship with the Base community. This caused the Friend.tech team to feel ostracized and disconnected from the Base and Ethereum ecosystems.
Jesse Pollak, who leads Base at Coinbase, responded with understanding. In his post, Pollak acknowledged that project’s team felt isolated and expressed support for whatever path they chose.
“I’ll be sad if the team decides to leave Base, but I also respect and will support whatever path – that’s the beauty of the decentralized, on-chain economy,” Pollak wrote.
Launched on August 10, 2023, Friend.tech has become one of the top decentralized applications (dApps) on the Base network. It has attracted over 200,000 users and facilitated a trading volume exceeding $230 million. The platform converts user influence into tradable tokens known as “keys,” allowing users to access a creator’s attention or influence.
Friend.tech recently made headlines due to its second version (Friend.tech V2) debut and a native token airdrop. The FRIEND token is claimed to be solely owned by its user base and has a market cap of around $200 million.
Franklin Templeton’s analysis reveals that roughly 46% of all transactions on Base are intertwined with SocialFi applications, marking Friend.tech as a prime example. The recent developments raise questions about project’s future on the Base network. While Racer’s posts are inaccessible, the market reacted swiftly and significantly.
Disclaimer
In adherence to the Trust Project guidelines, BeInCrypto is committed to unbiased, transparent reporting. This news article aims to provide accurate, timely information. However, readers are advised to verify facts independently and consult with a professional before making any decisions based on this content. Please note that our Terms and Conditions, Privacy Policy, and Disclaimers have been updated.


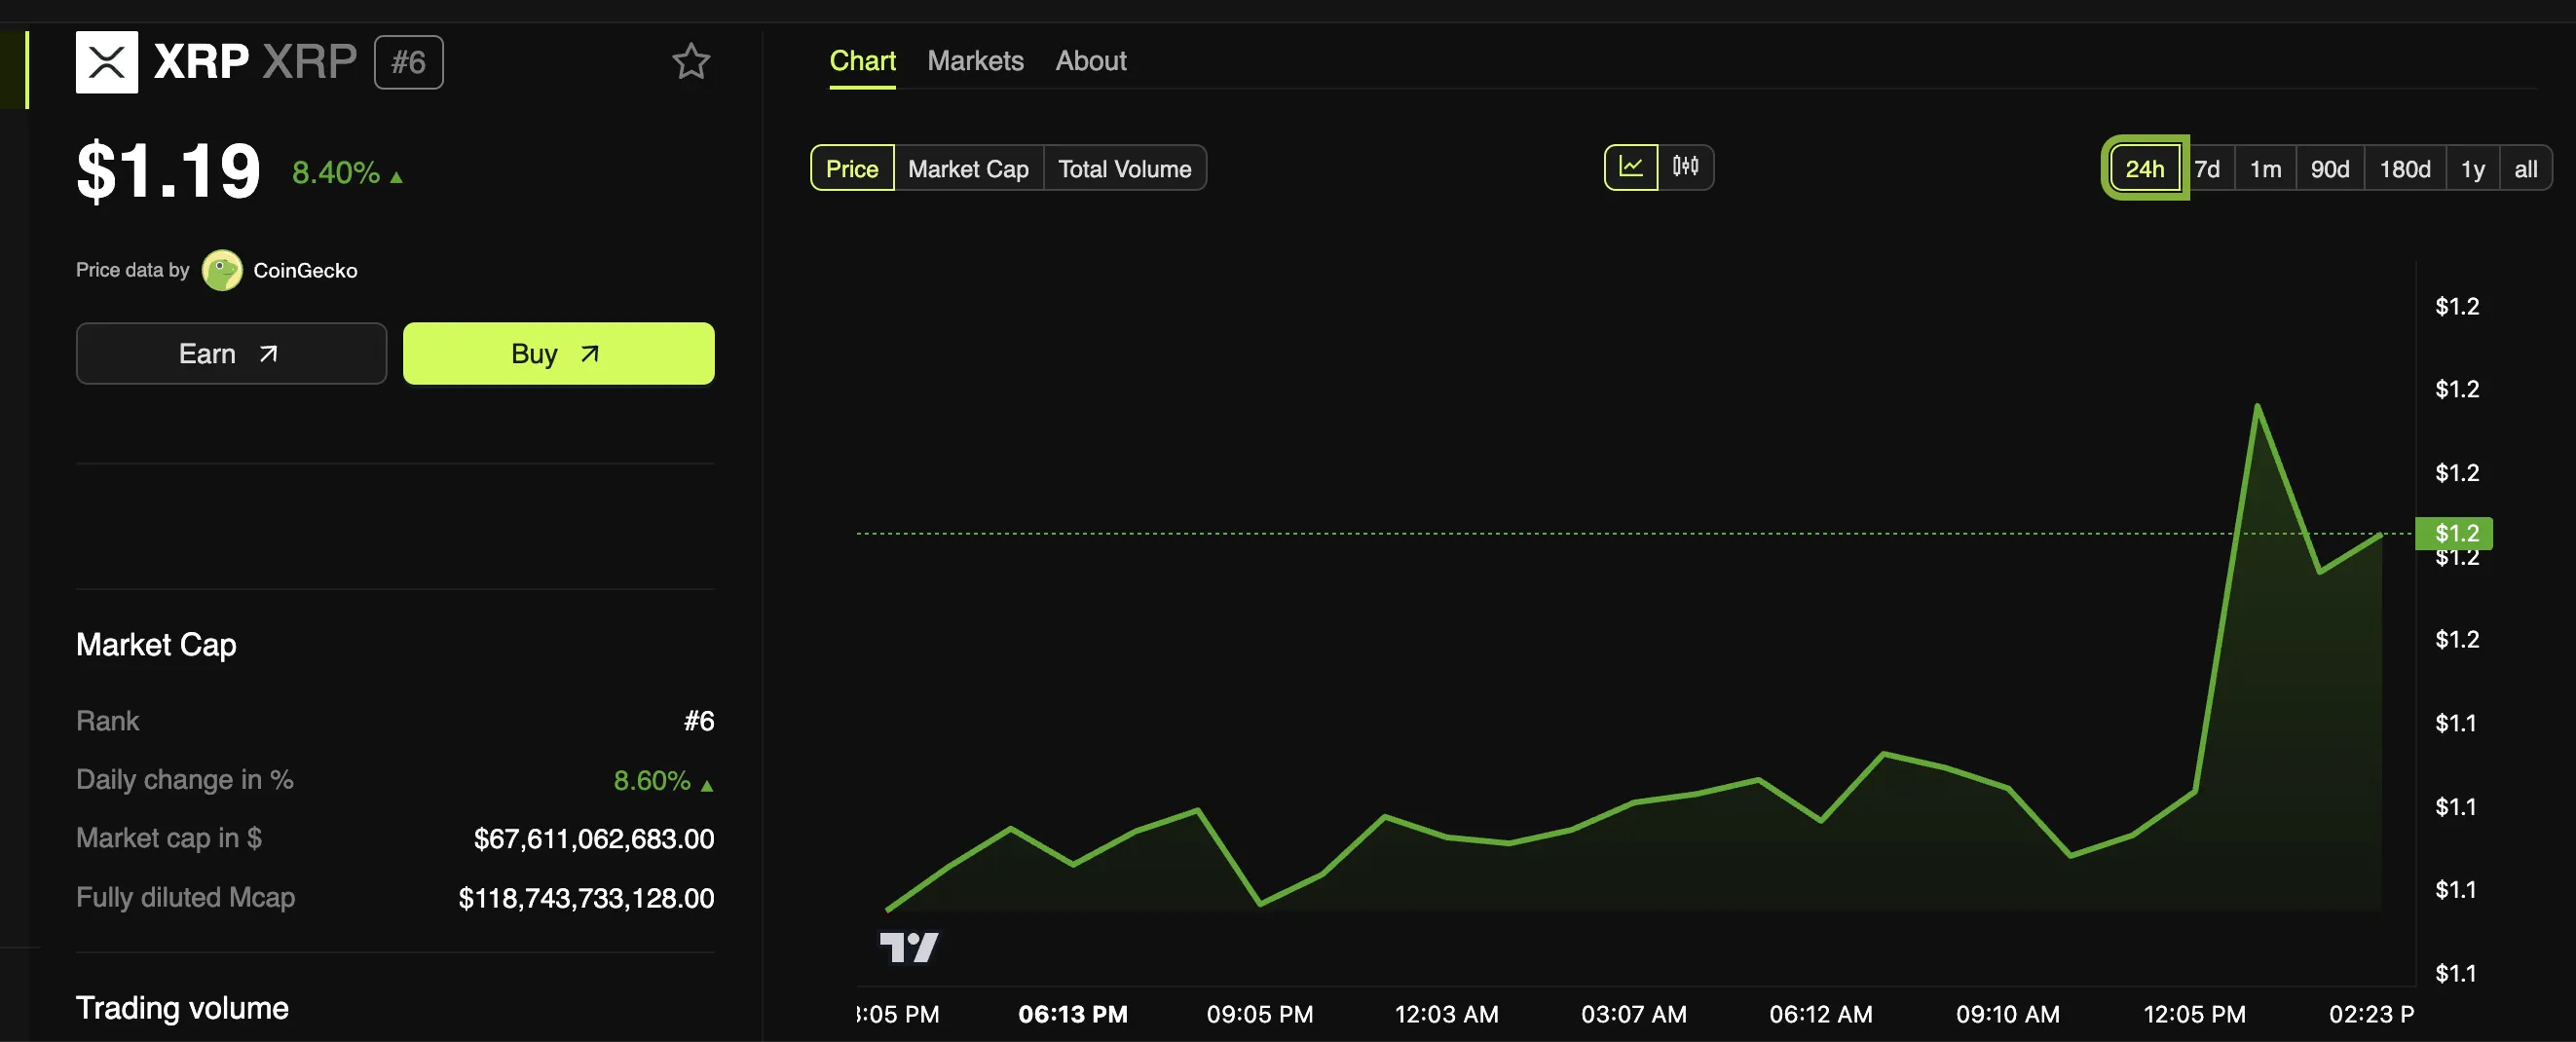
XRP price rallied above the $1.15 and $1.20 resistance levels. The price is up over 25% and might rise further above the $1.420 resistance.
- XRP price started a fresh surge above the $1.20 resistance level.
- The price is now trading above $1.250 and the 100-hourly Simple Moving Average.
- There was a break above a key bearish trend line with resistance at $1.1400 on the hourly chart of the XRP/USD pair (data source from Kraken).
- The pair is up over 25% and it seems like the bulls are not done yet.
XRP Price Eyes Steady Increase
XRP price formed a base above $1.050 and started a fresh increase. There was a move above the $1.150 and $1.20 resistance levels. It even pumped above the $1.25 level, beating Ethereum and Bitcoin in the past two sessions.
There was also a break above a key bearish trend line with resistance at $1.1400 on the hourly chart of the XRP/USD pair. A high was formed at $1.4161 and the price is now consolidating gains. It is trading above the 23.6% Fib retracement level of the upward move from the $1.0649 swing low to the $1.4161 high.
The price is now trading above $1.30 and the 100-hourly Simple Moving Average. On the upside, the price might face resistance near the $1.400 level. The first major resistance is near the $1.420 level. The next key resistance could be $1.450.

A clear move above the $1.450 resistance might send the price toward the $1.50 resistance. Any more gains might send the price toward the $1.550 resistance or even $1.620 in the near term. The next major hurdle for the bulls might be $1.750 or $1.80.
Are Dips Supported?
If XRP fails to clear the $1.420 resistance zone, it could start a downside correction. Initial support on the downside is near the $1.3350 level. The next major support is near the $1.2850 level.
If there is a downside break and a close below the $1.2850 level, the price might continue to decline toward the $1.240 support or the 50% Fib retracement level of the upward move from the $1.0649 swing low to the $1.4161 high in the near term. The next major support sits near the $1.20 zone.
Technical Indicators
Hourly MACD – The MACD for XRP/USD is now gaining pace in the bearish zone.
Hourly RSI (Relative Strength Index) – The RSI for XRP/USD is now above the 50 level.
Major Support Levels – $1.3350 and $1.2850.
Major Resistance Levels – $1.4000 and $1.4200.

ETF issuer WisdomTree’s European division just announced a new ETP based on XRP. This product is currently available in four EU countries, which has led XRP’s price to jump slightly.
ETPs are a common issuer strategy to earn revenue without ETF approval, but Europe will not necessarily approve one even if the US does so.
WisdomTree’s XRP ETP
WisdomTree, one of the Bitcoin ETF issuers in the US, announced that its European branch is offering an exchange-traded product (ETP) based on XRP. This new product is currently available in Germany, Switzerland, France, and the Netherlands. A growing number of issuers have filed for an XRP ETF, but WisdomTree is taking a slightly different tack.
“The WisdomTree Physical XRP ETP offers a simple, secure, and low-cost way to gain exposure to XRP, one of the largest cryptocurrencies by market capitalization. Backed 100% by XRP, XRPW is the lowest-priced XRP ETP in Europe, providing direct spot price exposure,” the announcement claimed.
The possibility of an official XRP ETF is growing with the current bull market, and Ripple CEO Brad Garlinghouse considers it “inevitable.” Still, it hasn’t happened yet, and ETP offerings allow issuers to somewhat address customers’ requirements. BitWise, which has also filed for an XRP ETF in the US, recently acquired a European ETP issuer to enter the same market.
WisdomTree, however, is no stranger to this market strategy. In May this year, it won approval to offer ETPs based on Bitcoin and Ethereum to British investors.
The UK has not yet approved a full ETF for either of these assets, but WisdomTree still gained market access. Even a fraction of the XRP market could also prove lucrative; the asset’s value spiked today.
WisdomTree Europe’s strategy page does not describe any further actions upon full approval. Even if the US approves an XRP ETF under the SEC’s new leadership, that won’t necessarily benefit WisdomTree’s European branch. For now, these ETPs built on XRP will have to suffice for this market.
Disclaimer
In adherence to the Trust Project guidelines, BeInCrypto is committed to unbiased, transparent reporting. This news article aims to provide accurate, timely information. However, readers are advised to verify facts independently and consult with a professional before making any decisions based on this content. Please note that our Terms and Conditions, Privacy Policy, and Disclaimers have been updated.

Ethereum price started a fresh increase above the $3,220 zone. ETH is rising and aiming for more gains above the $3,350 resistance.
- Ethereum started a fresh increase above the $3,220 and $3,300 levels.
- The price is trading above $3,250 and the 100-hourly Simple Moving Average.
- There is a short-term contracting triangle forming with resistance at $3,360 on the hourly chart of ETH/USD (data feed via Kraken).
- The pair could gain bullish momentum if it clears the $3,385 resistance zone.
Ethereum Price Regains Traction
Ethereum price remained supported above $3,000 and started a fresh increase like Bitcoin. ETH gained pace for a move above the $3,150 and $3,220 resistance levels.
The bulls pumped the price above the $3,300 level. It gained over 10% and traded as high as $3,387. It is now consolidating gains above the 23.6% Fib retracement level of the recent move from the $3,036 swing low to the $3,387 high.
Ethereum price is now trading above $3,220 and the 100-hourly Simple Moving Average. On the upside, the price seems to be facing hurdles near the $3,350 level. There is also a short-term contracting triangle forming with resistance at $3,360 on the hourly chart of ETH/USD.

The first major resistance is near the $3,385 level. The main resistance is now forming near $3,420. A clear move above the $3,420 resistance might send the price toward the $3,550 resistance. An upside break above the $3,550 resistance might call for more gains in the coming sessions. In the stated case, Ether could rise toward the $3,650 resistance zone or even $3,880.
Another Decline In ETH?
If Ethereum fails to clear the $3,350 resistance, it could start another decline. Initial support on the downside is near the $3,300 level. The first major support sits near the $3,250 zone.
A clear move below the $3,250 support might push the price toward $3,220 or the 50% Fib retracement level of the recent move from the $3,036 swing low to the $3,387 high. Any more losses might send the price toward the $3,150 support level in the near term. The next key support sits at $3,050.
Technical Indicators
Hourly MACD – The MACD for ETH/USD is gaining momentum in the bullish zone.
Hourly RSI – The RSI for ETH/USD is now above the 50 zone.
Major Support Level – $3,250
Major Resistance Level – $3,385
Solana Hits New ATH On Huge Whale Accumulation, More Gains Ahead?

XRP Price 25% Rally: Breaking Barriers and Surpassing Odds

Dogecoin Hashrate Surges To New All-Time High Amid Rise In Positive Momentum
WisdomTree Europe Launches XRP ETP

BTC Surges to $99K, ETH Shoots, XRP Jumps 25%

Rallies 10% and Targets More Upside

2.52 Million Altcoins Are Ruining Crypto’s Future

Animoca Brands Valuation Tanks 75% In Two Years, Here’s Why

Crypto exchange BingX hacked for $43 million

Are The Big Players Losing Interest?

Hong Kong’s Securities Association Tips Authorities On Crypto Self-Regulation

Coinbase cbBTC Set to go Live on Solana
2.52 Million Altcoins Are Ruining Crypto’s Future
Animoca Brands Valuation Tanks 75% In Two Years, Here’s Why
Crypto exchange BingX hacked for $43 million
Are The Big Players Losing Interest?
Hong Kong’s Securities Association Tips Authorities On Crypto Self-Regulation
Coinbase cbBTC Set to go Live on Solana
-

 Ethereum23 hours ago
Fundraising platform JustGiving accepts over 60 cryptocurrencies including Bitcoin, Ethereum
-

 Market20 hours ago
South Korea Unveils North Korea’s Role in Upbit Hack
-

 Market24 hours ago
Cardano’s Hoskinson Wants Brian Armstrong for US Crypto-Czar
-
 Altcoin18 hours ago
Sui Network Back Online After 2-Hour Outage, Price Slips
-

 Market23 hours ago
Litecoin (LTC) at a Crossroads: Can It Rebound and Rally?
-
 Altcoin17 hours ago
Dogecoin Whale Accumulation Sparks Optimism, DOGE To Rally 9000% Ahead?
-
 Altcoin22 hours ago
Why FLOKI Price Hits 6-Month Peak With 5% Surge?
-

 Bitcoin15 hours ago
Marathon Digital Raises $1B to Expand Bitcoin Holdings