
Ethereum
Ethereum Exchange Inflows Highest Since March: Bearish Sign?

On-chain data shows that the Ethereum exchange net flows have been highly positive recently, a sign that selling may be taking place in the market.
Ethereum Exchange Netflows Have Seen A Spike Recently
In a new post on X, CryptoQuant head of research Julio Moreno discussed the latest trend in Ethereum’s exchange netflow. The “exchange netflow” here refers to an on-chain metric that keeps track of the net amount of ETH moving into or out of the wallets of all centralized exchanges.
When this metric’s value is positive, it means that these platforms are receiving a net number of coins right now. As one of the main reasons holders might deposit coins to exchanges is for selling-related purposes, this trend can potentially bearish consequences for the asset’s price.
On the other hand, the indicator’s negative reading implies that exchange-associated wallets are observing net withdrawals currently. Investors may be moving their coins away from the custody of these central entities for long-term holding, so such a trend may prove to be bullish for the cryptocurrency.
Now, here is a chart that shows the trend in the Ethereum exchange netflow over the last few months:
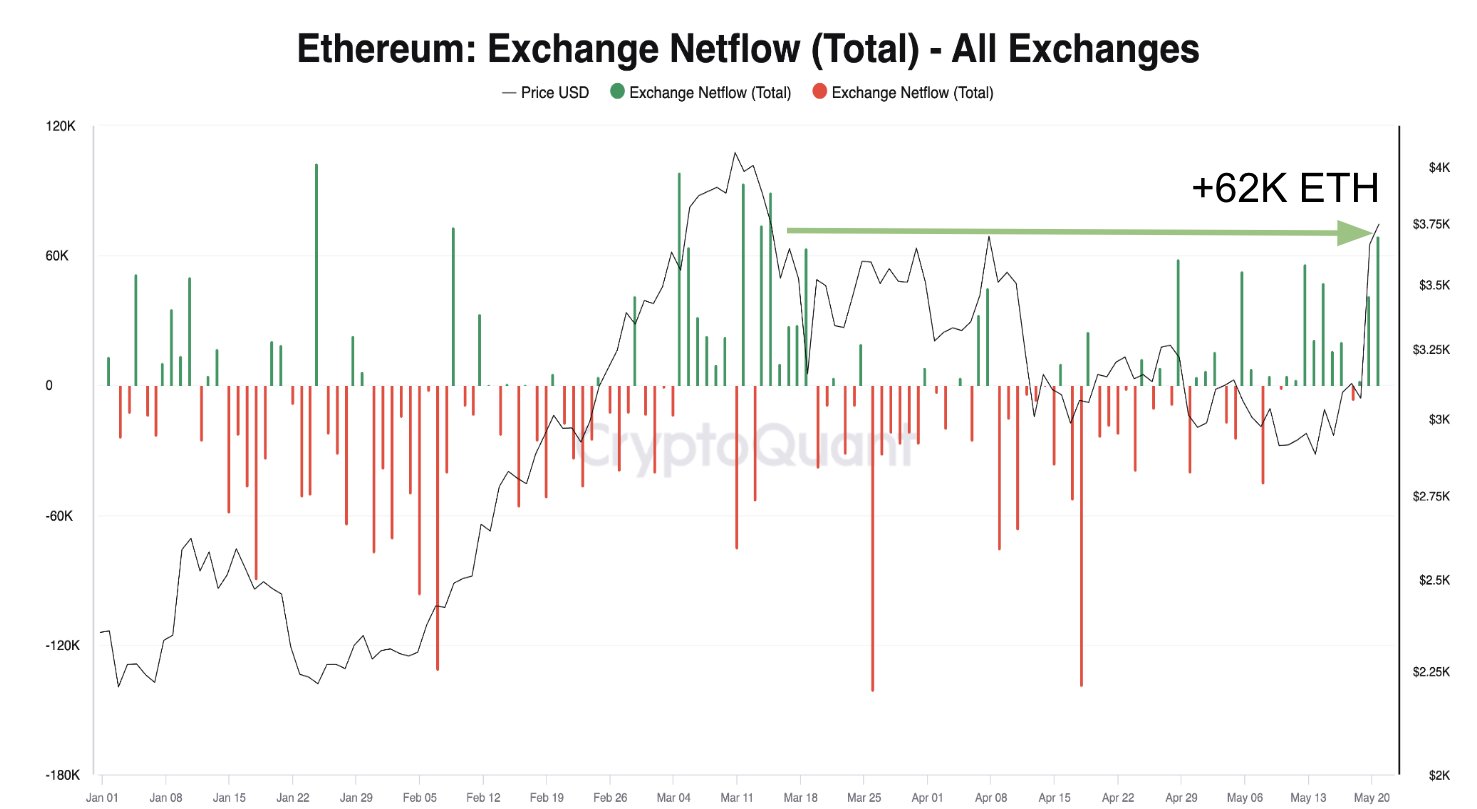
The value of the metric appears to have been quite high in recent days | Source: @jjcmoreno on X
The above graph shows that the Ethereum exchange netflow has registered some large positive spikes recently. These net deposits have been of a scale only observed in March. According to Moreno, these deposits have mostly been headed towards Binance and Bybit.
As mentioned before, net exchange inflows can indicate that selling is taking place in the market, although this doesn’t necessarily have to be the case. Sometimes, large deposits use one of the other services these platforms provide, like derivatives contracts.
Whatever the case, though, volatility does tend to rise following large deposits. The chart shows that the rally top back in March saw the indicator assume high values as investors participated in profit-taking.
Recently, Ethereum has observed a sharp surge, fueled by positive news surrounding the spot exchange-traded funds (ETFs). Given this rally, it’s possible that profit-taking may once again be the goal behind the positive net flows.
So far, though, ETH has managed to stave off this potential selloff, as its price has remained relatively high. It’s uncertain, however, how long demand can continue to absorb the possible selling pressure if deposits continue to flow into these platforms in the coming days.
ETH Price
Ethereum started a move up during the past day as its price breached the $3,950 mark. The rise only lasted briefly, though, as the asset returned below the $3,800 level.
Looks like the price of the asset has observed a surge over the last few days | Source: ETHUSD on TradingView
Featured image from Kanchanara on Unsplash.com, CryptoQuant.com, chart from TradingView.com


They say journalists never truly clock out. But for Christian, that’s not just a metaphor, it’s a lifestyle. By day, he navigates the ever-shifting tides of the cryptocurrency market, wielding words like a seasoned editor and crafting articles that decipher the jargon for the masses. When the PC goes on hibernate mode, however, his pursuits take a more mechanical (and sometimes philosophical) turn.
Christian’s journey with the written word began long before the age of Bitcoin. In the hallowed halls of academia, he honed his craft as a feature writer for his college paper. This early love for storytelling paved the way for a successful stint as an editor at a data engineering firm, where his first-month essay win funded a months-long supply of doggie and kitty treats – a testament to his dedication to his furry companions (more on that later).
Christian then roamed the world of journalism, working at newspapers in Canada and even South Korea. He finally settled down at a local news giant in his hometown in the Philippines for a decade, becoming a total news junkie. But then, something new caught his eye: cryptocurrency. It was like a treasure hunt mixed with storytelling – right up his alley!
So, he landed a killer gig at NewsBTC, where he’s one of the go-to guys for all things crypto. He breaks down this confusing stuff into bite-sized pieces, making it easy for anyone to understand (he salutes his management team for teaching him this skill).
Think Christian’s all work and no play? Not a chance! When he’s not at his computer, you’ll find him indulging his passion for motorbikes. A true gearhead, Christian loves tinkering with his bike and savoring the joy of the open road on his 320-cc Yamaha R3. Once a speed demon who hit 120mph (a feat he vowed never to repeat), he now prefers leisurely rides along the coast, enjoying the wind in his thinning hair.
Speaking of chill, Christian’s got a crew of furry friends waiting for him at home. Two cats and a dog. He swears cats are way smarter than dogs (sorry, Grizzly), but he adores them all anyway. Apparently, watching his pets just chillin’ helps him analyze and write meticulously formatted articles even better.
Here’s the thing about this guy: He works a lot, but he keeps himself fueled by enough coffee to make it through the day – and some seriously delicious (Filipino) food. He says a delectable meal is the secret ingredient to a killer article. And after a long day of crypto crusading, he unwinds with some rum (mixed with milk) while watching slapstick movies.
Looking ahead, Christian sees a bright future with NewsBTC. He says he sees himself privileged to be part of an awesome organization, sharing his expertise and passion with a community he values, and fellow editors – and bosses – he deeply respects.
So, the next time you tread into the world of cryptocurrency, remember the man behind the words – the crypto crusader, the grease monkey, and the feline philosopher, all rolled into one.

In a post on X this past weekend, Quinn Thompson, Chief Investment Officer (CIO) of Lekker Capital, declared that Ethereum (ETH) is “completely dead” as an investment. His comments sparked a flurry of responses from prominent figures in the crypto industry, including Nic Carter of Castle Island Ventures, Columbia Business School professor Omid Malekan, and VB Capital’s Scott Johnsson.
Thompson, who oversees investments at Lekker Capital, set off the debate with a post stating: “Make no mistake, ETH as an investment is completely dead. A $225 billion market cap network that is seeing declines in transaction activity, user growth and fees/revenues. There is no investment case here. As a network with utility? Yes. As an investment? Absolutely not.”
He also shared a set of metrics to underscore Ethereum’s recent stagnation, including data on active addresses, transaction counts, and new address creation.

Is Ethereum ‘Dead’ As An Investment?
The provocative statement attracted immediate responses from prominent voices across the crypto ecosystem, triggering a debate over Ethereum’s economic and investment thesis, and specifically, the influence of Layer 2 (L2) scaling solutions on Ethereum’s native token economics.
Nic Carter, partner at Castle Island Ventures and co-founder of blockchain analytics firm Coinmetrics, swiftly responded, pinpointing Ethereum’s valuation dilemma squarely at the feet of its Layer 2 scaling implementations:“The #1 cause of this is greedy eth L2s siphoning value from the L1 and the social consensus that excess token creation was A-OK. Eth was buried in an avalanche of its own tokens. Died by its own hand.”
Thompson reinforced Carter’s criticism by suggesting that Ethereum’s community consensus had inadvertently favored token proliferation as a wealth-generation mechanism, ultimately undermining ETH’s investment narrative: “The social consensus among .eth’s in favor of excess tokens was because the creation of endless L2s, staking, restaking, DA, etc etc all enriched their pockets on the way up but no one wants to face the music now that the market is saying that was a mistake.”
However, this viewpoint was contested by Omid Malekan, professor at Columbia Business School and specialist in cryptocurrency and blockchain technology since 2019. Malekan underscored Layer 2s’ critical role in blockchain scalability and argued that any value-extraction by these secondary layers was not inherently detrimental to Ethereum’s foundational token economics: “L2s are the only viable way to scale any blockchain. Whether their tokens capture value or not is a separate question. But it can’t be that L2s ‘siphoned value from ETH’ yet didn’t capture value themselves. Security is not free.”
Malekan further challenged Thompson’s claim by questioning whether Ethereum could realistically become the first example in history of a widely adopted technological network whose utility failed to generate any meaningful financial return: “Is Ethereum going to be the first network ‘with utility’ in modern history where the network effects aren’t monetized? Can you provide any other examples of this happening?”
In response, Thompson clarified his argument, highlighting that monetization is indeed occurring within the Ethereum ecosystem, but not sufficiently accruing to ETH itself to validate the cryptocurrency’s current market capitalization. He illustrated this point with an analogy: “There’s tons of network effects being monetized all over the place, just not enough to ETH to justify its current valuation. Do all the network effects of the oil network and usage of oil accrue to oil?”
However, the oil analogy drew skepticism from Scott Johnsson, General Partner at VB Capital, who critiqued Thompson’s comparison due to Ethereum’s unique tokenomics, particularly its deflationary token burning mechanics influenced directly by network usage:
“I don’t disagree with your directional call, but I think this analogy falls flat. ETH ‘production’ is inversely correlated with usage, which is certainly not the case with oil. So as oil price increases, there is a demand response and a supply response. With ETH, it’s limited to the demand response. If ETH consumption looks like barrel consumption, then the price of ETH is far more likely to accrue value.”
Yet Thompson continued to disagree with Johnsson’s assessment, arguing that historical patterns do not necessarily support the claim of inverse correlation between Ethereum production and usage: “I disagree. We’ve never seen a sustained period of time where ‘ETH production is inversely correlated with usage.’ Obviously, the ‘production’ mechanics differ from oil, but similarly high ETH price is prohibitive to demand, hence L2s and cheaper alternative L1s.”
Acknowledging a possible misunderstanding, Johnsson clarified he was not predicting future Ethereum usage scenarios, emphasizing instead the theoretically inverse relationship between token burn and transaction volume under the current Ethereum network design: “I think we’re talking past each other a bit. I don’t think it’s arguable that if ETH usage increases that it leads to more burn and less inflation (production). I’m specifically not making future predictions on that usage. In any event, your ultimate point is fine imo because the demand side is so sensitive to really any cost.”
At press time, ETH traded at $1,793.

Featured image created with DALL.E, chart from TradingView.com
Editorial Process for bitcoinist is centered on delivering thoroughly researched, accurate, and unbiased content. We uphold strict sourcing standards, and each page undergoes diligent review by our team of top technology experts and seasoned editors. This process ensures the integrity, relevance, and value of our content for our readers.
Ethereum is now trading above the $2,000 mark after several days of struggle, marking a potential turning point for the second-largest cryptocurrency by market cap. ETH had plunged over 38% since late February, sparking panic among investors when the price broke below the critical $2,000 level and briefly fell under $1,800. This sharp drop led many to question whether the broader altcoin market was entering a prolonged bear phase.
However, the recent recovery and price stabilization above $2,000 have renewed optimism among Ethereum holders. Many investors believe the worst may be over and that ETH could begin building the foundation for a sustained recovery in the coming months.
Supporting this sentiment, data from Santiment reveals that whales have bought roughly 470,000 ETH over the past week. This notable accumulation from large holders suggests growing confidence in Ethereum’s long-term potential, even amid recent volatility. Historically, whale accumulation has preceded major price rallies, adding to speculation that Ethereum could be gearing up for a significant upward move.
While uncertainty remains, current on-chain signals and market behavior hint that ETH may be preparing for a bullish breakout — if bulls can defend key support levels and reclaim higher ground.
Ethereum Builds Momentum Amid Potential Recovery
Ethereum is showing signs of life after a prolonged period of consolidation and selling pressure. The recent push above the $2,000 mark has given bulls a critical opportunity to reclaim control and ignite a recovery uptrend. However, price action remains uncertain, with the market caught between expectations of a continued downtrend and hopes for a meaningful reversal.
Bulls must now defend the $2,000 support level with strength. This price point has been a major psychological and technical barrier over the past few months, and a solid hold above it could provide the foundation for a broader rally. A failure to maintain this level, however, could invite further downside pressure and signal the continuation of the bearish trend.
Adding to the growing optimism is new on-chain data shared by top analyst Ali Martinez. According to Santiment, Ethereum whales have accumulated roughly 470,000 ETH in the past week. This surge in accumulation from large holders suggests confidence is returning to the market and could indicate that smart money is positioning for a potential move higher.

Historically, heavy whale buying has often preceded major price increases, serving as a leading indicator for broader market sentiment. If bulls continue to step in and Ethereum maintains its footing above $2,000, a recovery toward $2,300 and beyond may soon be on the table.
ETH Price Hovers Above $2,000 As Bulls Try To Find Momentum
Ethereum is trading at $2,090 after a sharp rebound from recent lows, marking its first sustained move above the $2,000 level in weeks. This area has become a critical battleground between bulls and bears, as ETH has struggled below this mark since early March. Now, with price action pushing higher, bulls must defend this support zone to maintain momentum.

To confirm a meaningful recovery, Ethereum must break above the $2,200 resistance—an area aligned with previous consolidation and short-term moving averages. A successful reclaim of this level would likely ignite renewed bullish momentum and open the path toward $2,300 and higher.
However, if bulls fail to hold the $2,000 mark, selling pressure could return quickly. A breakdown below this level would signal weakness and potentially send ETH back toward the $1,800 zone, which served as a recent bottom during the sell-off.
Momentum is slowly shifting, but the next few trading sessions will be crucial. Ethereum needs sustained buying volume and stronger confirmation above $2,200 to establish a true bullish reversal. Until then, the $2,000 line remains the key level to watch as the battle for direction continues.
Featured image from Dall-E, chart from TradingView
Editorial Process for bitcoinist is centered on delivering thoroughly researched, accurate, and unbiased content. We uphold strict sourcing standards, and each page undergoes diligent review by our team of top technology experts and seasoned editors. This process ensures the integrity, relevance, and value of our content for our readers.

3 Altcoins to Watch in the First Week of April 2025

BTC Price Rebound Likely as Long-Term Holders Reenter Market

Ethereum To $20K? Investor Says Real-World Adoption Is The Key
$33 Million Inflows Signal Market Bounce

Top Crypto Airdrops to Watch in the First Week of April
Strategic Move for Trump Family in Crypto

2.52 Million Altcoins Are Ruining Crypto’s Future

Animoca Brands Valuation Tanks 75% In Two Years, Here’s Why

Crypto exchange BingX hacked for $43 million

Are The Big Players Losing Interest?

Hong Kong’s Securities Association Tips Authorities On Crypto Self-Regulation

Coinbase cbBTC Set to go Live on Solana
2.52 Million Altcoins Are Ruining Crypto’s Future
Animoca Brands Valuation Tanks 75% In Two Years, Here’s Why
Crypto exchange BingX hacked for $43 million
Are The Big Players Losing Interest?
Hong Kong’s Securities Association Tips Authorities On Crypto Self-Regulation
Coinbase cbBTC Set to go Live on Solana
-

 Ethereum24 hours ago
Whales Accumulate 470,000 Ethereum In One Week – Bullish Momentum Ahead?
-
 Regulation21 hours ago
Japan Set To Classify Cryptocurrencies As Financial Products, Here’s All
-

 Market20 hours ago
Top 3 Made in USA Coins to Watch This Week
-

 Market23 hours ago
3 Token Unlocks for April: Parcl, deBridge, Scroll
-

 Market19 hours ago
Solana (SOL) Price Risks Dip Below $110 as Bears Gain Control