
Market
Understanding the Dominance of Tether’s USDT

Stablecoins have become an essential part of the blockchain space, offering stability in a highly volatile market. Although there are dozens of stablecoins with different collateral available to investors today, Tether’s USDT remains the to-go choice for most crypto users.
In this article, we explore the importance of stablecoins, focusing on USDT and its unconditional dominance.
The Need for Stability
Stablecoins are digital assets designed to maintain a stable value by being pegged to a reserve asset, such as the US dollar, euro, or even commodities like gold. They achieve this stability through various mechanisms, including fiat-collateralized, crypto-collateralized, and algorithmic stablecoins. Fiat-collateralized stablecoins, the most common type, back each token issued with reserves of the corresponding fiat currency, ensuring support by a real-world asset.
While many crypto investors enjoy a bit of volatility, the level seen in most crypto assets can make it difficult to use them for payments or trading. Stablecoins address this issue by offering a stable and reliable alternative, facilitating their use in a wide range of applications, including base trading pairs, remittances, and decentralized finance (DeFi).
This has resulted in substantial growth for stablecoins, now boasting a combined market capitalization of $161 billion. The chart below highlights this significant increase, which began in 2020.
Read more: How to Buy USDT in Three Easy Steps – A Beginner’s Guide
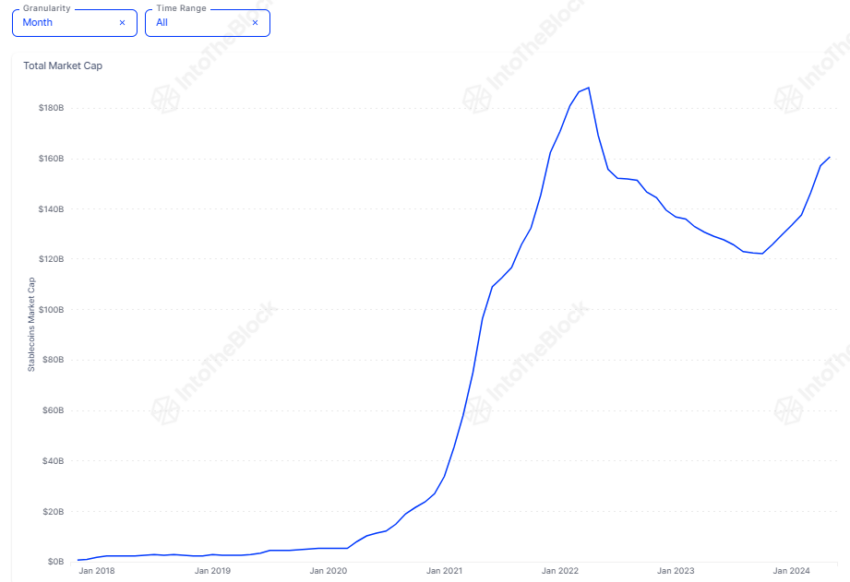
“While some of this growth is due to the rising interest in cryptocurrencies, it is primarily driven by the growing importance of DeFi and the crucial role stablecoins play in DeFi primitives like lending protocols and automated market makers (AMMs),” Vincent Maliepaard, Marketing Director at IntoTheBlock, told BeInCrypto.
USDT: The Undisputed Market Leader
Despite strong competition, Tether (USDT) has established itself as the most important stablecoin in the cryptocurrency market. Launched in 2014, USDT is pegged to the US dollar, with each token purportedly backed by an equivalent amount of fiat currency held in reserve.
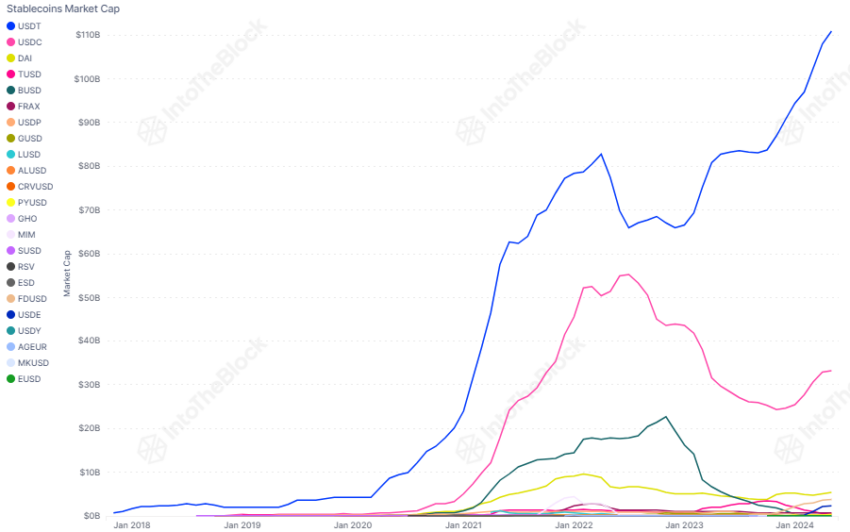
Data from IntoTheBlock shows that USDT, with a market cap of $111 billion, accounts for just over 70% of the total stablecoin market capitalization. In contrast, the second largest stablecoin, USDC, accounts for just 21%.
Read more: 9 Best Crypto Wallets to Store Tether (USDT)
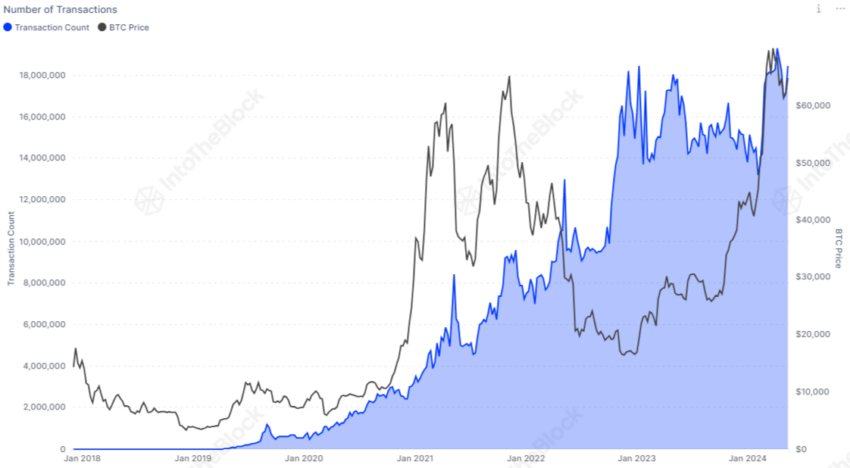
Furthermore, there is no sign that this growth is slowing down soon. The number of USDT transactions has significantly increased since the start of the year and is approaching new highs.
Maliepaard notes USDT’s dominance is attributed to several factors:
- Liquidity and Accessibility: USDT boasts the highest trading volume among stablecoins and is available on most centralized and decentralized exchanges as a base trading pair.
- Integration with DeFi: Many DeFi protocols and platforms use USDT for transactions, lending, and borrowing, enabling participation without exposure to price volatility.
- Cross-Border Transactions: USDT facilitates fast and cost-effective cross-border transactions, offering an efficient alternative to traditional banking systems.
- Stable Store of Value: In regions experiencing hyperinflation or economic instability, USDT offers a reliable store of value.
Comparing Usage of USDT Across Different Chains
While USDT activity is booming across all chains, not all are created equal. Data suggests that users utilize stablecoins differently across various networks. By examining their behavior on different chains, we can see how USDT is utilized in diverse ways. Whether it’s for trading, transferring value, or acting as a stable store of value, USDT’s versatility is evident.
TRON Dominates USDT Transactions
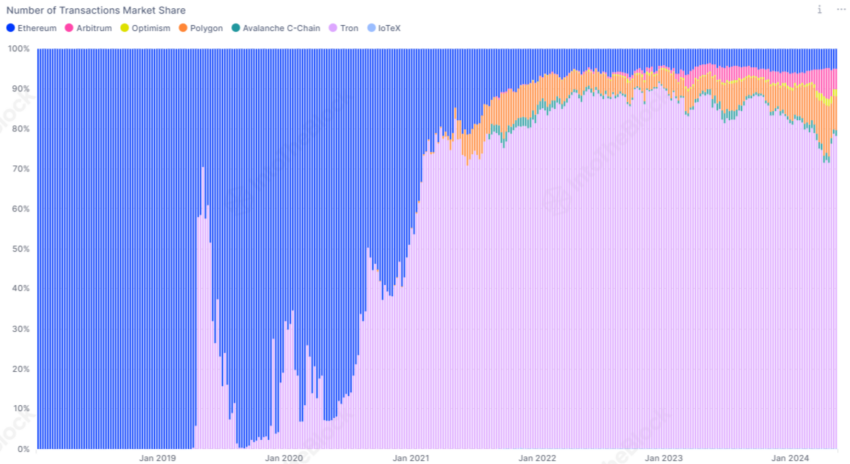
TRON leads in transaction volume with a dominant 78% share. The chart below highlights its superiority compared to other blockchain networks.
This prominence is primarily due to TRON’s low transaction costs and high availability for deposits and withdrawals on major centralized exchanges, making it the preferred option for cross-border Tether’s USDT transactions. Surprisingly, the runner-up isn’t Ethereum but Polygon, which has over 8% of the total USDT transactions.
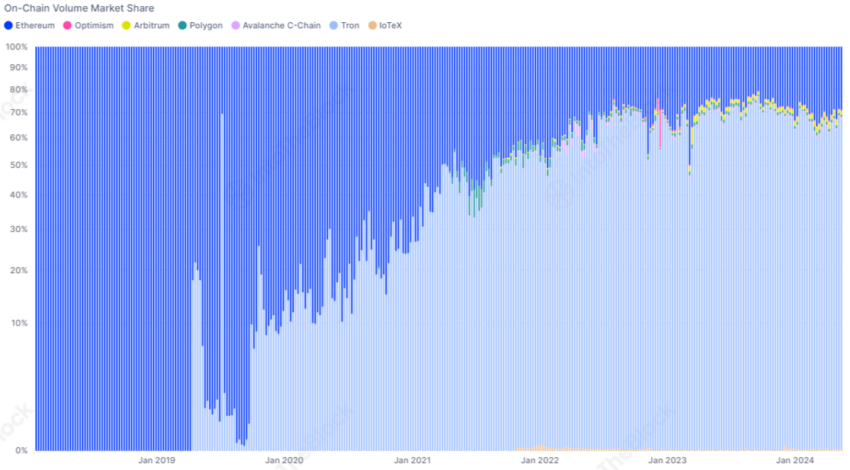
Transaction Volume Comparison
Examining the stablecoin’s volume market share reveals that Ethereum’s transaction volume far exceeds its number of transactions, highlighting its role in facilitating higher-value transfers. In contrast, chains like Polygon, Optimism, and Avalanche have a higher number of transactions but contribute less to the overall volume, indicating their use for smaller, more frequent transactions.
Holding vs. Transacting
The average holding time of USDT on each chain further supports this finding. Data shows that Ethereum users typically keep USDT for 228 days, nearly three times longer than holders on Optimism. TRON addresses also maintain USDT for an extended period, averaging 183 days.
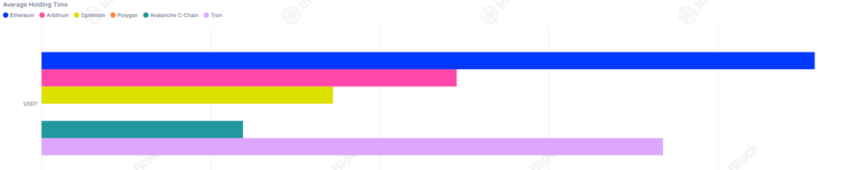
These insights indicate that on Ethereum and TRON, USDT is primarily held to mitigate market volatility, serving as a stable store of value. Conversely, on chains like Optimism and Arbitrum, USDT is frequently used for transactions, likely in DeFi-related applications where quick access to liquidity and transfer speed are crucial.
The Future of USDT
Stablecoins, particularly USDT, play a vital role in the blockchain industry by providing stability and enhancing the utility of digital assets. The recent growth of USDT across various blockchain networks solidifies its position in the cryptocurrency market. As the industry widens, the importance of stablecoins will likely grow, driven by their role in DeFi, trading, and bridging the gap between traditional finance and blockchain.
Disclaimer
In line with the Trust Project guidelines, this price analysis article is for informational purposes only and should not be considered financial or investment advice. BeInCrypto is committed to accurate, unbiased reporting, but market conditions are subject to change without notice. Always conduct your own research and consult with a professional before making any financial decisions. Please note that our Terms and Conditions, Privacy Policy, and Disclaimers have been updated.


Reason to trust
![]()
Strict editorial policy that focuses on accuracy, relevance, and impartiality
Created by industry experts and meticulously reviewed
The highest standards in reporting and publishing
Strict editorial policy that focuses on accuracy, relevance, and impartiality
Morbi pretium leo et nisl aliquam mollis. Quisque arcu lorem, ultricies quis pellentesque nec, ullamcorper eu odio.
Ethereum price attempted a recovery wave above the $1,880 level but failed. ETH is now trimming all gains and remains below the $1,880 resistance zone.
- Ethereum failed to stay above the $1,850 and $1,880 levels.
- The price is trading below $1,850 and the 100-hourly Simple Moving Average.
- There was a break below a key bullish trend line with support at $1,865 on the hourly chart of ETH/USD (data feed via Kraken).
- The pair must clear the $1,865 and $1,890 resistance levels to start a decent increase.
Ethereum Price Fails Again
Ethereum price managed to stay above the $1,800 support zone and started a recovery wave, like Bitcoin. ETH was able to climb above the $1,850 and $1,880 resistance levels.
The bulls even pushed the price above the $1,920 resistance zone. However, the bears are active near the $1,950 zone. A high was formed at $1,955 and the price trimmed most gains. There was a break below a key bullish trend line with support at $1,865 on the hourly chart of ETH/USD.
A low was formed at $1,781 and the price is now consolidating near the 23.6% Fib retracement level of the downward move from the $1,955 swing high to the $1,781 low.
Ethereum price is now trading below $1,850 and the 100-hourly Simple Moving Average. On the upside, the price seems to be facing hurdles near the $1,850 level. The next key resistance is near the $1,865 level and the 50% Fib retracement level of the downward move from the $1,955 swing high to the $1,781 low.

The first major resistance is near the $1,920 level. A clear move above the $1,920 resistance might send the price toward the $1,950 resistance. An upside break above the $1,950 resistance might call for more gains in the coming sessions. In the stated case, Ether could rise toward the $2,000 resistance zone or even $2,050 in the near term.
Another Decline In ETH?
If Ethereum fails to clear the $1,865 resistance, it could start another decline. Initial support on the downside is near the $1,800 level. The first major support sits near the $1,780 zone.
A clear move below the $1,780 support might push the price toward the $1,720 support. Any more losses might send the price toward the $1,680 support level in the near term. The next key support sits at $1,620.
Technical Indicators
Hourly MACD – The MACD for ETH/USD is gaining momentum in the bearish zone.
Hourly RSI – The RSI for ETH/USD is now below the 50 zone.
Major Support Level – $1,780
Major Resistance Level – $1,865
Cardano price started a recovery wave above the $0.680 zone but failed. ADA is consolidating near $0.650 and remains at risk of more losses.
- ADA price failed to recover above the $0.70 resistance zone.
- The price is trading below $0.680 and the 100-hourly simple moving average.
- There was a break below a connecting bullish trend line with support at $0.6720 on the hourly chart of the ADA/USD pair (data source from Kraken).
- The pair could start another increase if it clears the $0.70 resistance zone.
Cardano Price Dips Again
In the past few days, Cardano saw a recovery wave from the $0.6350 zone, like Bitcoin and Ethereum. ADA was able to climb above the $0.680 and $0.6880 resistance levels.
However, the bears were active above the $0.70 zone. A high was formed at $0.7090 and the price corrected most gains. There was a move below the $0.650 level. Besides, there was a break below a connecting bullish trend line with support at $0.6720 on the hourly chart of the ADA/USD pair.
A low was formed at $0.6356 and the price is now consolidating losses near the 23.6% Fib retracement level of the recent decline from the $0.7090 swing high to the $0.6356 low. Cardano price is now trading below $0.680 and the 100-hourly simple moving average.
On the upside, the price might face resistance near the $0.6720 zone or the 50% Fib retracement level of the recent decline from the $0.7090 swing high to the $0.6356 low. The first resistance is near $0.6950. The next key resistance might be $0.700.

If there is a close above the $0.70 resistance, the price could start a strong rally. In the stated case, the price could rise toward the $0.7420 region. Any more gains might call for a move toward $0.7650 in the near term.
Another Drop in ADA?
If Cardano’s price fails to climb above the $0.6720 resistance level, it could start another decline. Immediate support on the downside is near the $0.6420 level.
The next major support is near the $0.6350 level. A downside break below the $0.6350 level could open the doors for a test of $0.620. The next major support is near the $0.60 level where the bulls might emerge.
Technical Indicators
Hourly MACD – The MACD for ADA/USD is losing momentum in the bearish zone.
Hourly RSI (Relative Strength Index) – The RSI for ADA/USD is now below the 50 level.
Major Support Levels – $0.6420 and $0.6350.
Major Resistance Levels – $0.6720 and $0.7000.

Aayush Jindal, a luminary in the world of financial markets, whose expertise spans over 15 illustrious years in the realms of Forex and cryptocurrency trading. Renowned for his unparalleled proficiency in providing technical analysis, Aayush is a trusted advisor and senior market expert to investors worldwide, guiding them through the intricate landscapes of modern finance with his keen insights and astute chart analysis.
From a young age, Aayush exhibited a natural aptitude for deciphering complex systems and unraveling patterns. Fueled by an insatiable curiosity for understanding market dynamics, he embarked on a journey that would lead him to become one of the foremost authorities in the fields of Forex and crypto trading. With a meticulous eye for detail and an unwavering commitment to excellence, Aayush honed his craft over the years, mastering the art of technical analysis and chart interpretation.
As a software engineer, Aayush harnesses the power of technology to optimize trading strategies and develop innovative solutions for navigating the volatile waters of financial markets. His background in software engineering has equipped him with a unique skill set, enabling him to leverage cutting-edge tools and algorithms to gain a competitive edge in an ever-evolving landscape.
In addition to his roles in finance and technology, Aayush serves as the director of a prestigious IT company, where he spearheads initiatives aimed at driving digital innovation and transformation. Under his visionary leadership, the company has flourished, cementing its position as a leader in the tech industry and paving the way for groundbreaking advancements in software development and IT solutions.
Despite his demanding professional commitments, Aayush is a firm believer in the importance of work-life balance. An avid traveler and adventurer, he finds solace in exploring new destinations, immersing himself in different cultures, and forging lasting memories along the way. Whether he’s trekking through the Himalayas, diving in the azure waters of the Maldives, or experiencing the vibrant energy of bustling metropolises, Aayush embraces every opportunity to broaden his horizons and create unforgettable experiences.
Aayush’s journey to success is marked by a relentless pursuit of excellence and a steadfast commitment to continuous learning and growth. His academic achievements are a testament to his dedication and passion for excellence, having completed his software engineering with honors and excelling in every department.
At his core, Aayush is driven by a profound passion for analyzing markets and uncovering profitable opportunities amidst volatility. Whether he’s poring over price charts, identifying key support and resistance levels, or providing insightful analysis to his clients and followers, Aayush’s unwavering dedication to his craft sets him apart as a true industry leader and a beacon of inspiration to aspiring traders around the globe.
In a world where uncertainty reigns supreme, Aayush Jindal stands as a guiding light, illuminating the path to financial success with his unparalleled expertise, unwavering integrity, and boundless enthusiasm for the markets.

Ethereum Price Recovery Stalls—Bears Keep Price Below $2K

Cardano (ADA) Downtrend Deepens—Is a Rebound Possible?
Analyst Forecasts 250% Dogecoin Price Rally If This Level Holds

XRP Price Under Pressure—New Lows Signal More Trouble Ahead

Bitcoin Price Swings Wildly—Yet Bears Keep the Upper Hand!

Binance Sidelines Pi Network Again In Vote To List Initiative, Here’s All

2.52 Million Altcoins Are Ruining Crypto’s Future

Animoca Brands Valuation Tanks 75% In Two Years, Here’s Why

Crypto exchange BingX hacked for $43 million

Are The Big Players Losing Interest?

Hong Kong’s Securities Association Tips Authorities On Crypto Self-Regulation

Coinbase cbBTC Set to go Live on Solana
2.52 Million Altcoins Are Ruining Crypto’s Future
Animoca Brands Valuation Tanks 75% In Two Years, Here’s Why
Crypto exchange BingX hacked for $43 million
Are The Big Players Losing Interest?
Hong Kong’s Securities Association Tips Authorities On Crypto Self-Regulation
Coinbase cbBTC Set to go Live on Solana
-

 Market23 hours ago
BNB Price Faces More Downside—Can Bulls Step In?
-

 Market24 hours ago
VanEck Sets Stage for BNB ETF with Official Trust Filing
-

 Bitcoin23 hours ago
Tokenized Gold Market Cap Tops $1.2 Billion as Gold Prices Surge
-

 Regulation18 hours ago
Kraken Obtains Restricted Dealer Registration in Canada
-

 Bitcoin19 hours ago
Lummis Confirms Treasury Probes Direct Buys
-
 Altcoin10 hours ago
First Digital Trust Denies Justin Sun’s Allegations, Claims Full Solvency
-
 Altcoin22 hours ago
What’s Fueling The Shibarium Boost?
-

 Altcoin20 hours ago
Franklin Templeton Eyes Crypto ETP Launch In Europe After BlackRock & 21Shares