
Market
Could Investors Cause Toncoin (TON) Price Correction?

Toncoin’s (TON) price failed to mark a new all-time high despite attempting to breach the key resistance of $7.0.
The likely reason behind this is the declining optimism of investors, which is evident in their behavior.
Toncoin Holders Hold Back
Toncoin’s price is experiencing the effect of declining bullishness among investors. The reason behind this is the lack of conviction among TON holders, which was visible in the downtick of the Mean Coin Age.
Mean Coin Age is a blockchain metric that calculates the average age of all coins by considering the time each coin has remained in its current address. It helps gauge the behavior of long-term holders and overall network stability.
The uptick in this indicator shows investors are holding onto their assets while the downtick hints at supply moving around the addresses. TON has noted a downtick since February, but the broader market cues kept increasing Toncoin’s price.
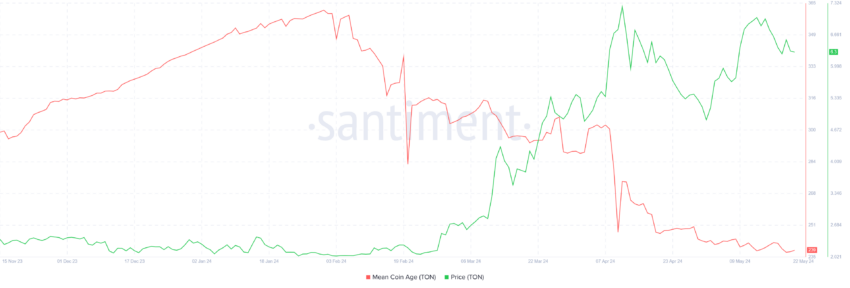
However, with the cues dissipating, the lack of conviction could show its effect on the price action.
But it’s not just the existing investors that are pessimistic; the potential TON holders are not too bullish either. This is evident in the network growth falling to a two-and-a-half-month low.
Network growth is measured by the rate at which new addresses are formed on the network identified by their participation. It assesses whether the asset is gaining or losing traction in the market.
Read More: What Are Telegram Bot Coins?
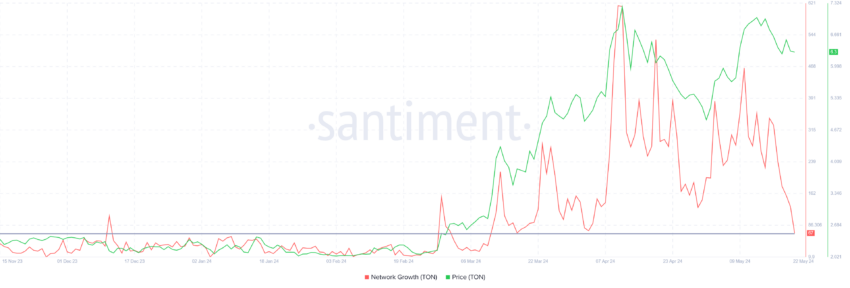
Since this indicator fell by 70% within a week, potential investors do not have much incentive at the moment. This may be reflected in Toncoin’s price action going forward.
TON Price Prediction: Key Support Level to Watch
Toncoin’s price attempted to breach the resistance of $7.0 but failed to trickle back in the last ten days. Consequently, TON fell below the crucial psychological support level of $6.5. A recent broader market rally pushed the altcoin above this support but could not sustain it, falling to trade at $6.2.
This bearishness will loom over Toncoin’s price unless the investors’ behavior changes. As a result, the cryptocurrency could fall to test the support at $6.0. Losing this support could lead to a dip to $5.4.
Read More: 11 Cryptos To Add To Your Portfolio Before Altcoin Season
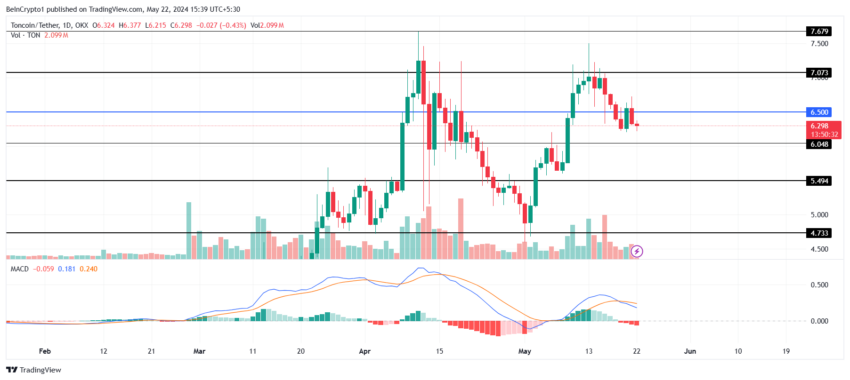
However, if Tocnoin’s price does not fall below the $6.0 support level, it could bounce back to $6.5. Flipping it into a support floor would enable recovery, potentially sending TON to $7, invalidating the bearish thesis.
Disclaimer
In line with the Trust Project guidelines, this price analysis article is for informational purposes only and should not be considered financial or investment advice. BeInCrypto is committed to accurate, unbiased reporting, but market conditions are subject to change without notice. Always conduct your own research and consult with a professional before making any financial decisions. Please note that our Terms and Conditions, Privacy Policy, and Disclaimers have been updated.


SAFE has emerged as the best-performing altcoin of the day, with its price surging 5% in the last 24 hours and its market capitalization now close to $300 million. The coin is showing strong technical indicators despite some mixed signals from momentum oscillators that suggest consolidation may be on the horizon.
Technical analysis of the EMA lines remains bullish, with short-term averages positioned favorably above long-term ones, pointing to continued strength in the immediate term. However, recent RSI and BBTrend readings indicate a potential cooling-off period could be approaching as the asset digests its recent gains.
SAFE RSI Is Back To Neutral Levels After Reaching Overbought Levels
The SAFE RSI is currently at 54.71, maintaining a neutral position for the past three days after experiencing significant momentum earlier in the week.
This moderation in the indicator suggests that the previous buying pressure has subsided somewhat, allowing the asset to consolidate following recent price movements.
The current neutral reading indicates a balanced market where neither buyers nor sellers have a decisive advantage.
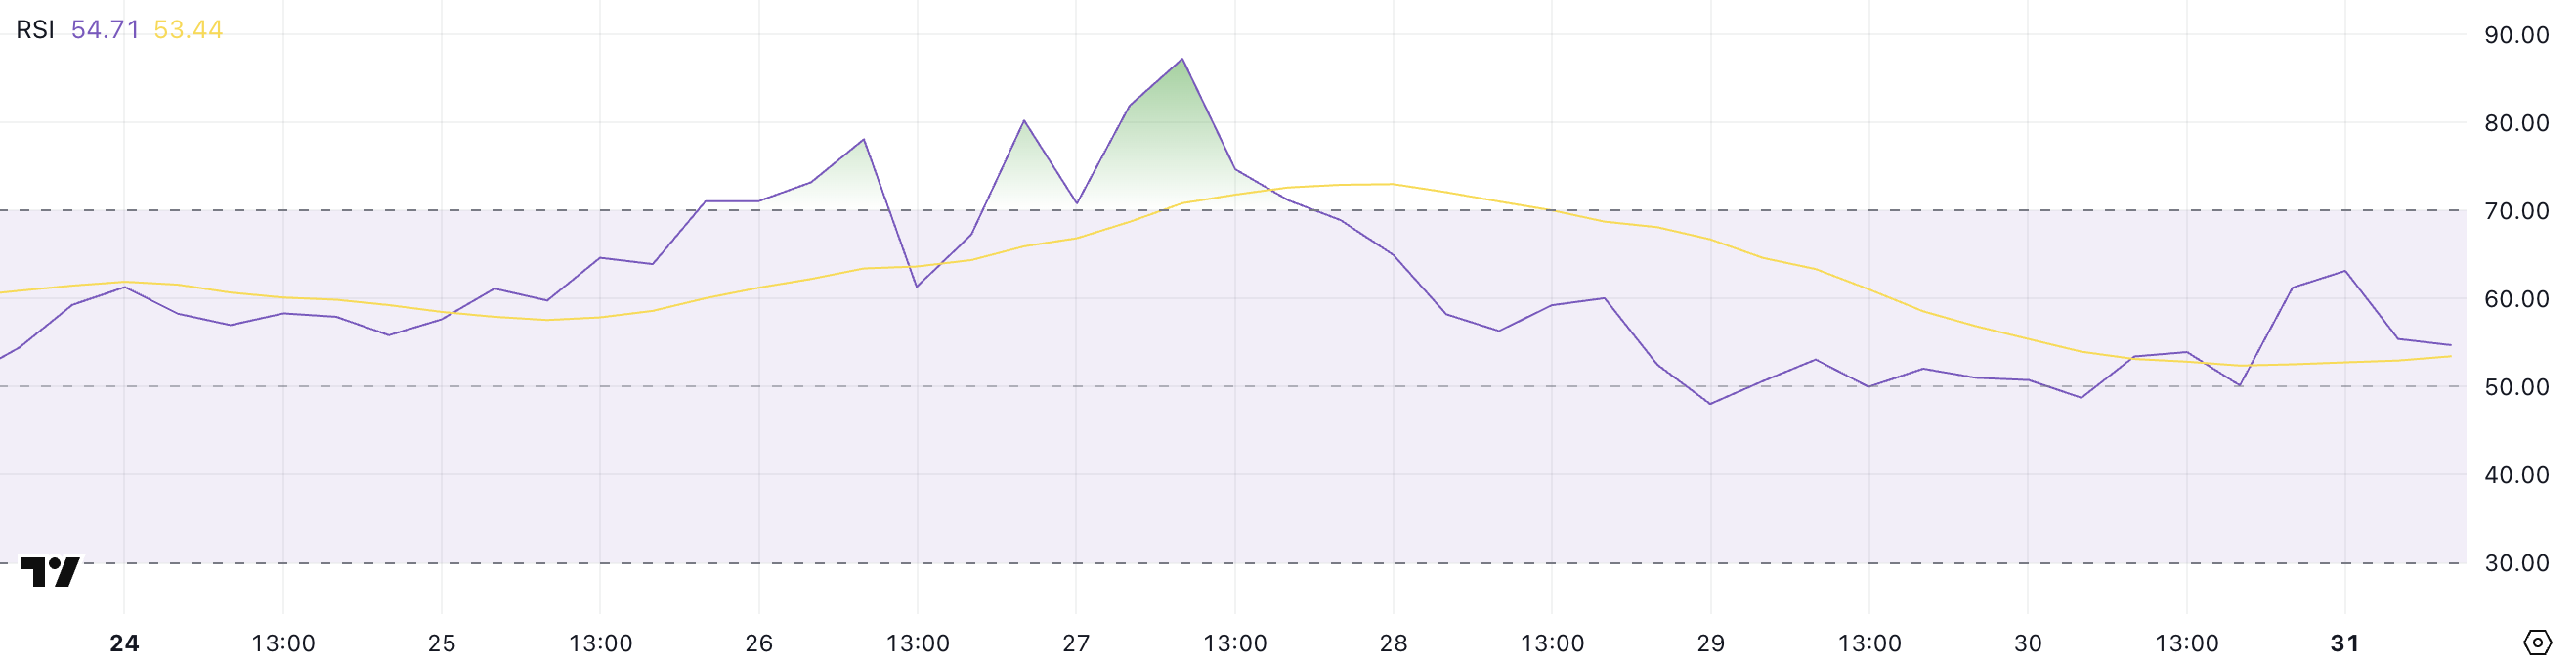
The Relative Strength Index (RSI) is a momentum oscillator that measures the speed and change of price movements on a scale from 0 to 100. Generally, an RSI reading above 70 is considered overbought, suggesting a potential reversal or pullback, while readings below 30 indicate oversold conditions that might precede a bounce.
With SAFE’s RSI recently peaking at 87 just four days ago, the asset was in strongly overbought territory, signaling excessive buying enthusiasm. The current value of 54.71 represents a significant cooling off from those extreme levels, suggesting that SAFE’s price could be entering a period of stabilization.
This moderation may provide a healthier foundation for sustainable price action moving forward, as the previous overbought conditions have been worked through without dropping into oversold territory. This potentially indicates underlying strength in the asset despite the retreat from recent highs.
SAFE BBTrend Is Still High, But Down From Yesterday
The SAFE BBTrend is currently at 13.6, maintaining a positive position for the last two days after reaching a peak of 19.39 yesterday.
This recent positive trend suggests that the price movement has been gaining momentum, though there appears to be some moderation from yesterday’s higher reading.
The continued positive BBTrend indicates that the asset is still showing strength, despite the slight pullback from yesterday’s peak value.
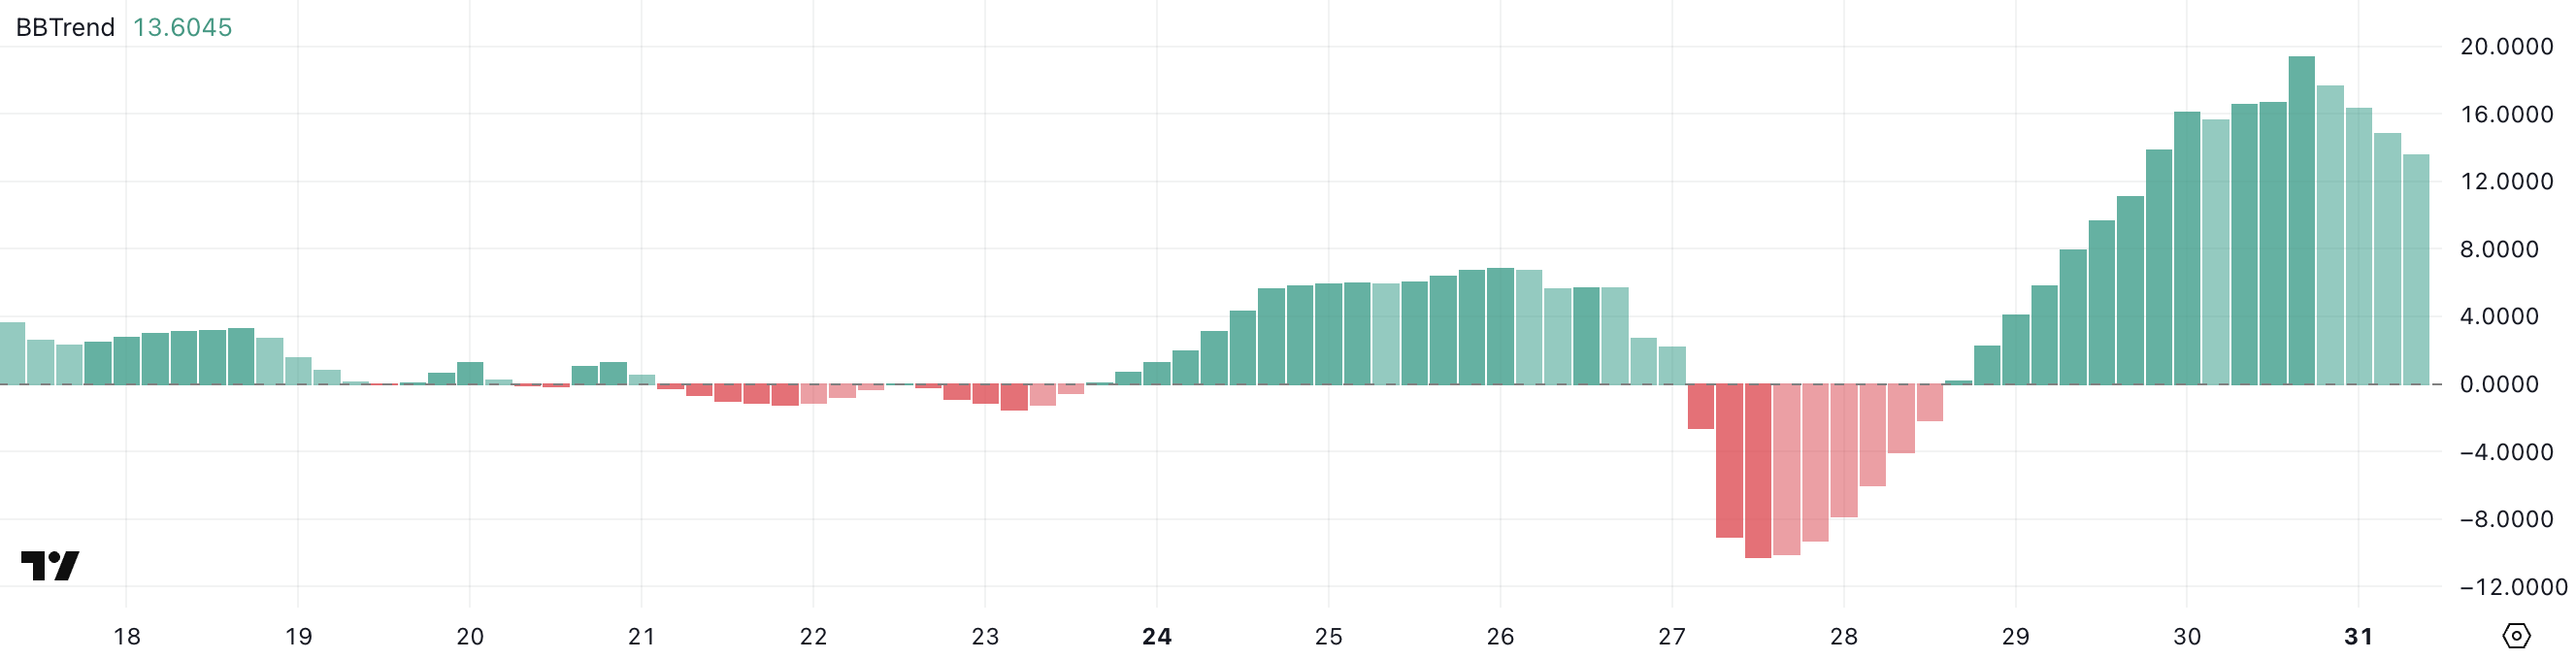
BBTrend (Bollinger Bands Trend) is a technical indicator that measures the strength and direction of a trend by analyzing the relationship between price and Bollinger Bands.
The indicator typically ranges from negative to positive values, with readings above 0 indicating a bullish trend and readings below 0 suggesting a bearish trend. With SAFE’s BBTrend at 13.6, this suggests a moderately strong bullish trend that could indicate potential for continued upward price movement in the near term for the altcoin.
However, the decrease from yesterday’s 19.39 peak might signal some slowing in momentum, potentially leading to consolidation before the next significant move higher.
Will SAFE Uptrend Revert Soon?
SAFE EMA lines are still bullish, with short-term lines positioned above long-term ones. This positive alignment of exponential moving averages indicates continued upward momentum in the price action.
If this uptrend momentum maintains its strength, SAFE could potentially climb to test the resistance level at $0.72.
Should this resistance be successfully broken, the next target would be $0.879. The altcoin could exceed $0.90 for the first time since January 19, sustaining its momentum as one of the most trending altcoins.
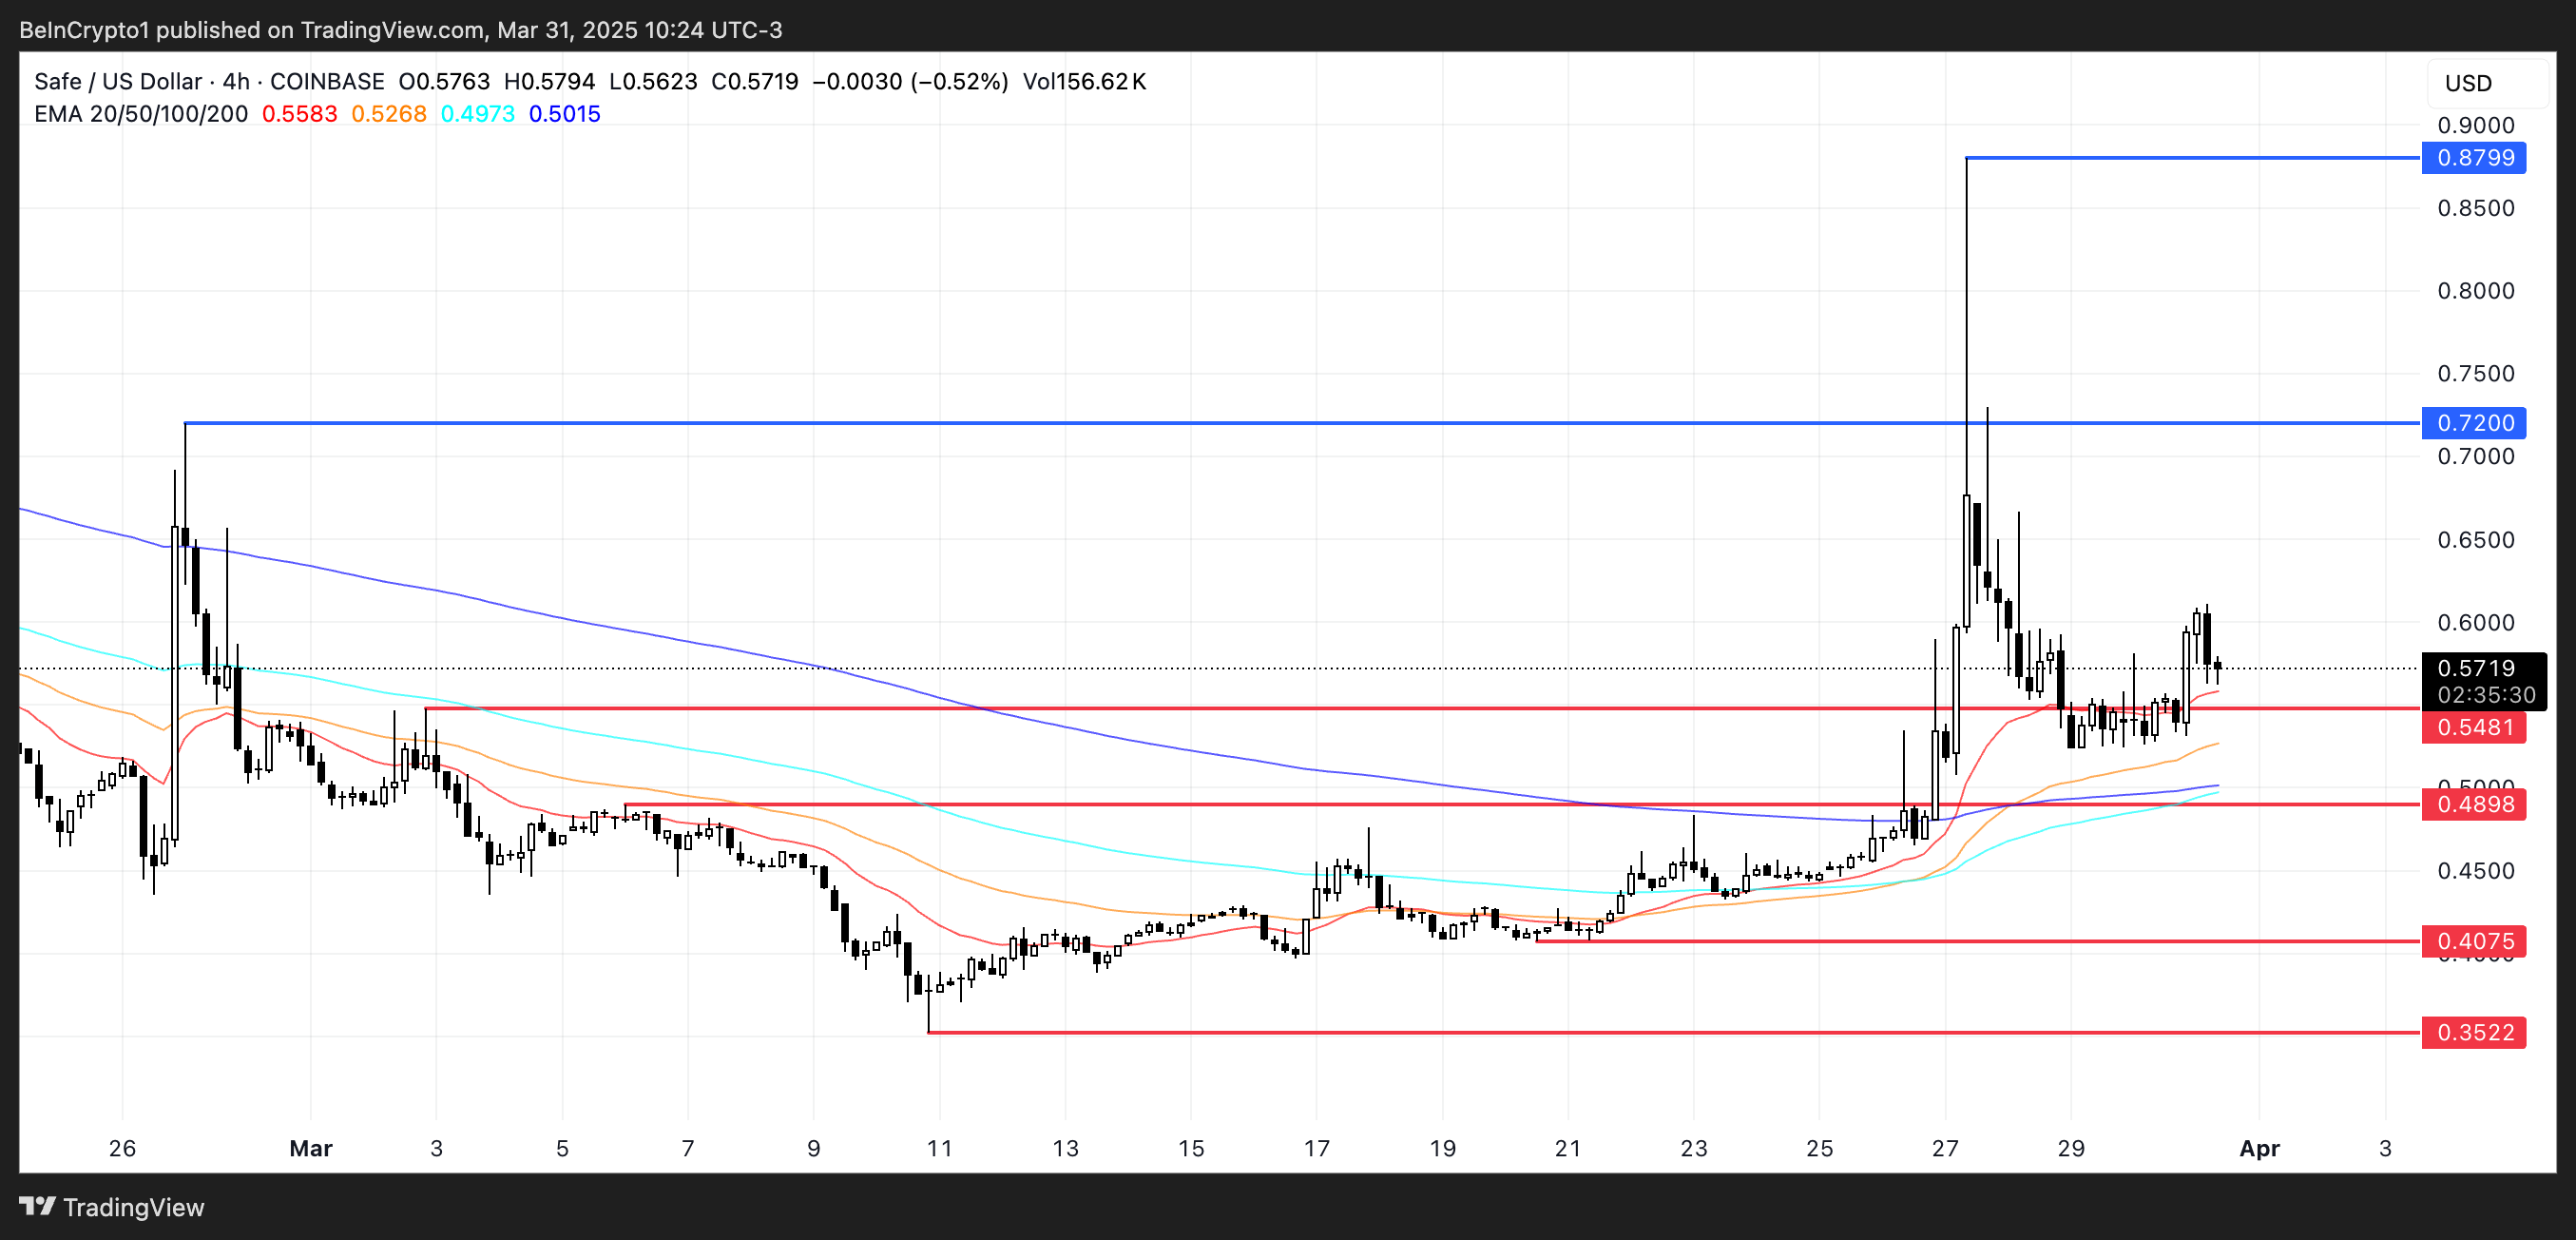
On the other hand, as indicated by the RSI and BBTrend indicators, the uptrend appears to be losing some momentum. This could signal a potential reversal in the near future.
If the trend does reverse, SAFE might test the nearby support level at $0.54, which sits precariously close to the current price.
Should this support level fail to hold, further downside could see SAFE decline to test subsequent support levels at $0.48 and $0.40. In a worst-case scenario, a drop all the way to $0.35 could potentially occur.
Disclaimer
In line with the Trust Project guidelines, this price analysis article is for informational purposes only and should not be considered financial or investment advice. BeInCrypto is committed to accurate, unbiased reporting, but market conditions are subject to change without notice. Always conduct your own research and consult with a professional before making any financial decisions. Please note that our Terms and Conditions, Privacy Policy, and Disclaimers have been updated.

A new report claims that President Trump and his immediate family receive most of WLFI’s revenues. The Trumps are entitled to 75% of token sale revenues, about $400 million, and 60% of other incomes.
If these numbers are even partially accurate, they raise significant concerns about potential conflicts of interest. They also raise questions about the broader implications for transparency and accountability regarding Trump’s crypto policies.
Does the Trump Family Receive WLFI Proceeds?
World Liberty Financial (WLFI), a project affiliated with President Trump, has made a lot of waves in the crypto space since the end of last year. After persistent rumors of a Binance partnership, WLFI officially launched a new stablecoin, USD1. There is no clear evidence of Binance’s involvement in this launch. However, a new report from Reuters has disclosed some disturbing details.
Essentially, it claims that it has found evidence of how much of WLFI’s revenues go directly to Trump’s family. Trump will get 75% of revenues from token sales and 60% from subsequent operations. WLFI completed its major token sale, which would, therefore, entitle the Trumps to about $400 million.
Reuters calculates that 5% of proceeds from this token sale would actually fund WLFI’s platform, with the rest going to other co-founders. Further, its buyers are not able to actually resell their tokens, and it’s unclear what governance actions they could influence. There’s not an apparent reason for the average retail trader to actually buy these assets.
If these numbers are true, they could represent a serious conflict of interest and a dire threat to the US economy. First, community leaders like Vitalik Buterin warned of corruption from political meme coins like TRUMP. If Trump gets a cut of WLFI’s token sales, that’s already a huge avenue for misuse.
Additionally, since Trump is making huge changes to US financial regulators, there may not be anyone to investigate WLFI corruption allegations. For example, TRON founder Justin Sun invested $30 million into WLFI, and the SEC settled a fraud case against him months later. The SEC has been settling all its crypto enforcement actions, but this investment still looks relevant.
“You’ve got the guy in charge who is responsible for his own regulation. WLFI tokens would be the perfect vehicle for governments or oligarchs overseas to funnel money to the president,” former regulator Ross Delston claimed.
The biggest danger might not even come from political corruption or fears of centralization in crypto. Trump recently outlined a plan to use stablecoins to promote dollar dominance, and WLFI now has its own stablecoin. It also has around $111 million in unrealized losses due to its crypto investments and claims it will use “other cash equivalents” in USD1’s reserves.
It’s hard to overstate the potential risks involved. Given Trump’s financial stake in WLFI, there’s a clear incentive to promote the firm’s stablecoin as part of his “dollar dominance” agenda. If this leads to widespread investment in USD1 and the peg doesn’t hold, the consequences could ripple across the entire crypto market.
Simply put, this sort of business arrangement is totally unprecedented for a sitting US President. A few Senators are already investigating Trump’s connections with WLFI. However, their lack of political power and defanged federal regulators may hamper their ability to change anything.
Disclaimer
In adherence to the Trust Project guidelines, BeInCrypto is committed to unbiased, transparent reporting. This news article aims to provide accurate, timely information. However, readers are advised to verify facts independently and consult with a professional before making any decisions based on this content. Please note that our Terms and Conditions, Privacy Policy, and Disclaimers have been updated.
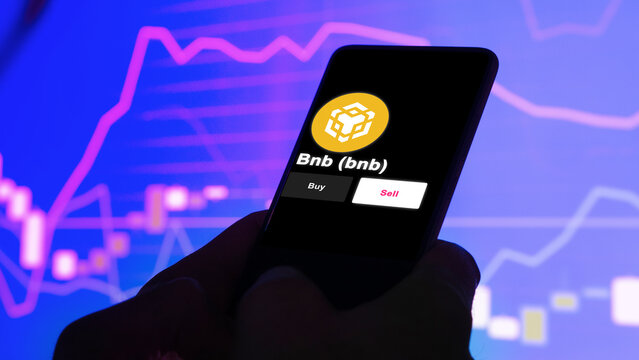
The crypto market just got a shock as BNB plunged below the crucial $605 support level, sending ripples of concern across trading circles. This sudden breakdown comes after weeks of bullish dominance, leaving investors scrambling to answer one critical question: Is this a temporary dip or the start of a major trend reversal?
With weakening momentum and key technical indicators flashing red, BNB charts are telling a worrisome story. The once-steady uptrend now faces its toughest test as the token struggles to maintain its footing in a suddenly bearish market.
Bearish Pressure Builds: Are BNB Sellers Gaining Control?
BNB’s price is facing growing bearish pressure after slipping below the crucial $605 level, signaling a potential shift in market momentum. The failed attempt to hold this key support has allowed sellers to take control, pushing BNB lower and raising concerns about a prolonged decline.
Technical indicators further confirm the increasing strength of sellers. The MACD has turned negative, indicating a loss of upward momentum, while the RSI is trending downward, suggesting that buying pressure is weakening. Additionally, trading volume remains low on attempted rebounds, highlighting a lack of conviction from bulls.
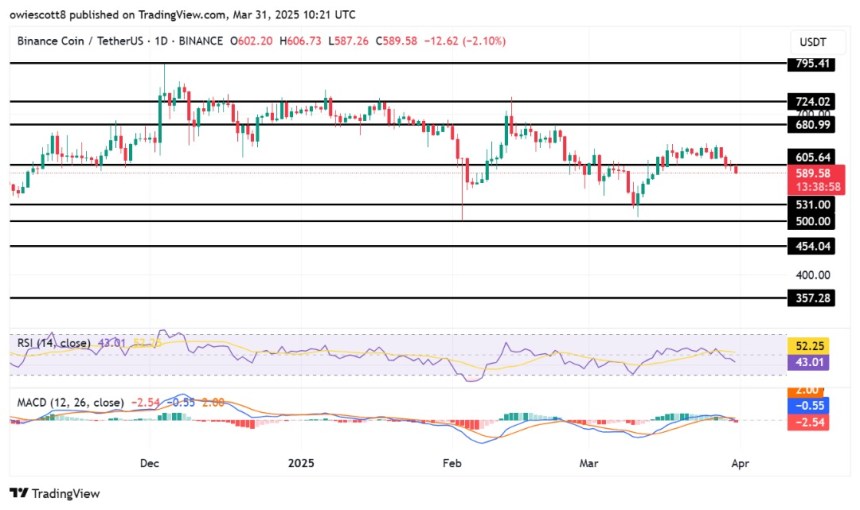
If sellers maintain their grip, BNB could extend its decline toward the next major support zone around $531, which previously served as a short-term bounce level during past corrections. A break below this zone would solidify bearish dominance and cause a deeper decline to $500.
Below $500, the next key level to watch is $454, representing a technical support area. Pushing below this level may trigger an extended sell-off, driving BNB toward other key support levels where traders may look for signs of reversal.
What Needs To Happen For A Rebound
For BNB to stage a meaningful recovery after breaking below $605, the bulls must reclaim key levels and generate strong buying momentum. Its first crucial step is stabilizing above $530, a short-term support zone that could provide the foundation for a reversal. Holding this level would signal that buyers are stepping in, preventing more declines.
A sustained move back above $605 would be the next major confirmation of a recovery. Reclaiming this level as support might shift market sentiment in favor of the bulls and trigger renewed buying interest. Additionally, the Relative Strength Index (RSI) needs to rebound from oversold conditions, while the MACD crossover into bullish territory would reinforce an upside move.
For a stronger bullish outlook, BNB would need to push past $680, a level that previously acted as resistance. Breaking above this zone with increasing volume could confirm a trend reversal toward $724 and $795, marking a full recovery from recent losses.

Elon Musk Rules Out The Use Of Dogecoin By The US Government

Market Cap Now Approaching $300 Million

Ethereum’s Price Dips, But Investors Seize The Opportunity To Stack Up More ETH
Trump Family Gets Most WLFI Revenue, Causing Corruption Fears

BNB Breaks Below $605 As Bullish Momentum Fades – What’s Next?
Strategy Adds 22,048 BTC for Nearly $2 Billion

2.52 Million Altcoins Are Ruining Crypto’s Future

Animoca Brands Valuation Tanks 75% In Two Years, Here’s Why

Crypto exchange BingX hacked for $43 million

Are The Big Players Losing Interest?

Hong Kong’s Securities Association Tips Authorities On Crypto Self-Regulation

Coinbase cbBTC Set to go Live on Solana
2.52 Million Altcoins Are Ruining Crypto’s Future
Animoca Brands Valuation Tanks 75% In Two Years, Here’s Why
Crypto exchange BingX hacked for $43 million
Are The Big Players Losing Interest?
Hong Kong’s Securities Association Tips Authorities On Crypto Self-Regulation


