
Bitcoin
Bitcoin Holders Resume Buying After Market Sell-Off
The basic laws of supply and demand determine the price action of any asset, including Bitcoin. When supply exceeds demand, the asset’s price tends to decline. Conversely, when demand outstrips supply, the price usually rises.
These same principles apply to cryptocurrencies, and on-chain metrics can provide valuable insights into Bitcoin holders’ behavior.
The Impact of Heightened Profit-Taking
When analyzing a Bitcoin bull market over the long term, the price movement typically exhibits significant upward volatility, mixed with periods of corrections and consolidation. Most investors know that financial markets do not consistently rise, leading to a dynamic interplay between supply and demand, resulting in periodic corrections.
This trend is evident when observing Bitcoin’s Realized Cap and Realized Profits.
- Realized Cap: This adds up the value of all BTC based on the price when they were last moved, giving a clearer picture of the money truly invested in Bitcoin.
- Realized Profits: This refers to the actual gains that BTC holders have made when they sell their Bitcoin for more than they paid.
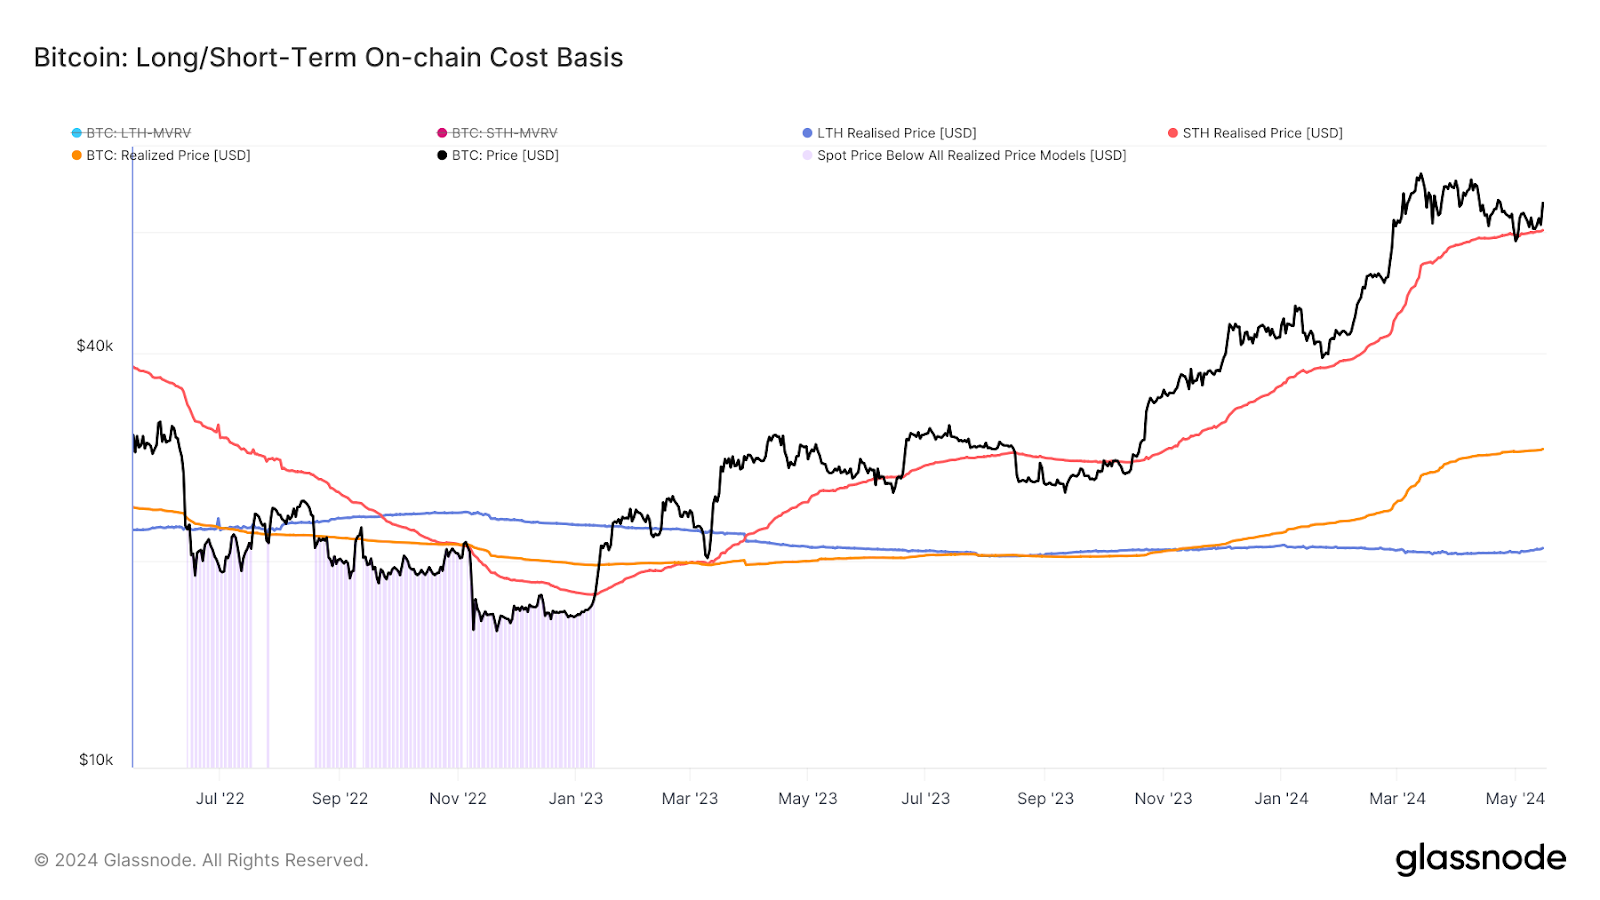
As Bitcoin reached a new all-time high of over $73,000 in mid-March, its Realized Cap also increased, suggesting that most long-term holders were profitable. Consequently, some exited their positions, resulting in a significant spike in Realized Profits.

The rising supply of BTC on the market surpassed the demand levels, leading to a corrective phase that saw the price of Bitcoin dip below $57,000. This drop brought Bitcoin below its Short-Term Holder Realized Price, creating a sense of fear in the market, given that short-term holders are more prone to sell based on price volatility.
- Realized Price: The average price at which all BTC were last bought. It is like finding out the average cost everyone paid for their BTC.
- Short-Term Holder Realized Price: The average price investors paid for BTC that they have moved around in the last 155 days. These BTC are the ones most likely to be spent or sold soon.
- Long-Term Holder Realized Price: The average price investors paid for BTC that they have not moved in over 155 days. These BTC are the least likely to be spent or sold soon.
The Short-Term Holder Realized Price, which currently stands at $60,500, served as an accumulation point despite investors’ fears. Indeed, long-term holders felt comfortable adding more BTC to their positions at this level after realizing profits in March.
Bitcoin Supply-Demand Trends Shift
Bitcoin’s Long-Term Holder Net Position Change provides a glimpse into this behavior. After undergoing a prolonged distribution period, long-term holders have begun accumulating again, having amassed more than 70,000 BTC since early May.
- Long-Term Holder Net Position Change: It shows how the amount of Bitcoin held by long-term investors increases or decreases over time.
Based on the simple laws of supply and demand, as demand for Bitcoin begins to outstrip the available supply of BTC in the market, the odds of Bitcoin resuming its upward trajectory improve.
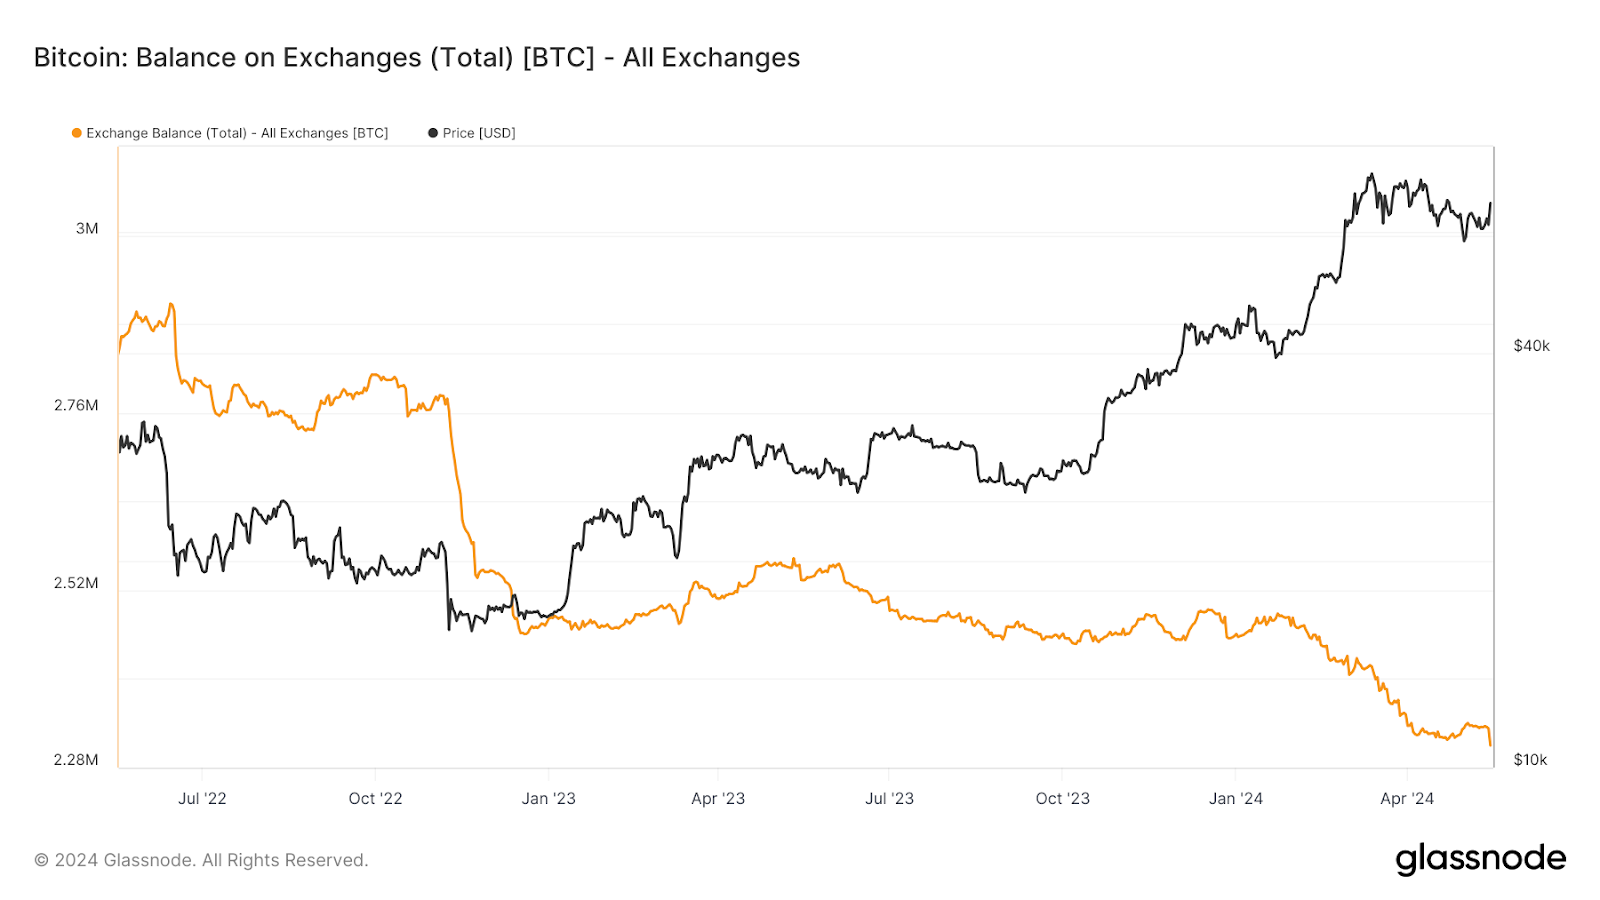
Observing Bitcoin’s Balance on Exchanges can corroborate these supply and demand dynamics.
- Balance on Exchanges: This refers to the total amount of Bitcoin held in cryptocurrency exchange wallets.
Since early May, more than 30,000 BTC have moved to private cryptocurrency wallets for long-term holding, showing confidence among holders in Bitcoin’s future value.
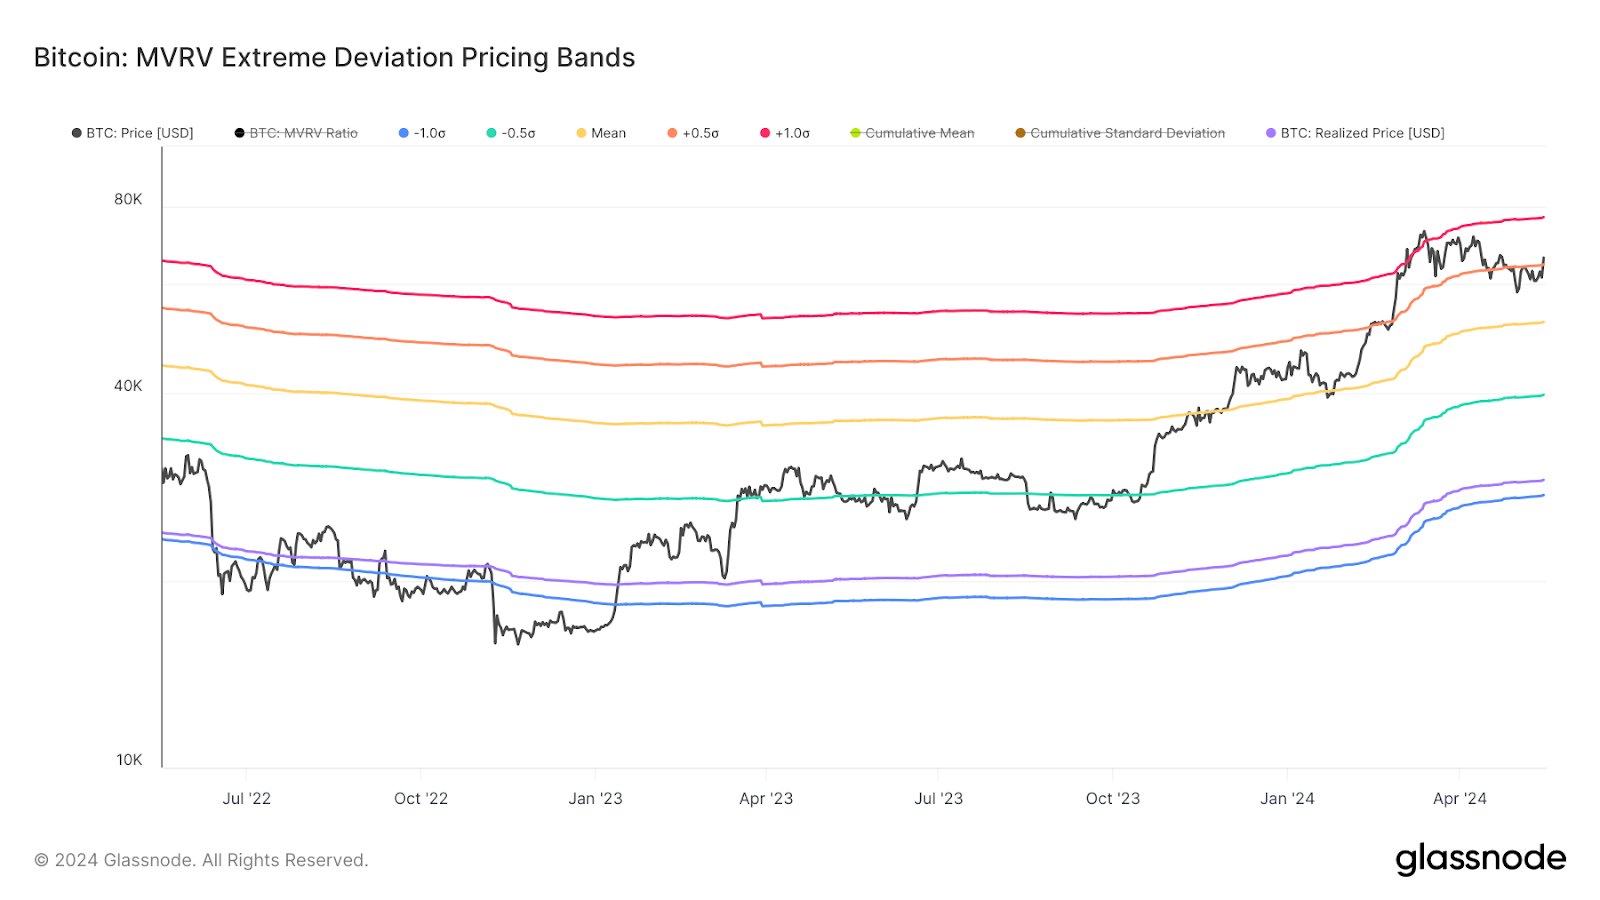
While assessing the future price action of any asset can be challenging, multiple on-chain metrics can hint at potential price points investors should pay attention to. One of these metrics is the MVRV Extreme Deviation Pricing Bands, which determines whether the price of Bitcoin is unusually high or low based on its historical averages.
- MVRV: It stands for Market Value to Realized Value. Market Value is the current price of Bitcoin times the number of BTC in circulation, while Realized Value is the average price at which all BTC were last bought.
- Pricing Bands: These bands show the upper and lower limits of Bitcoin’s price based on its historical MVRV values to help identify when Bitcoin is either extremely overvalued or undervalued based on historical price data.
Bitcoin recently moved back above the +0.5σ pricing band, which currently stands at $64,600. Historically, such an upswing has led Bitcoin to test the 1.0σ pricing band supported by rising demand. This pricing band is currently hovering around $77,000.
Read more: Bitcoin Price Prediction 2024/2025/2030
Summary and Conclusions
The basic laws of supply and demand dictate Bitcoin’s price movements. Indeed, prices fall when supply exceeds demand and rise when demand exceeds supply. On-chain metrics offer valuable insights into these dynamics, allowing analysts to understand Bitcoin holders’ behavior.
Recent data reveals a price decline below $57,000 as supply increased. However, long-term holders have demonstrated confidence by accumulating over 70,000 BTC since early May. This trend suggests resilience in the market despite short-term volatility.
Key metrics like Realized Cap and Realized Profits illustrate that many long-term holders were profitable at Bitcoin’s recent all-time high, leading to a wave of selling and subsequent price corrections. However, the accumulation by long-term holders at lower prices indicates a positive outlook for Bitcoin’s future value.
Read more: How To Buy Bitcoin (BTC) and Everything You Need To Know
Overall, these on-chain metrics help identify shifts in supply and demand, providing a framework to understand Bitcoin’s price action and investor behavior and indicating potential upward trends as demand begins to outstrip supply.
Disclaimer
In line with the Trust Project guidelines, this price analysis article is for informational purposes only and should not be considered financial or investment advice. BeInCrypto is committed to accurate, unbiased reporting, but market conditions are subject to change without notice. Always conduct your own research and consult with a professional before making any financial decisions. Please note that our Terms and Conditions, Privacy Policy, and Disclaimers have been updated.


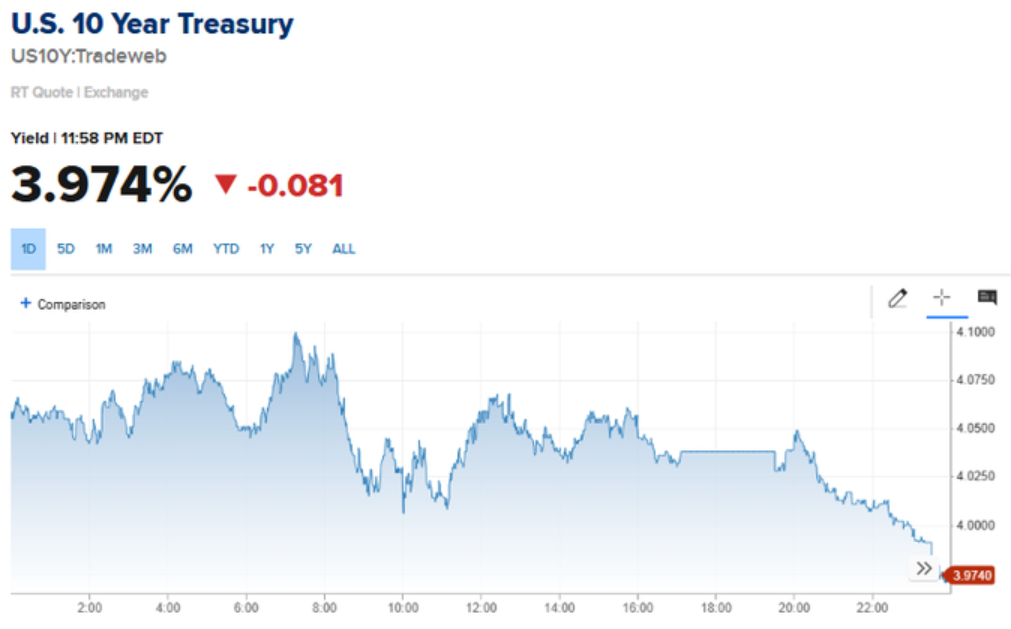
The US 10-year Treasury yield has fallen below 4% for the first time since October.
This signals a potential shift in Federal Reserve (Fed) policy, sparking renewed interest in Bitcoin (BTC) and other risk assets.
Treasury Yields and Bitcoin: A Risk-On Rotation?
As highlighted by financial markets aggregator Barchart, this decline reflects growing economic uncertainty. Specifically, it suggests rising recession fears and increasing speculation that the Fed may pivot to rate cuts sooner than expected.
A drop in Treasury yields reduces the attractiveness of traditional safe-haven assets like bonds, often encouraging investors to seek higher returns elsewhere.
Historically, Bitcoin and altcoins have benefitted from such shifts, as declining real yields increase liquidity and risk appetite. Crypto analyst Dan Gambardello emphasized this connection. He noted that lower yields are bullish for Bitcoin, aligning with expectations that a dovish Fed will drive liquidity into riskier assets.
“The irony is that when yields fall, there’s less reason to sit in “safe” bonds— And ultimately more reason to chase returns in risk assets like BTC and alts. This is why you see risk-on bulls get excited when 10-year yields begin falling,” he stated.
Additionally, BitMEX founder and former CEO Arthur Hayes pointed out that the 2-year Treasury yield sharply declined after the new tariffs were introduced. He said this reinforced the market’s expectation of imminent Fed rate cuts.
“We need Fed easing, the 2yr treasury yield dumped after Tariff announcement because the market is telling us the Fed will be cutting soon and possibly restarting QE to counter -ve economic impact,” Hayes shared on X (Twitter).
Hayes previously projected that Bitcoin could surge as high as $250,000 if quantitative easing (QE) returns in response to economic downturns.
The Trump Factor: Tariffs and Market Volatility
Further, analysts have tied the yield drop to economic uncertainty triggered by Trump’s aggressive tariff strategy. As Gambardello noted, these tariffs have spurred a flight to safety, pushing bond prices higher and lowering yields.
This trend aligns with Trump’s broader economic approach of weakening the dollar and lowering interest rates, which historically benefit Bitcoin. During his first term, Trump frequently desired a weaker dollar and lower interest rates to boost exports and economic growth. He also pressured the Fed to cut rates multiple times.
Another analyst, Kristoffer Kepin, highlighted that the M2 money supply is growing. This reinforces expectations of increased liquidity entering the market further. This influx of capital could flow into Bitcoin and altcoins as investors seek alternative stores of value amid economic turbulence.
Despite Bitcoin’s potential upside, Goldman Sachs has recommended gold and the Japanese yen as preferred hedges against US recession risks. Specifically, the bank cited its historical performance in risk-off environments.
“The yen offers investors the best currency hedge should the chances of a US recession increase,” Bloomberg reported, citing Kamakshya Trivedi, head of global foreign exchange, interest rates, and emerging market strategy at Goldman Sachs.
The bank expressed the same sentiment toward gold, raising its forecast as investors buy the yellow metal. Similarly, a Bank of America (BofA) survey showed that 58% of fund managers prefer gold as a trade war haven, while only 3% back Bitcoin.
Meanwhile, JPMorgan has raised its global recession probability to 60%. Likewise, the multinational banking and financial services company attributed the increased risk to the economic shock from tariffs announced on Liberation Day.
“These policies, if sustained, would likely push the US and possibly global economy into recession this year,” wrote head of global economic research Bruce Kasman in a note late Thursday.
However, Kasman acknowledged that while a scenario where the rest of the world muddles through a US recession is possible, it is less likely than a global downturn.
As Treasury yields continue to fall and economic uncertainty mounts, the Fed becomes a key watch for investors for signs of a policy shift.
If rate cuts and liquidity injections materialize, Bitcoin could see substantial gains, particularly as traditional assets undergo re-pricing. However, as experts caution, short-term volatility remains a key risk factor amidst these market shifts.
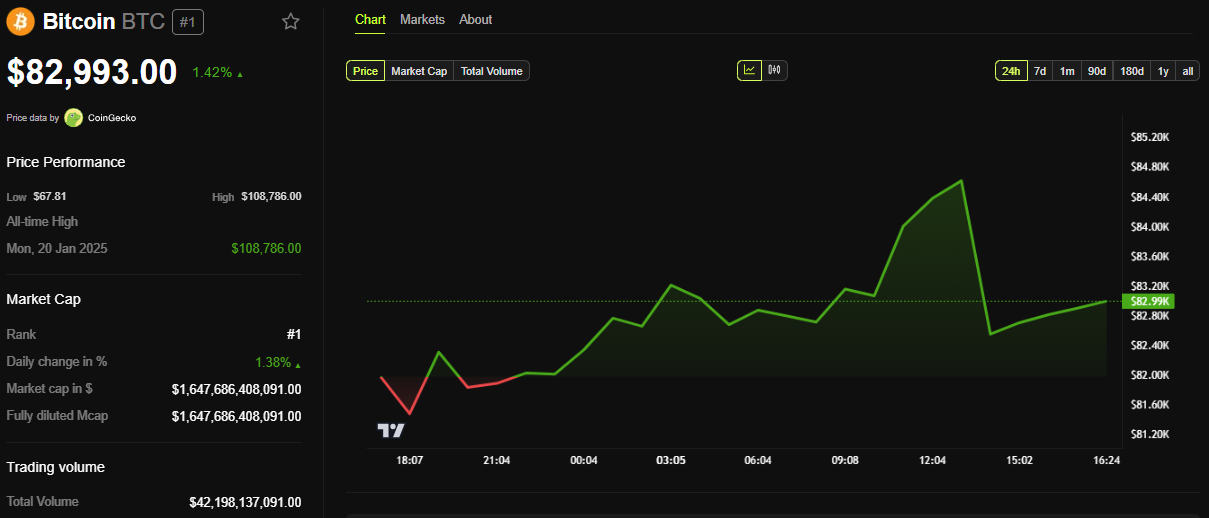
BeInCrypto data shows Bitcoin was trading for $82,993 as of this writing, up by a modest 1.42% in the last 24 hours.
Disclaimer
In adherence to the Trust Project guidelines, BeInCrypto is committed to unbiased, transparent reporting. This news article aims to provide accurate, timely information. However, readers are advised to verify facts independently and consult with a professional before making any decisions based on this content. Please note that our Terms and Conditions, Privacy Policy, and Disclaimers have been updated.

On April 4, 2025, China responded to the latest US tariff imposition by imposing an additional 34% tariff on all goods imported from the US. This escalates the already tense trade war between the two largest economies in the world.
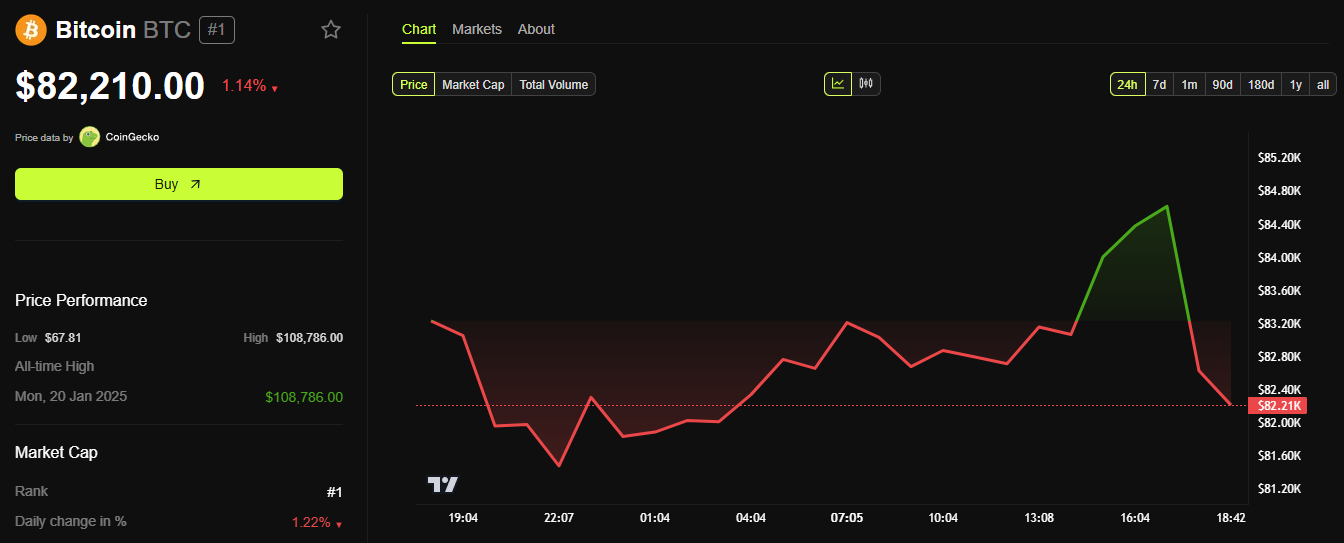
Bitcoin dropped 3% within hours of the announcement, briefly falling below $82,000. This latest development has caused concern among investors, analysts, and participants in the cryptocurrency sector about its potential impact.
Bitcoin Investors Worry About The Escalating Trade War
According to Xinhua News Agency, China will impose a 34% tariff on all products imported from the US starting April 10. Xinhua reported that the US’s “Reciprocal Tariff” violated WTO rules, severely damaging the legal and legitimate rights of WTO members and undermining the multilateral trade system and the international trade order based on rules.
“This is a typical act of unilateral hegemony that harms the stability of the global economic and trade order. China firmly opposes this,” The spokesperson for the Ministry of Commerce said in an interview about China’s lawsuit against the US’s “Reciprocal Tariff” at the WTO.
Previously, President Trump had imposed a 34% tariff on China in addition to the 20% tariffs already imposed in two phases. This means a total of 54% tariffs were applied to China.
News from China has caused concern among crypto investors. On April 4, Bitcoin’s price dropped from $84,600 to $82,000, a 3% decrease.
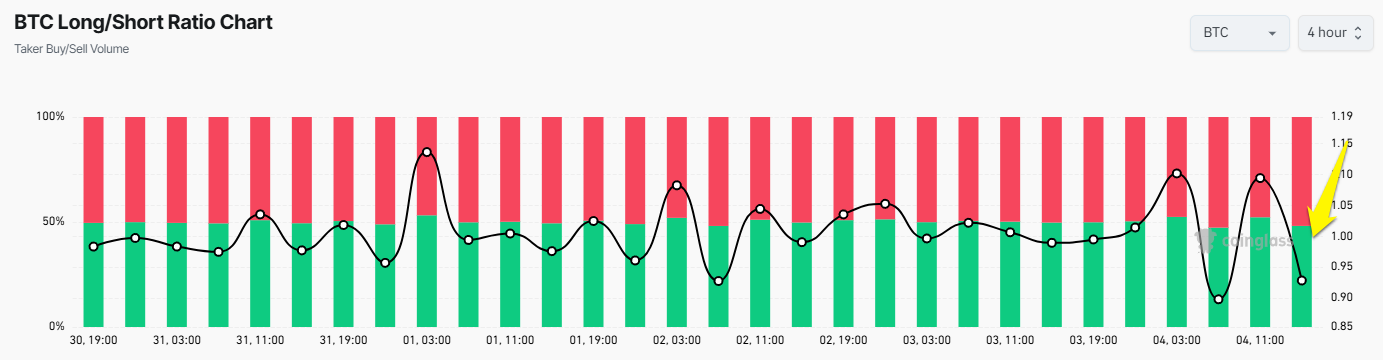
At the same time, following the news, the Long/Short ratio of Bitcoin dropped below 1, indicating a growing sentiment for short-selling, which has become dominant in the market.
Both Bitcoin and other markets have been affected. The S&P 500 fell from 5,260 points to 5,250 points, while the Dow Jones Industrial Average dropped from 41,100 points to 40,500 points. China’s actions have raised concerns about the potential escalation of the global trade war.
“The ‘Third World War’ of the trade war has begun,” The Kobeissi Letter commented.
What Will Happen to Bitcoin When The US-China Trade War Escalates?
This cryptocurrency, often praised as a hedge against economic instability, tends to behave like a risky asset during sudden uncertain periods. Historical patterns support this reaction—during the US-China trade war in 2018-2019, Bitcoin experienced significant sell-offs as tariffs escalated, only recovering when the narrative of value preservation took precedence.
A significant portion of the global cryptocurrency hardware supply chain comes from China, where companies like Bitmain dominate the production of ASIC mining machines—important devices for Bitcoin mining.
With the US now facing a 34% tariff on technology imports from China, the cost of importing these mining machines is expected to rise dramatically. Bitcoin miners in the US, already facing high energy costs and competitive pressure on hashrate, may see their profits shrink further.
However, the long-term outlook for Bitcoin may not be as bleak as the initial market reaction. Some analysts suggest that prolonged trade wars and economic friction could enhance Bitcoin’s appeal as a decentralized asset unaffected by government intervention. If tariffs lead to inflation or weaken fiat currencies like the USD, investors may turn to cryptocurrencies as a safe haven.
“It’s not gold, and it’s not the yen. Instead, Bitcoin is emerging as a risk-dynamic asset – one that doesn’t crumble like high-growth stocks but also doesn’t attract the same flight-to-safety flows as traditional safe havens,” Nexo Dispatch Editor Stella Zlatarev told BeInCrypto.
This sentiment aligns with research indicating that instability often causes initial price drops but can pave the way for growth as acceptance increases.
Disclaimer
In adherence to the Trust Project guidelines, BeInCrypto is committed to unbiased, transparent reporting. This news article aims to provide accurate, timely information. However, readers are advised to verify facts independently and consult with a professional before making any decisions based on this content. Please note that our Terms and Conditions, Privacy Policy, and Disclaimers have been updated.

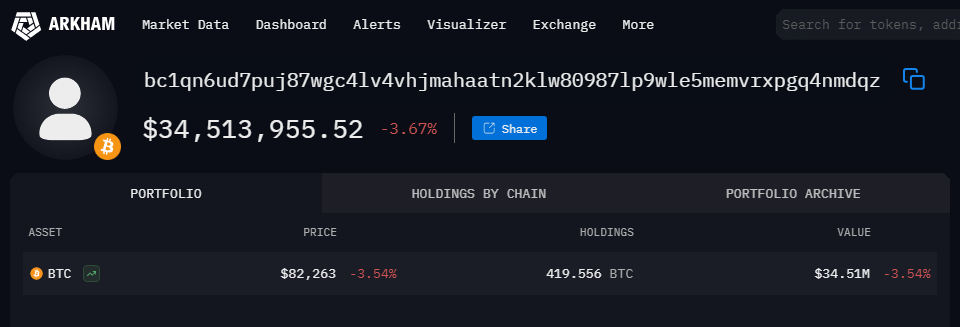
A series of Bitcoin transfers from wallets linked to the Bhutanese government has caught the attention of cryptocurrency watchers. According to blockchain data from Arkham, addresses tied to Druk Holdings, the commercial arm of Bhutan’s government, moved 419.5 Bitcoin worth approximately $34.51 million to an unidentified address on April 2.
Government Wallets Transfer Large Sum To New Address
Based on reports from Arkham, a blockchain analytics platform, two separate wallets believed to belong to the Bhutanese government participated in the transfer. The main Bitcoin holding wallet sent 377.8 BTC ($32.11 million) to a new address identified only as “bc1qn6.” A second wallet, labeled “34oXLr,” contributed an additional 41.7 BTC ($3.5 million) to the same destination.

Source: Arkham
The funds remain in the new wallet at the time of this report. This movement follows a larger transfer last week when the government reportedly shifted 1,664 BTC ($144.57 million) to several different addresses.
Bhutan Maintains Significant Crypto Holdings
The Royal Government of Bhutan owns significant Bitcoin holdings, despite recent sales. Bhutan, based on Bitcoin Treasuries data, owns 13,029 BTC at a value of $1,061,269,247. This puts the nation fourth in total Bitcoin owned among countries, just behind El Salvador.
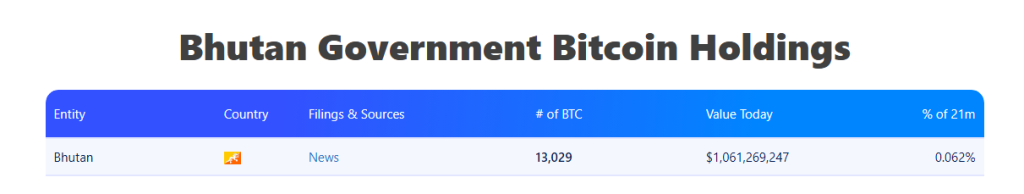
Source: Bitcoin Treasuries
The landlocked Buddhist-majority country has emerged as an offbeat contributor to the cryptocurrency world. Bhutan reportedly mines Bitcoin by leveraging its abundant hydroelectric resources. This most recent stockpile of cryptocurrency constitutes a sizable portion of the total economy — 31% of the country’s gross domestic product (GDP), estimated at nearly $3 billion.
Market Response Following The News
The cryptocurrency market appears unaffected by Bhutan’s Bitcoin movements. According to price data, Bitcoin recovered from a low of $81,014 to reach $82,005 before slightly pulling back. This represents a 2.5% rebound within a day.
The leading cryptocurrency traded at $82,401 at the time of the report, showing a nearly 1% increase over 24 hours. If this upward trend continues, Bitcoin could achieve its third consecutive positive daily close for the first time since early January.
While Bhutan has been selling off its Bitcoin for profit, the United States is seeking to stop all sales of their balance and even expand it. Interestingly, US President Donald Trump signed an executive order last month to establish a strategic Bitcoin reserve for the nation. In the meantime, senator Cynthia Lummis has filed the Bitcoin Act, seeking to acquire 1 million BTC for the nation.
Featured image from AD, chart from TradingView
Editorial Process for bitcoinist is centered on delivering thoroughly researched, accurate, and unbiased content. We uphold strict sourcing standards, and each page undergoes diligent review by our team of top technology experts and seasoned editors. This process ensures the integrity, relevance, and value of our content for our readers.

HBAR Futures Traders Lead the Charge as Buying Pressure Grows

Why Bitcoin Is Gaining Appeal Amid Falling US Treasury Yields

Bitcoin is Far From a Bear Market But not Altcoins, Analysts Claim

Bitcoin Drops as China Escalates Trade War With 34% Tariff on US
Cardano Price Recovery Next As Whales Buy 230 Million ADA

Fresh $36M Bitcoin Transfer By Bhutan Sparks Speculation—Dump Alert?

2.52 Million Altcoins Are Ruining Crypto’s Future

Animoca Brands Valuation Tanks 75% In Two Years, Here’s Why

Crypto exchange BingX hacked for $43 million

Are The Big Players Losing Interest?

Hong Kong’s Securities Association Tips Authorities On Crypto Self-Regulation

Coinbase cbBTC Set to go Live on Solana
2.52 Million Altcoins Are Ruining Crypto’s Future
Animoca Brands Valuation Tanks 75% In Two Years, Here’s Why
Crypto exchange BingX hacked for $43 million
Are The Big Players Losing Interest?
Hong Kong’s Securities Association Tips Authorities On Crypto Self-Regulation
Coinbase cbBTC Set to go Live on Solana
-
 Regulation24 hours ago
US Senate Banking Committee Approves Paul Atkins Nomination For SEC Chair Role
-

 Market22 hours ago
Binance Managed 94% of All Crypto Airdrops and Staking Rewards
-
 Regulation21 hours ago
US SEC Acknowledges Fidelity’s Filing for Solana ETF
-

 Market19 hours ago
Wormhole (W) Jumps 10%—But Is a Pullback Coming?
-
 Altcoin19 hours ago
Altcoin Season Still In Sight Even As Ethereum Struggles To Gain Upward Momentum
-

 Market23 hours ago
Pi Network Price Falls To Record New Low Amid Weak Inflows
-

 Market21 hours ago
XRP Battle Between Bulls And Bears Hinges On $1.97 – What To Expect
-

 Market20 hours ago
Ripple Shifts $1B in XRP Amid Growing Bearish Pressure