
Market
Potential 21% Price Rise Ahead?
Dogecoin’s (DOGE) price is primed to see gains as the recent increase in price has triggered recovery.
The short liquidations observed in the last 24 hours have generally been followed by a rise, which might also be the case this time.
Will Dogecoin Bears Step Back?
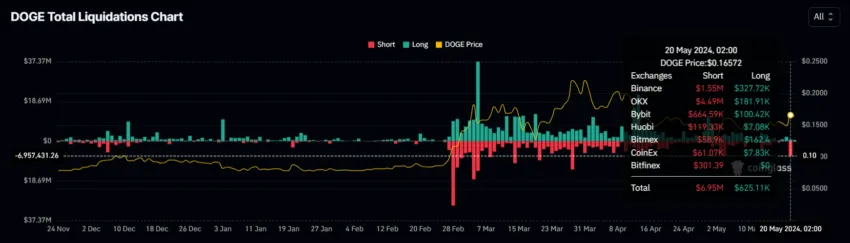
Dogecoin’s price rose by 11% in the past day when the entire crypto market rallied, bringing the meme coin to trade at $0.163. This led to the traders who were pining for a price fall losing their money, as evident in the short liquidations worth nearly $7 million.
This is the largest single-day short liquidation in more than two months. Historically, such large liquidations have seen rises in the following days, and the same is anticipated presently. This liquidation may also result in the bears backing off as investors await a rally.
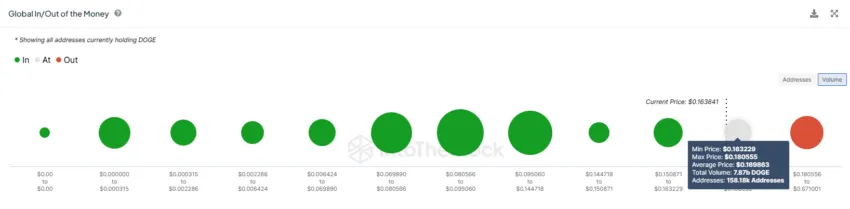
Investors’ optimism is fueled by the $1.28 billion worth of profits they will witness. According to the Global In/Out of the Money (GIOM) indicator, about 7.87 billion DOGE were bought between $0.16 and $0.18.
This supply could turn profitable soon since Dogecoin’s price is exhibiting bullish signs. However, this would warrant a breach of the $0.16 resistance level. Since DOGE holders are close to noting such huge profits, they will likely act accordingly until the altcoin hits $0.18.
Read More: How To Buy Dogecoin (DOGE) and Everything You Need To Know
This will likely drive the rally.
DOGE Price Prediction: Where Will the Rise Stop?
Dogecoin’s price has moved within an ascending triangle pattern for the past month. The ascending triangle pattern is a bullish continuation pattern characterized by a horizontal resistance line and an upward-sloping trendline. It indicates that buyers are gradually gaining strength, often leading to a breakout above the resistance level.
DOGE is breaking out of this pattern at the time of writing, with volumes declining consistently. However, the pattern will be validated when the meme coin marks a 22% rally to reach $0.20. This crucial price point has been marked as a target per the pattern and also stands as key psychological support.
Read More: Dogecoin (DOGE) Price Prediction 2024/2025/2030
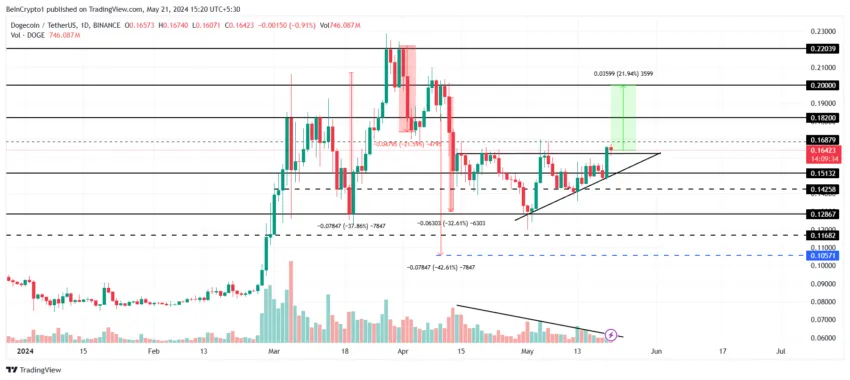
However, the more practical outcome would be Dogecoin’s price breaching $0.18, making the aforementioned supply profitable.
On the other hand, failure to breach $0.16 could lead to a fallback into the pattern. This would turn the breakout into a fakeout, and further decline could send DOGE to $0.15 or lower. Consequently, the bullish thesis would be invalidated.
Disclaimer
In line with the Trust Project guidelines, this price analysis article is for informational purposes only and should not be considered financial or investment advice. BeInCrypto is committed to accurate, unbiased reporting, but market conditions are subject to change without notice. Always conduct your own research and consult with a professional before making any financial decisions. Please note that our Terms and Conditions, Privacy Policy, and Disclaimers have been updated.


Stellar (XLM) has been steadily gaining momentum in recent days, currently trading at $0.52 — a 127% increase over the past week.
Strengthening buying pressure is pushing XLM closer to reclaiming its all-time high of $0.91, which it last reached in January 2018.
Stellar’s Uptrend Continues To Strengthen
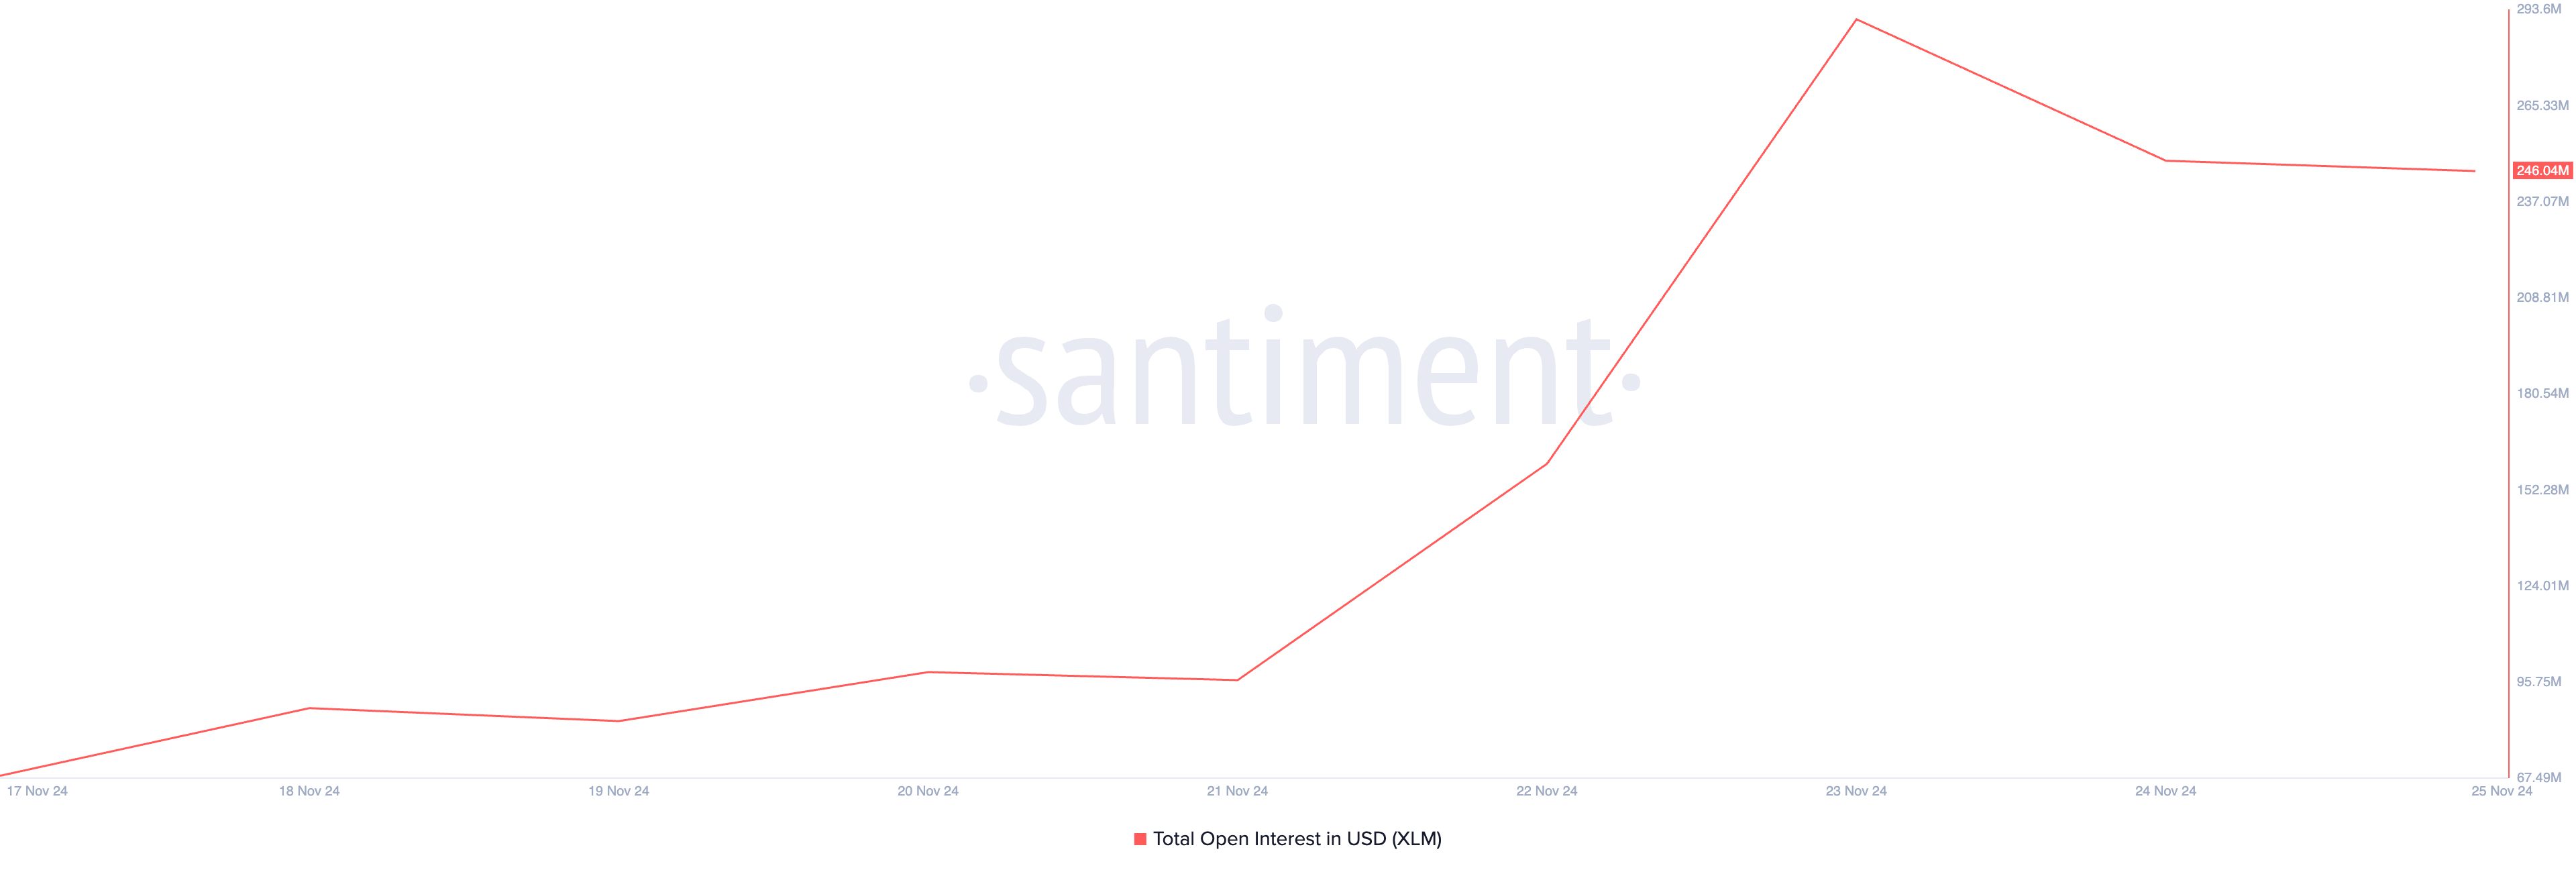
XLM’s rising open interest indicates heightened market activity and confirms strong investor confidence. On Saturday, the token’s open interest climbed to an all-time high of $291 million.
Open interest measures the total number of outstanding contracts in the futures or options market that have not been settled or closed. When it climbs during a price rally, it indicates that new money is entering the market. This reinforces the upward price movement and signals strong market conviction.
This trend in the XLM market suggests that traders are increasingly confident in the sustainability of its rally, which may drive its price higher.
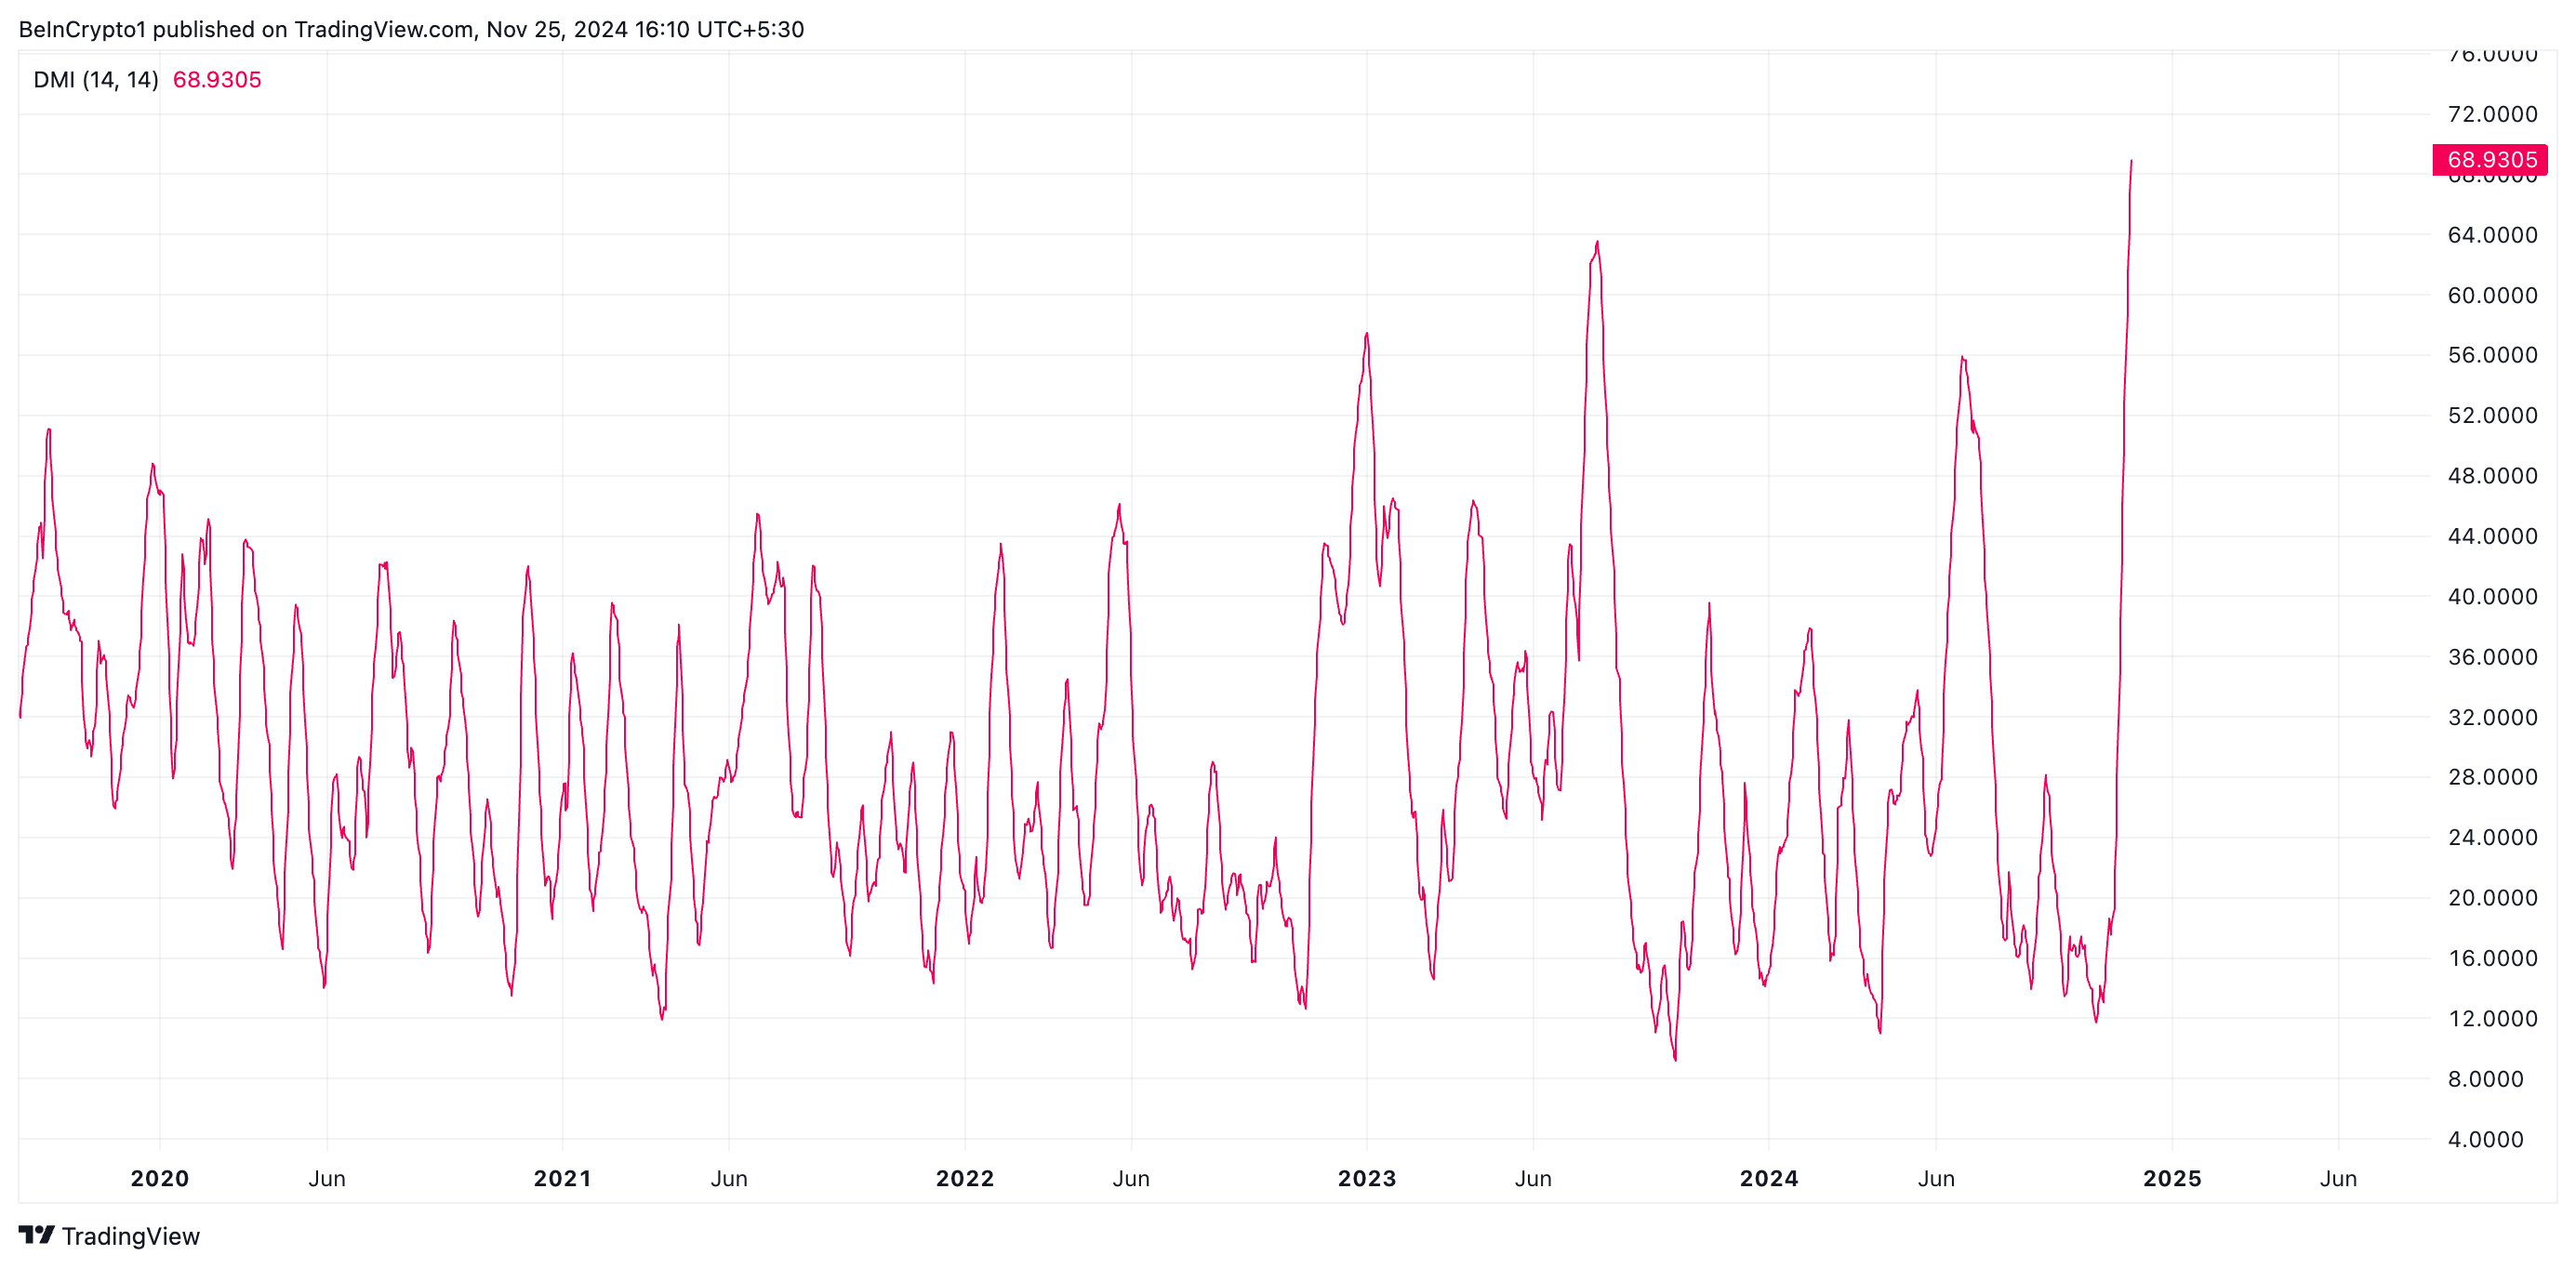
Furthermore, readings from its Average Directional Index (ADX) confirm this bullish outlook. As of this writing, XLM’s ADX is in an upward trend at 68.93.
The ADX measures the strength of a market trend, ranging from 0 to 100. An ADX reading of 68 indicates an extremely strong uptrend. This high value suggests that XLM’s current trend is likely to persist.
XLM Price Prediction: Token May Rally Toward All-Time High
XLM is currently trading just below a key resistance level at $0.58. Breaking through this critical price point could pave the way for a surge to $0.71. Sustained buying momentum at this level may position XLM to reclaim its all-time high of $0.91.
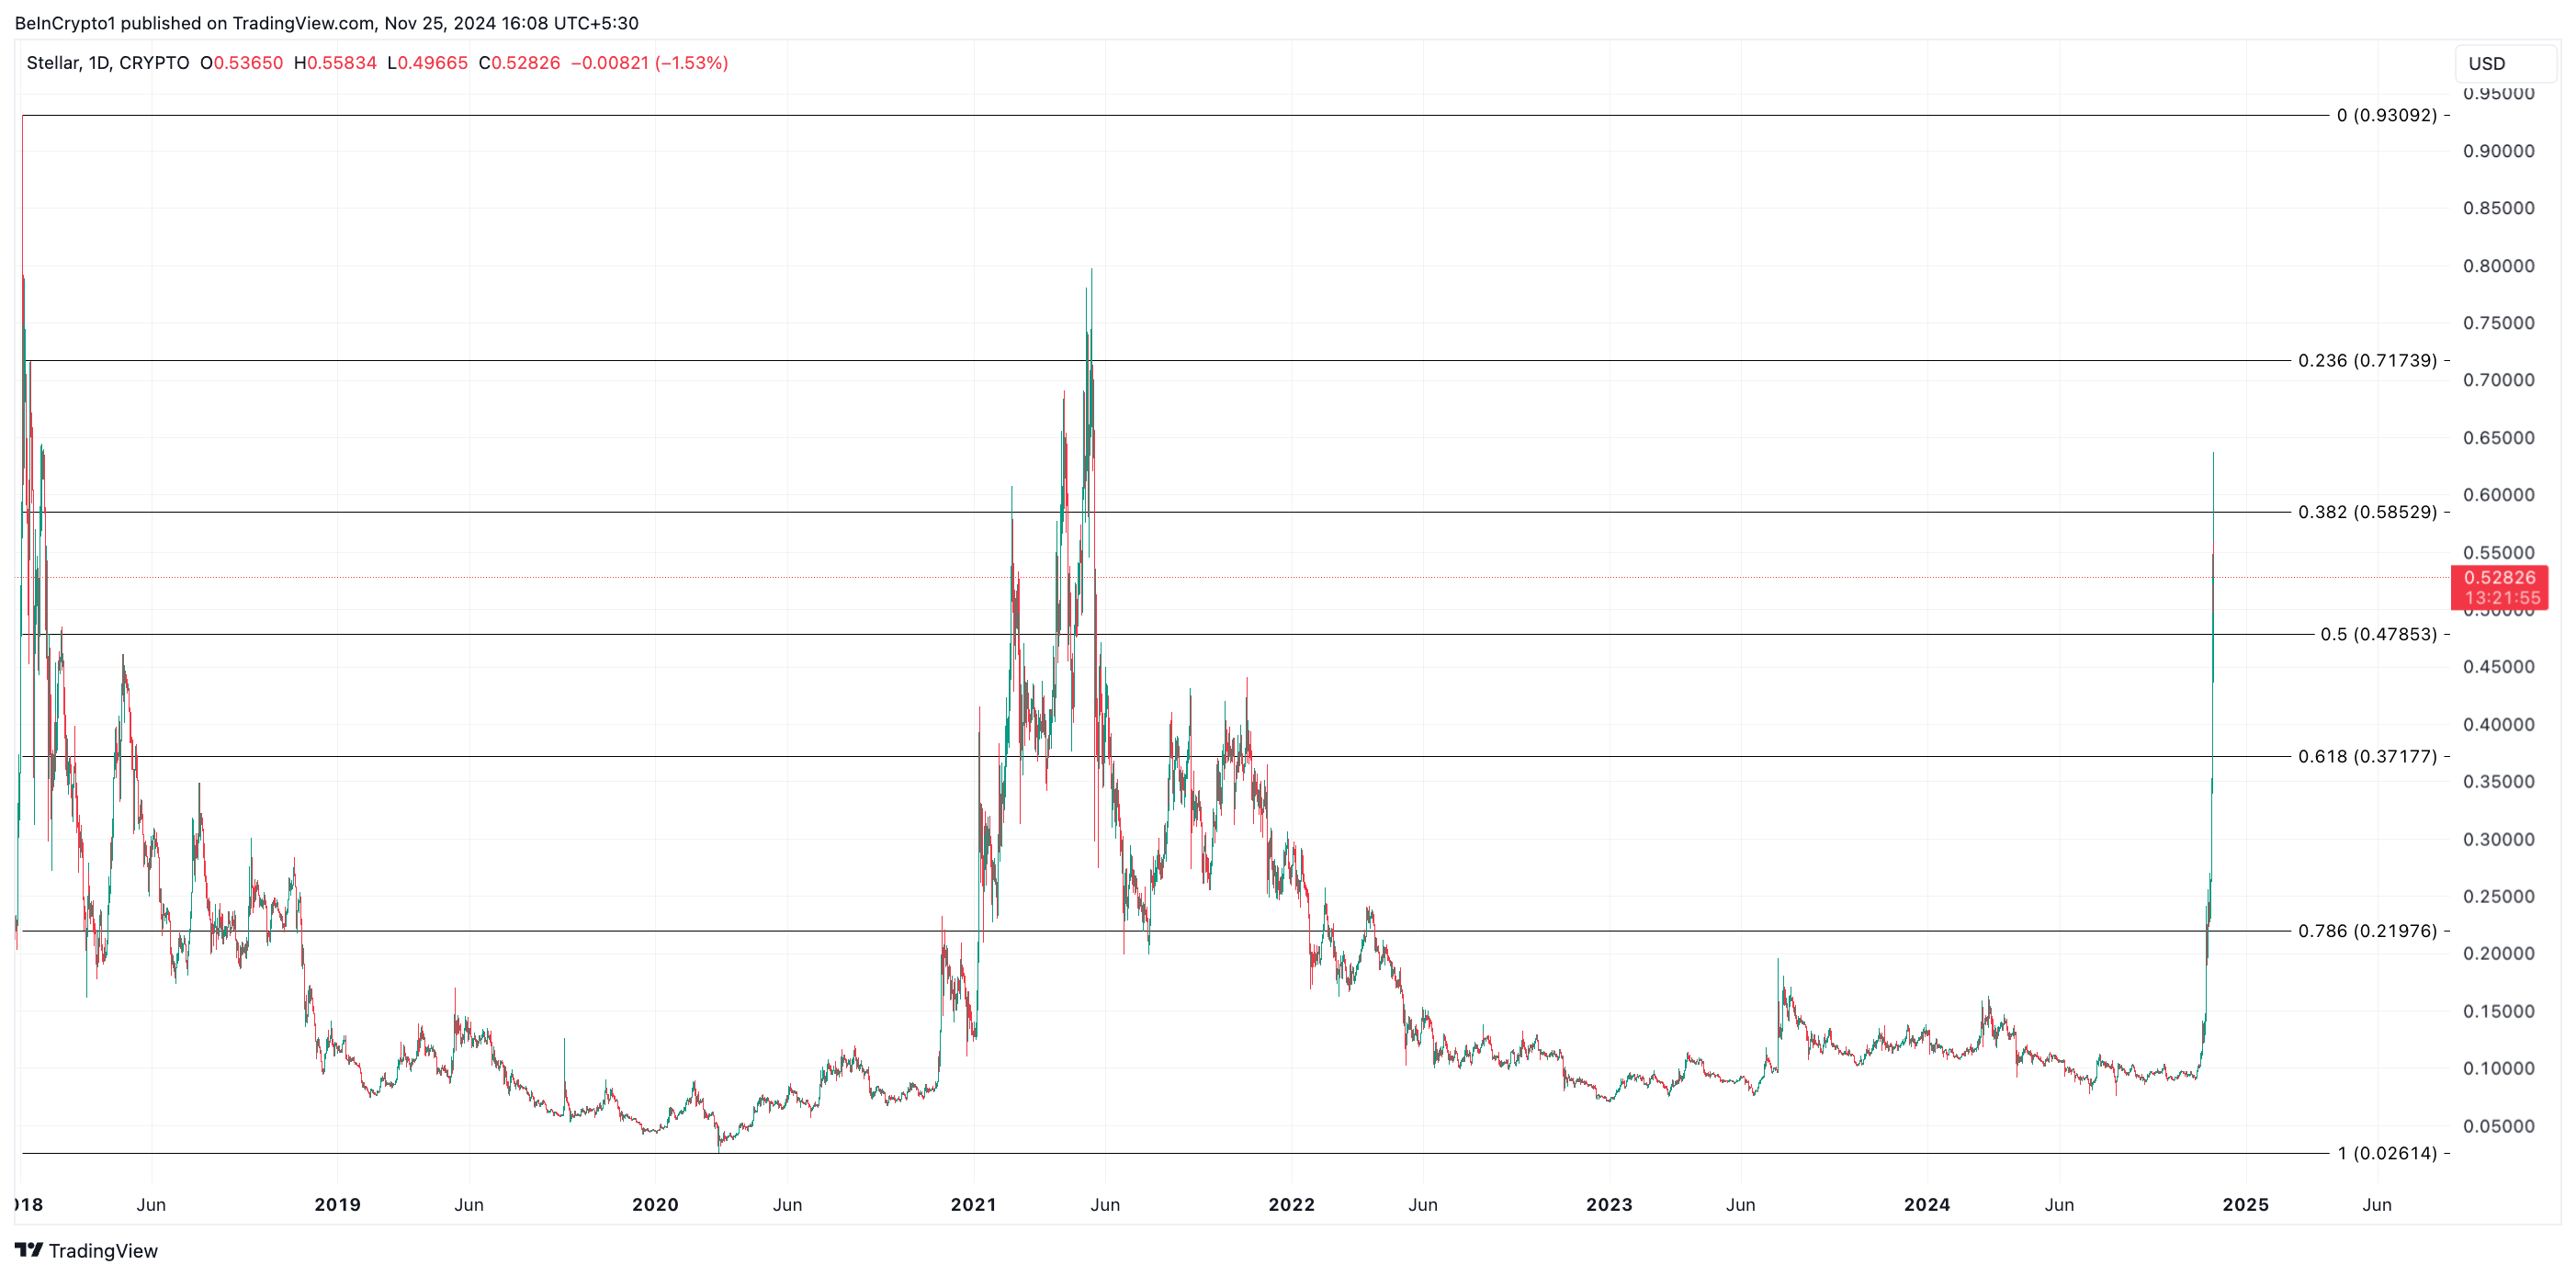
However, if buyer exhaustion sets in, XLM’s price will fall toward support at $0.47, invalidating this bullish outlook.
Disclaimer
In line with the Trust Project guidelines, this price analysis article is for informational purposes only and should not be considered financial or investment advice. BeInCrypto is committed to accurate, unbiased reporting, but market conditions are subject to change without notice. Always conduct your own research and consult with a professional before making any financial decisions. Please note that our Terms and Conditions, Privacy Policy, and Disclaimers have been updated.

This past weekend, several “old” cryptocurrencies made a surprising comeback while some meme coins struggled, with only a few exceptions. As a result, one of the long-standing cryptos has resurfaced in today’s trending altcoins.
This shift has also sparked renewed interest across the market, particularly in tokens that have underperformed in recent months. According to CoinGecko, the top three trending altcoins today are Gigachad (GIGA), Luckycoin (LKY), and MAD (MAD).
Gigachad (GIGA)
Since it was mentioned earlier that most meme coins struggled over the weekend, GIGA is trending not due to a price increase. In fact, its value has actually dropped by 20% over the past seven days.
However, it’s part of today’s trending altcoins because popular meme coin analyst Murad continues to highlight it as one of the best tokens to hold. Additionally, the recent decline has sparked discussions in the market, with many considering GIGA to be at a strong accumulation point.
From a technical point of view, the 4-hour chart shows that the Solana meme coin continues to trade within a descending triangle. While this is a bearish pattern, the token is close to the support at $0.36.
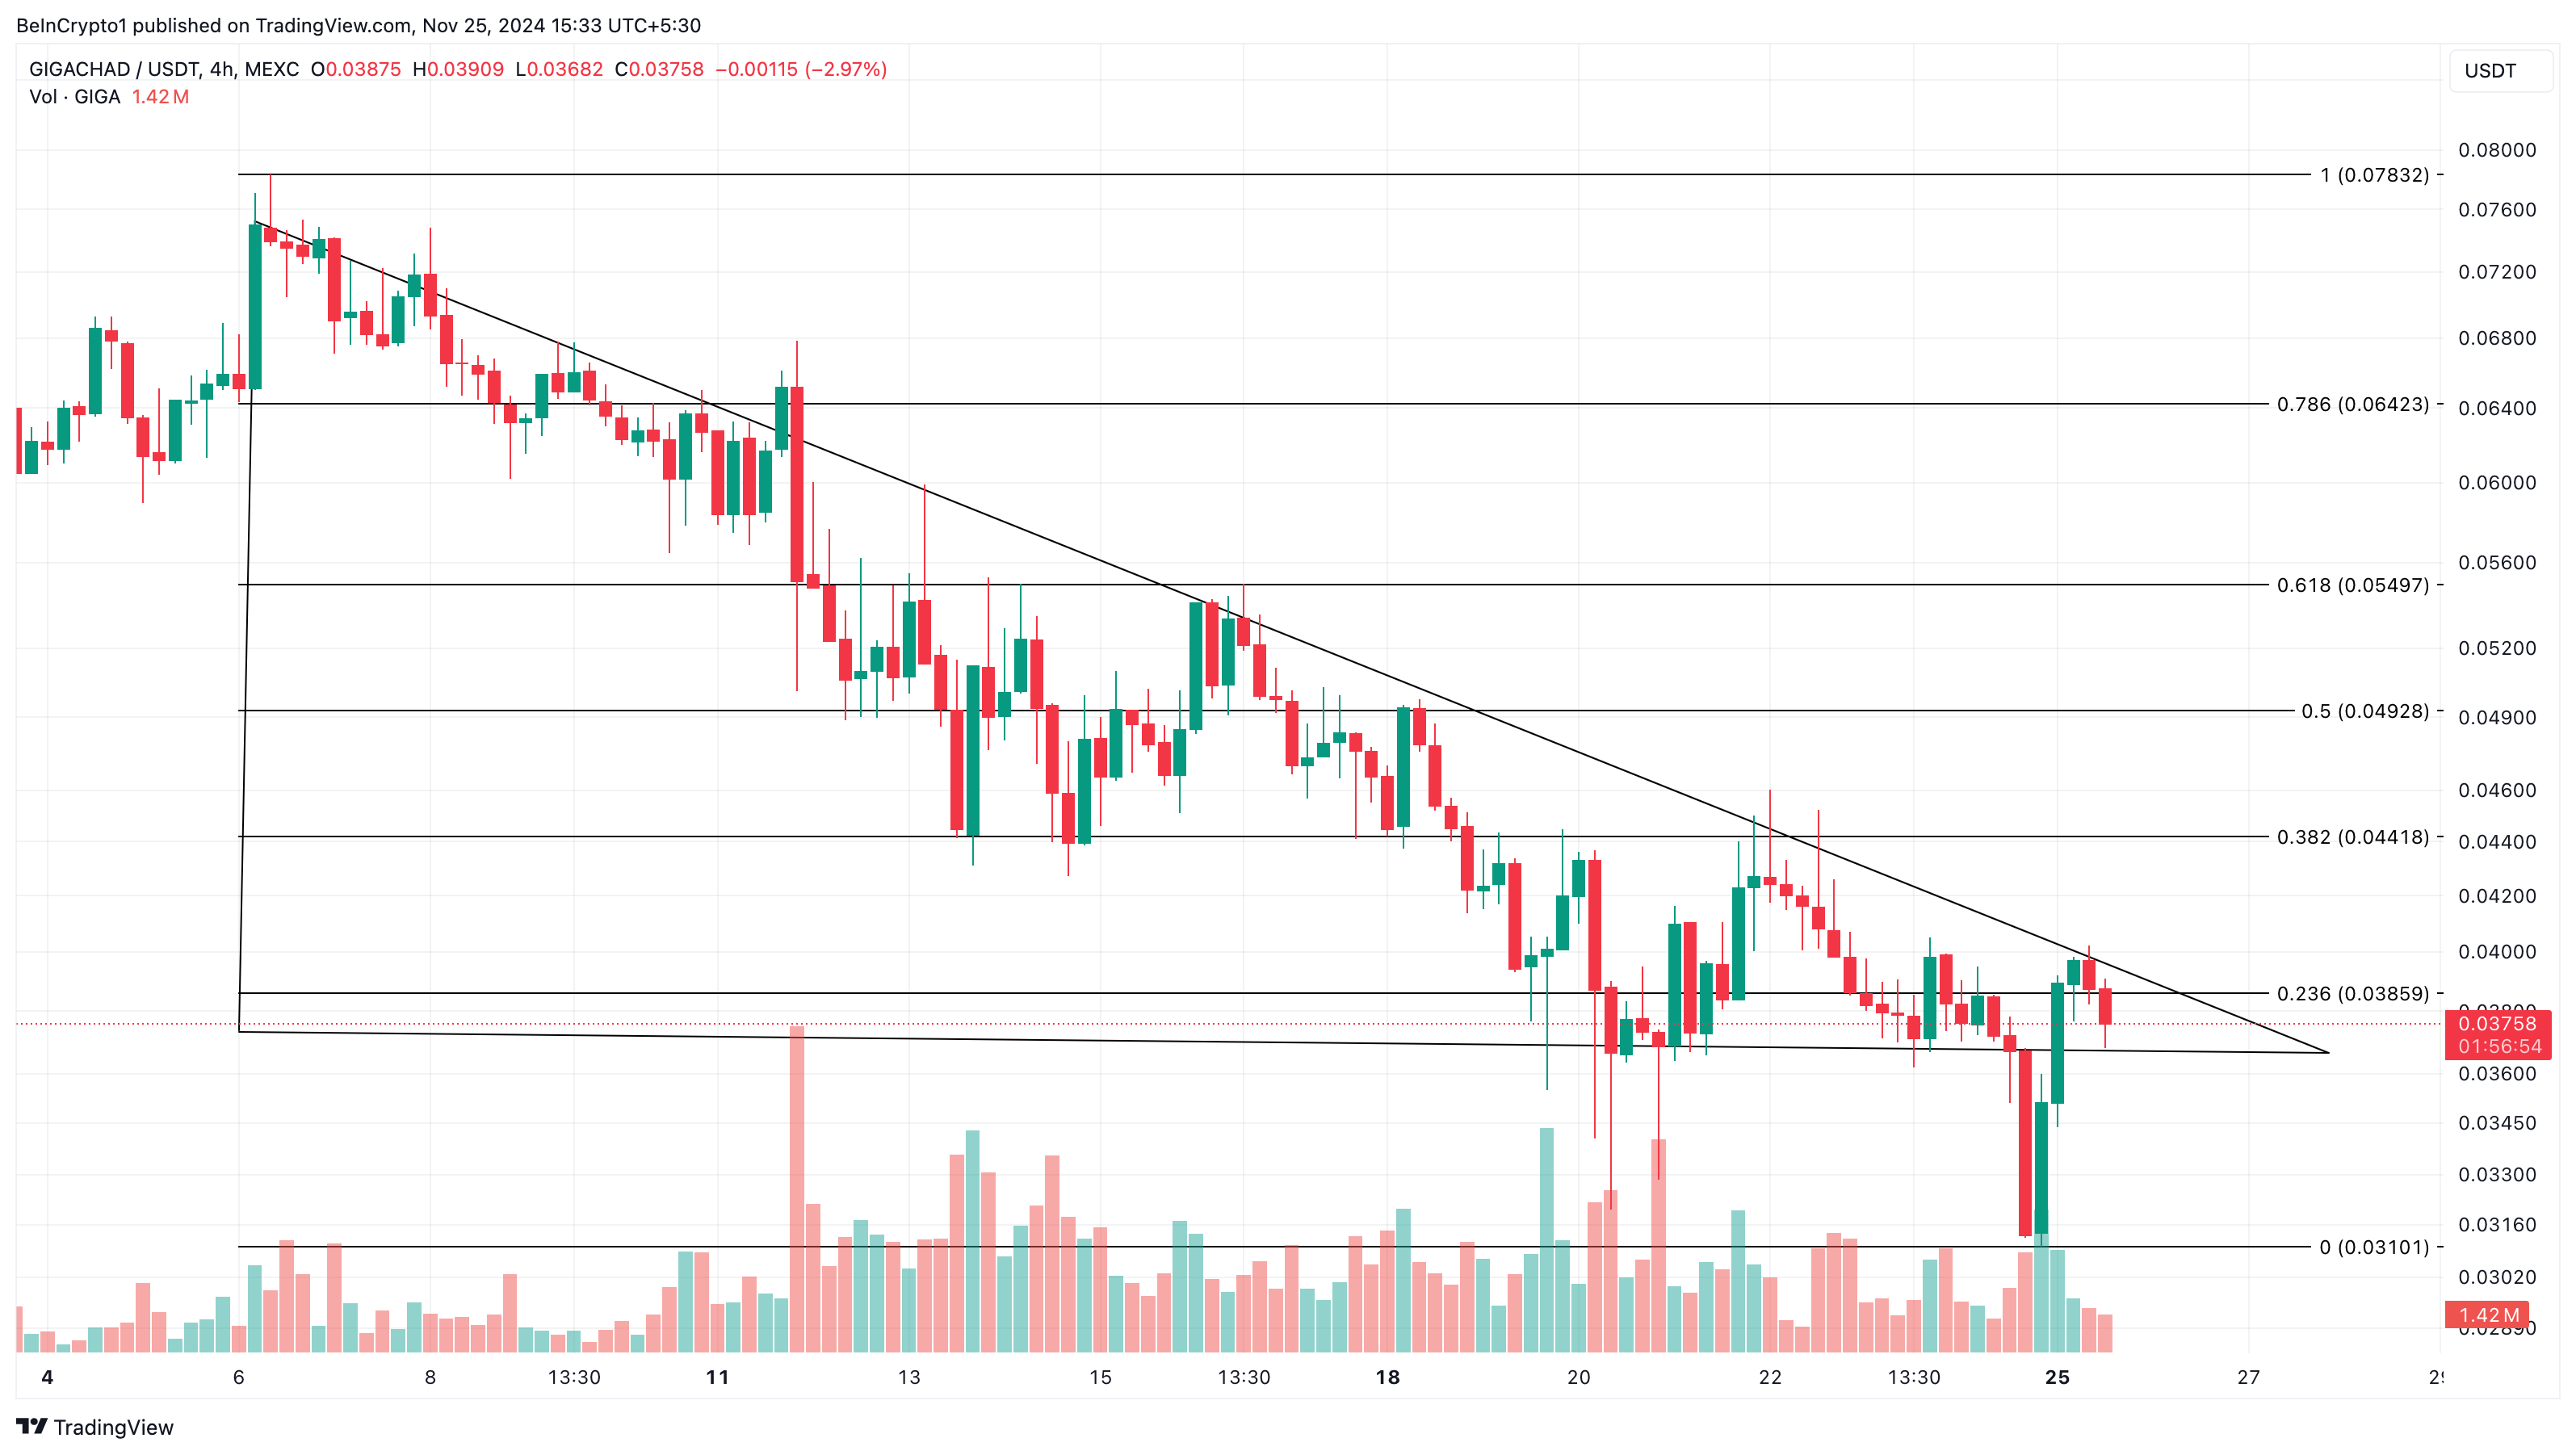
Should the price fall to this support, there is a chance that bulls might defend this region. If this is the case, then the value might bounce toward $0.055. However, if it drops below the support line, GIGA could decline as low as $0.031.
Luckycoin (LKY)
A surprise entry in today’s altcoin trends is Luckycoin (LKY), a project launched in 2013 and recognized as the world’s first meme coin, from which Dogecoin (DOGE) was forked.
LKY is trending today thanks to impressive price action. Trading at $13.90, its price has surged by 65% in the last 24 hours and 420% over the past seven days. This rapid increase is likely fueled by buying pressure, especially given that the altcoin has a limited total supply of just 12.07 million coins.
With such a low supply, even modest buying pressure can drive significant price movements. However, according to the 1-hour chart, LKY’s price could see a notable pullback. This is largely due to the drop in the Relative Strength Index (RSI) reading.
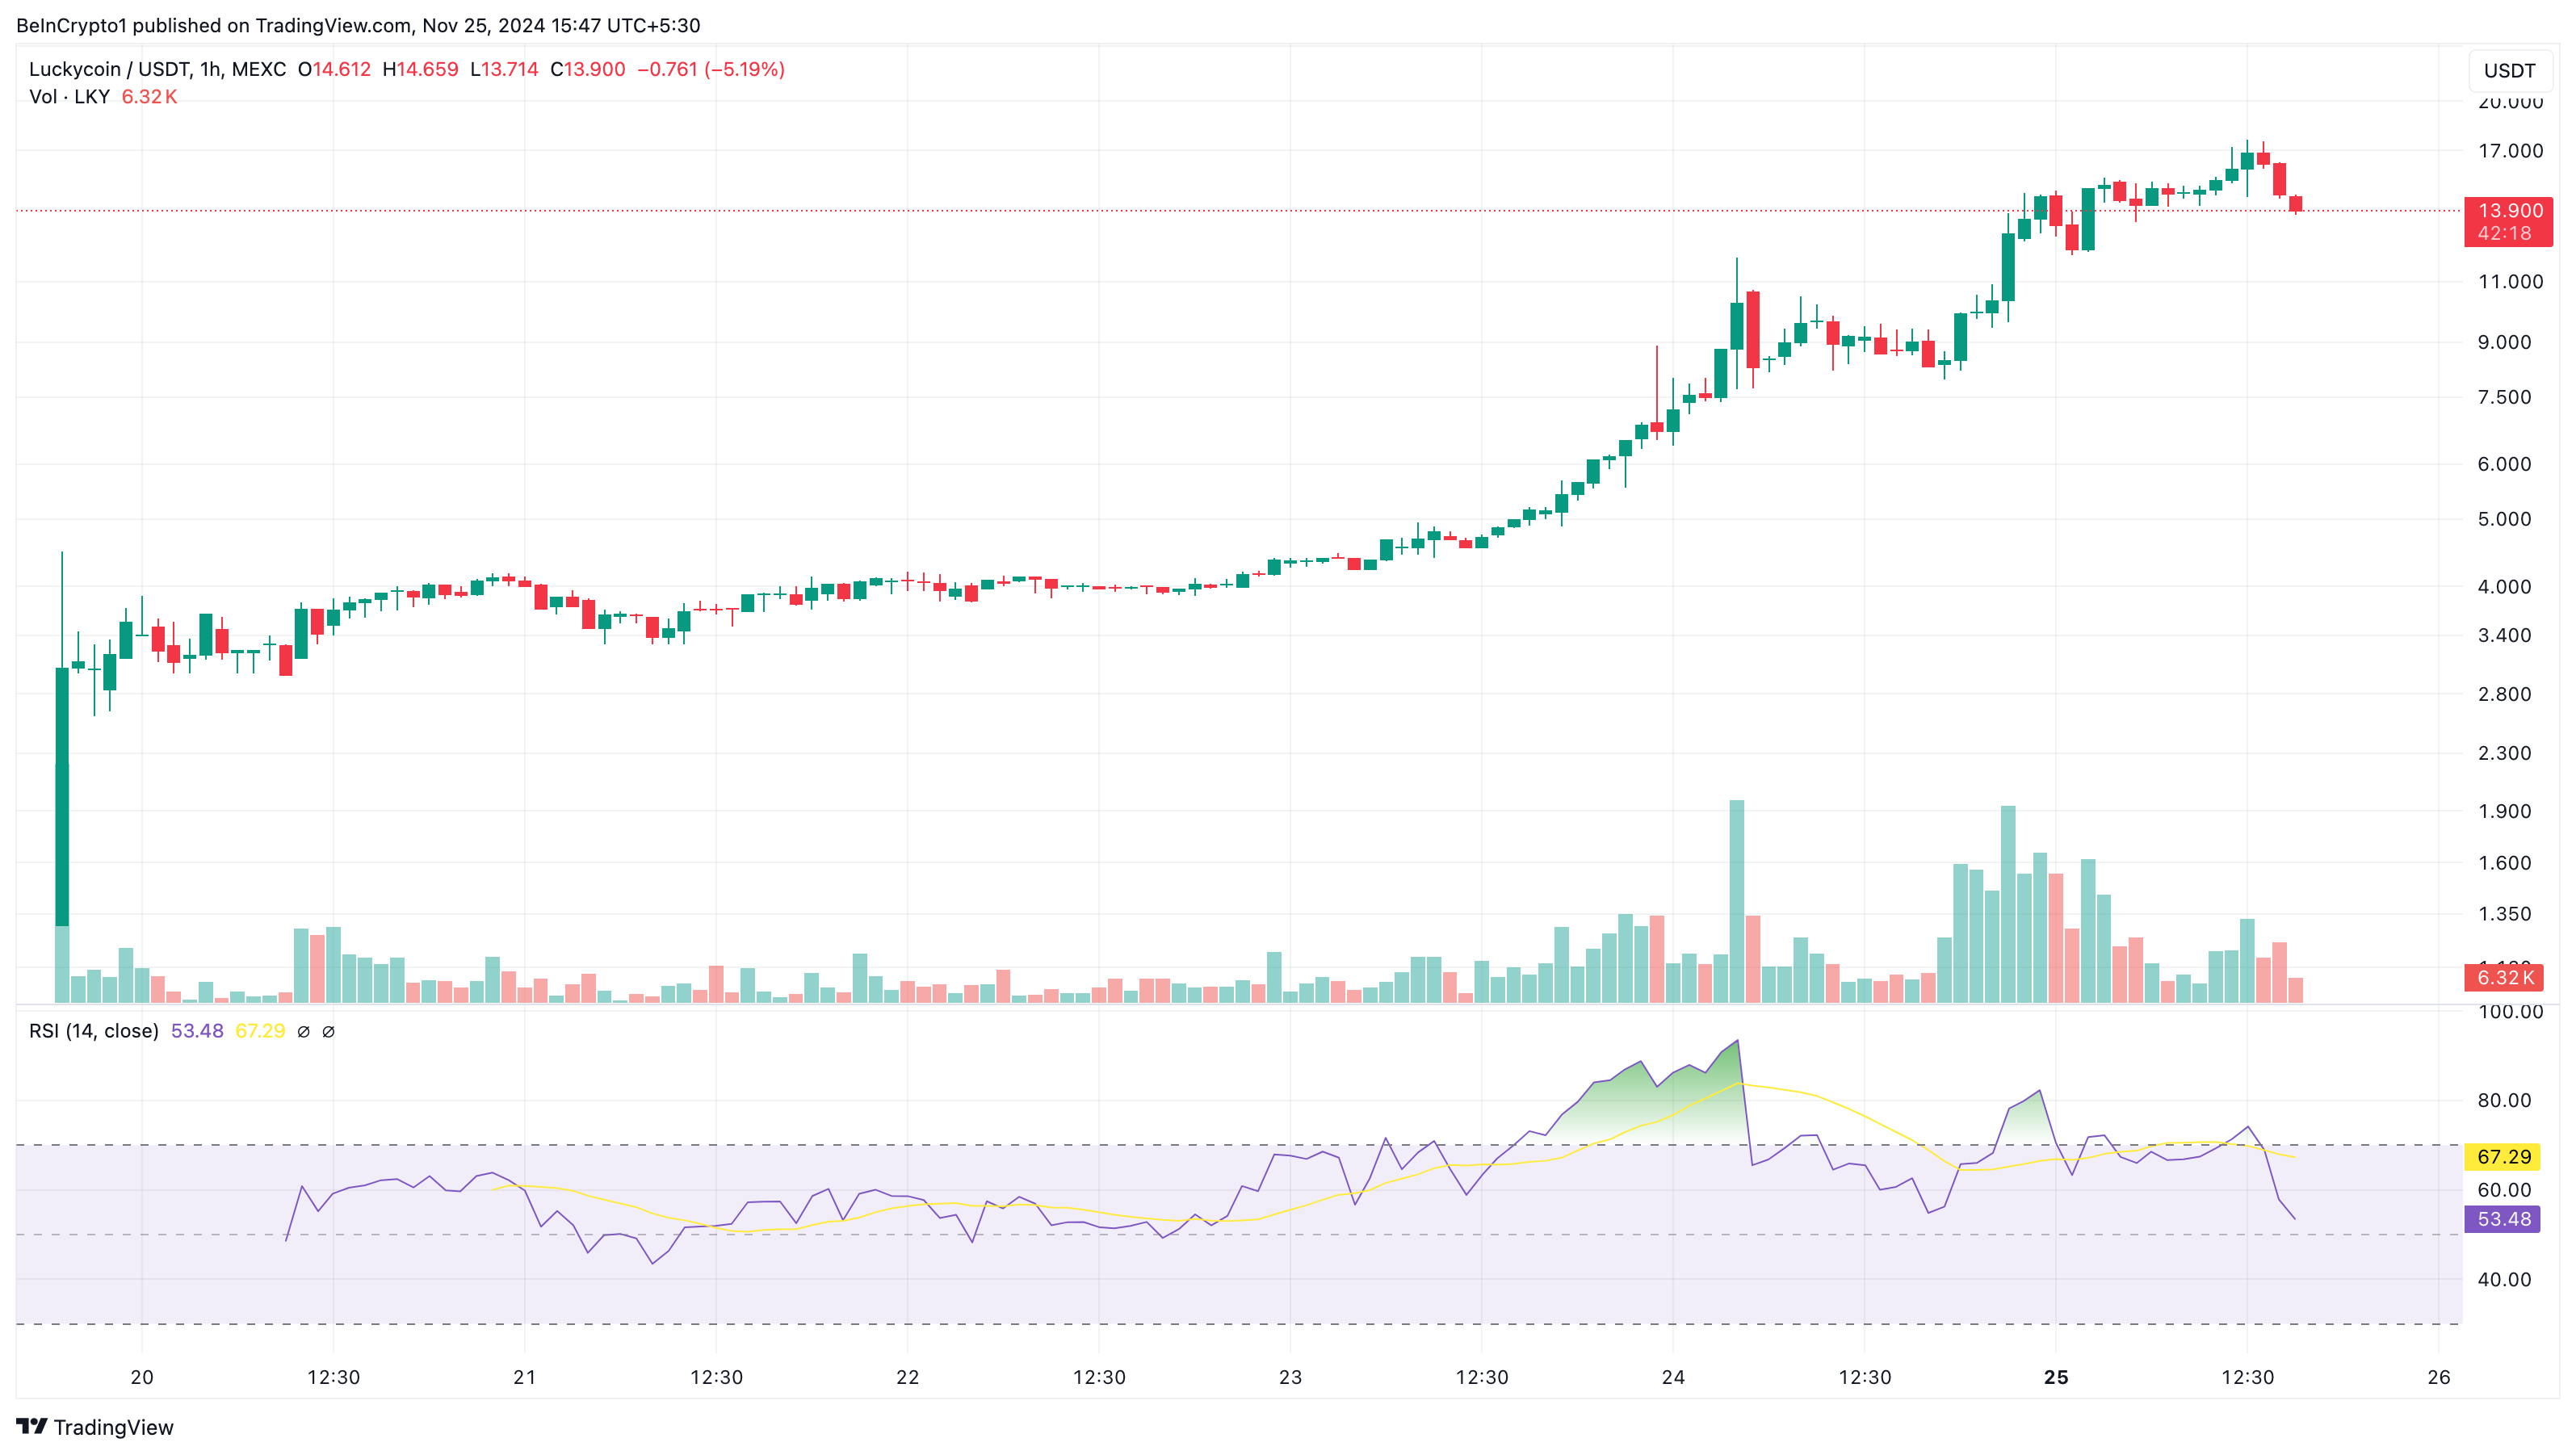
As seen below, the RSI, which measures momentum, has fallen below the neutral 50.00 line. If the rating continues to drop, then LKY could decrease below $10. On the flip side, if buying pressure increases again, then the altcoin could move toward $20.
MAD (MAD)
Last on the list is MAD, which also appeared on the trending altcoins analysis last week. The altcoin is part of today’s list because its price has increased by 73% in the last 24 hours and 332% in the last seven days.
This price rise, alongside a rise in volume, indicates that the market seems to have great interest in MAD. As of this writing, MAD’s price is $0.000045. Meanwhile, the daily charts show that bulls have defended the price from dropping below $0.000036.
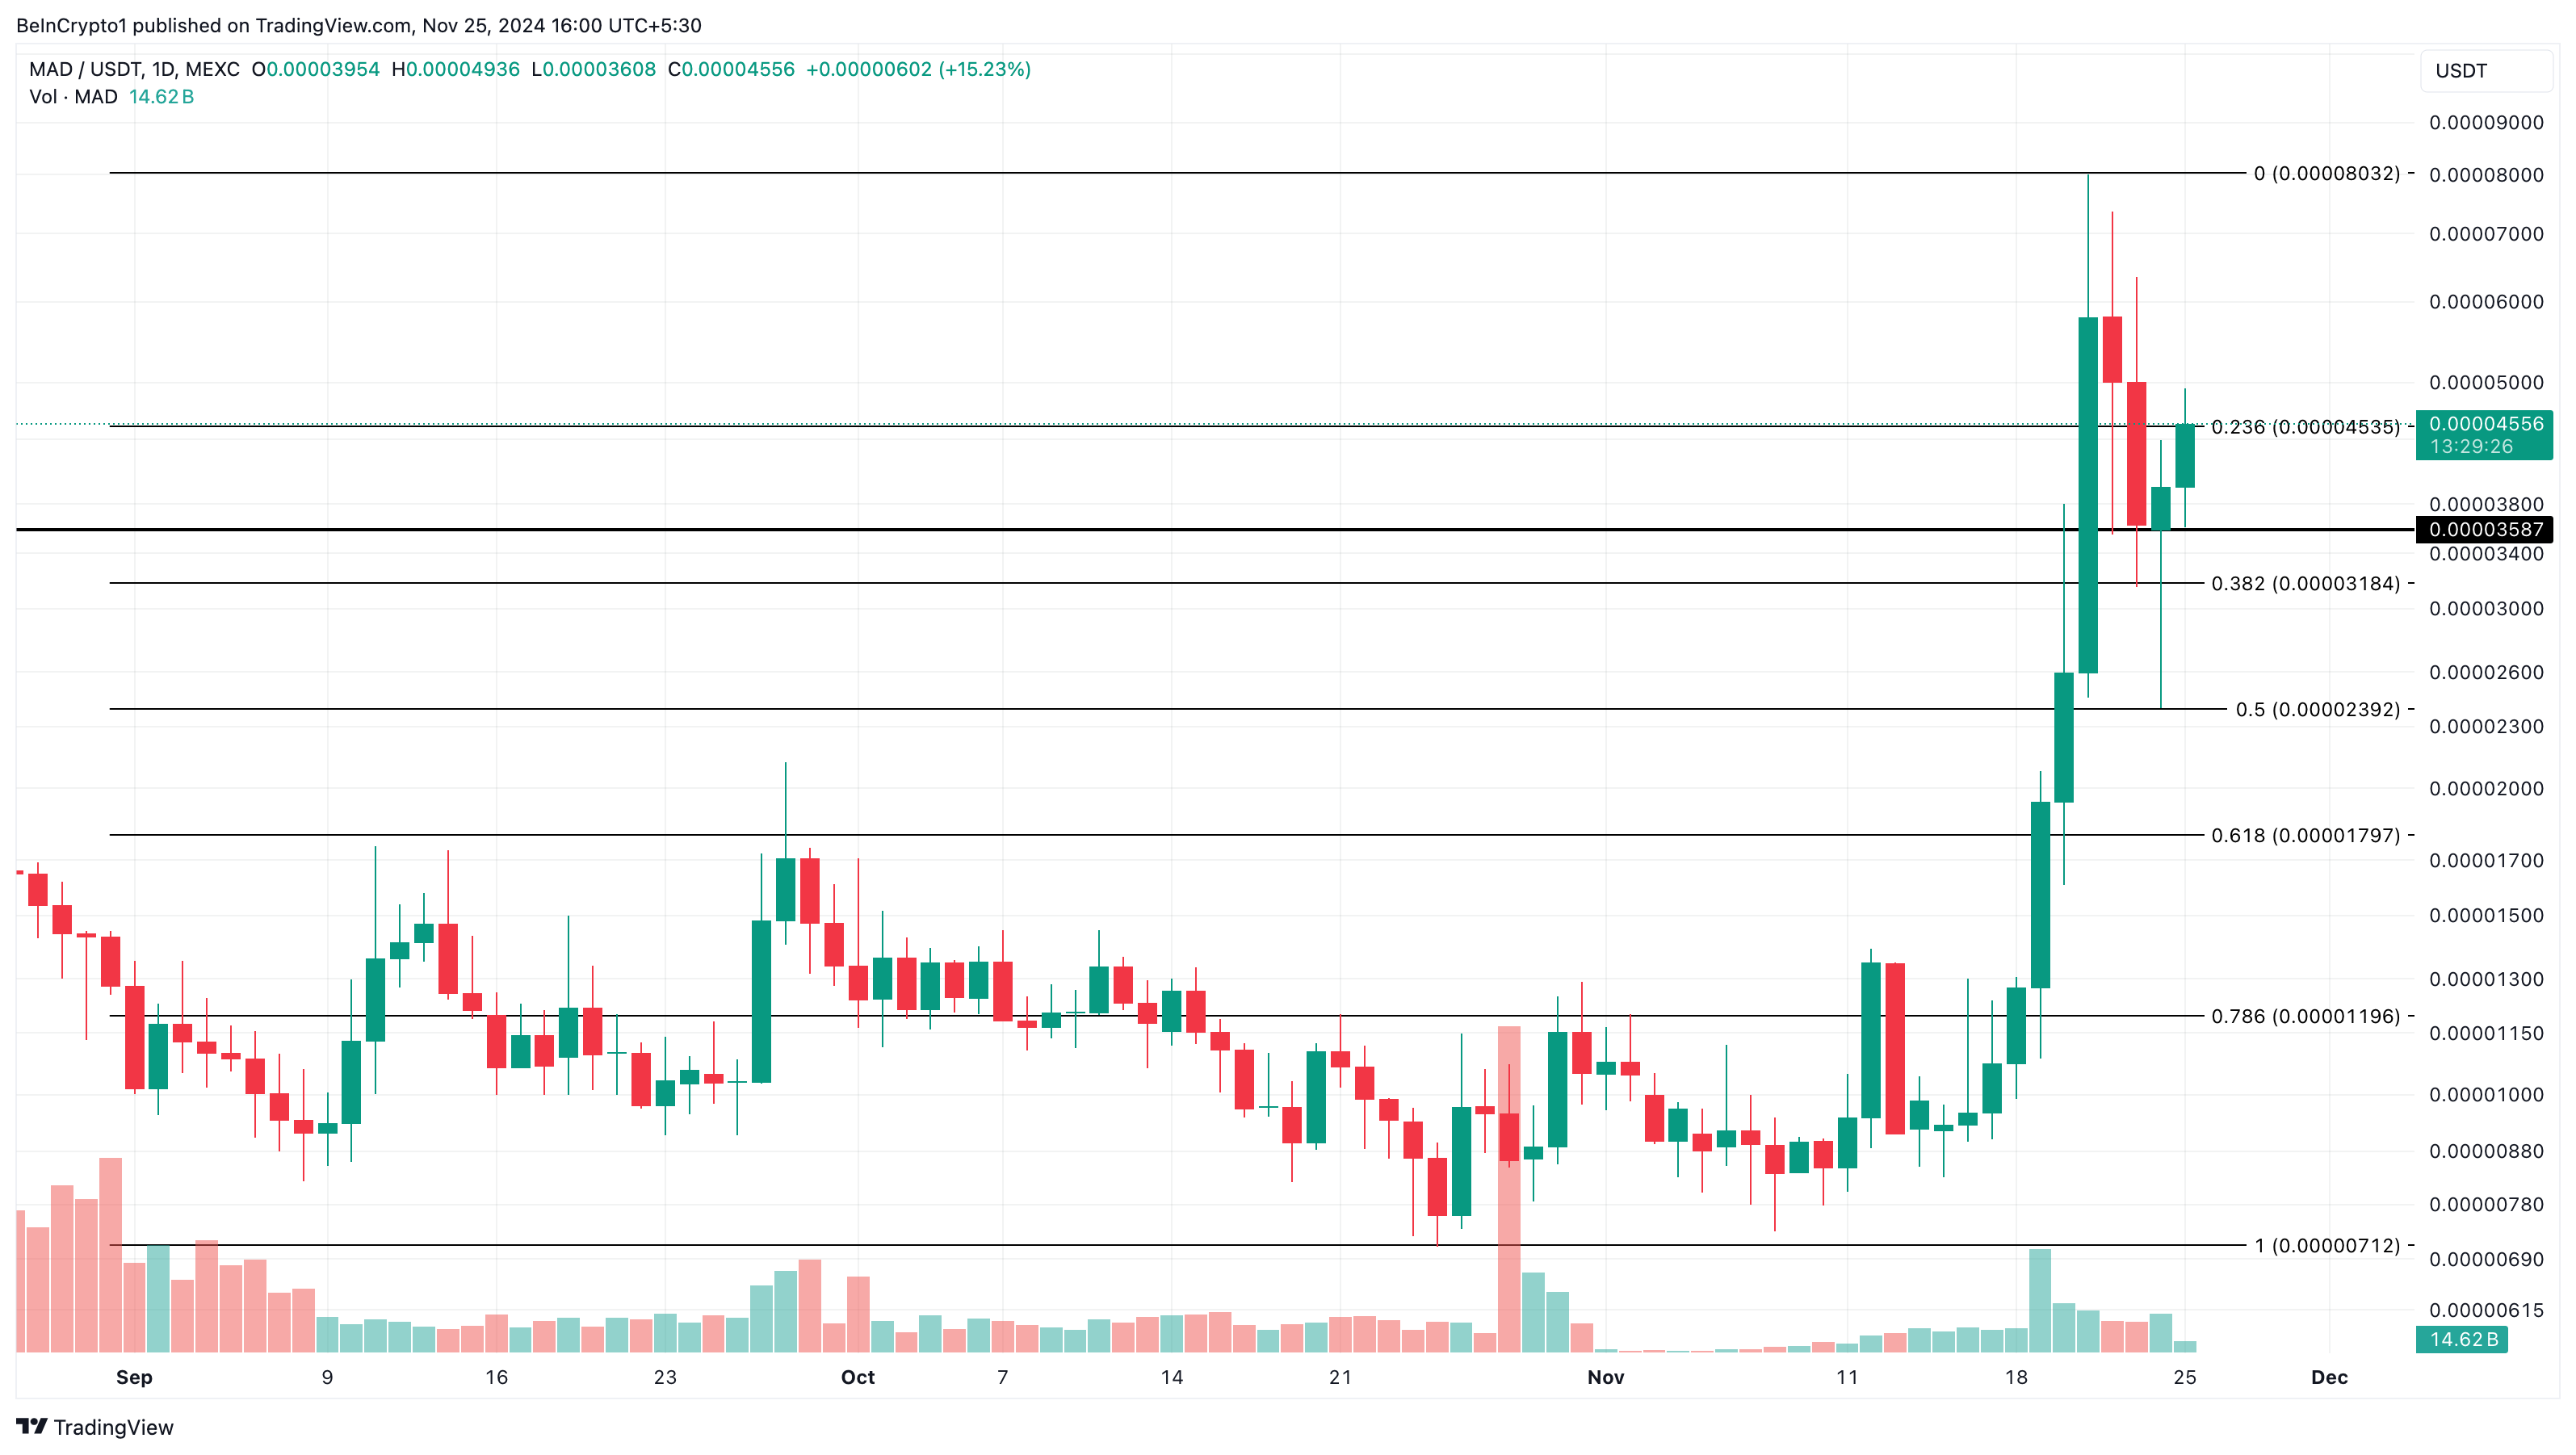
With increasing volume and accumulation, the altcoin is likely to climb higher. If that is the case, then MAD can rise to $0.000080. However, a decline below the support could invalidate the prediction, and the token could drop to $0.000032.
Disclaimer
In line with the Trust Project guidelines, this price analysis article is for informational purposes only and should not be considered financial or investment advice. BeInCrypto is committed to accurate, unbiased reporting, but market conditions are subject to change without notice. Always conduct your own research and consult with a professional before making any financial decisions. Please note that our Terms and Conditions, Privacy Policy, and Disclaimers have been updated.

The Sandbox (SAND) continued its bullish trend, hitting a new yearly high of $0.86 during Monday’s early Asian session. However, it has since pulled back by 14%, trading at $0.76 at press time.
Despite the recent surge, on-chain and technical indicators suggest that the much-anticipated $1 price target remains unlikely for now. Here’s why.
The Sandbox’s Long-Term Holders Book Profit
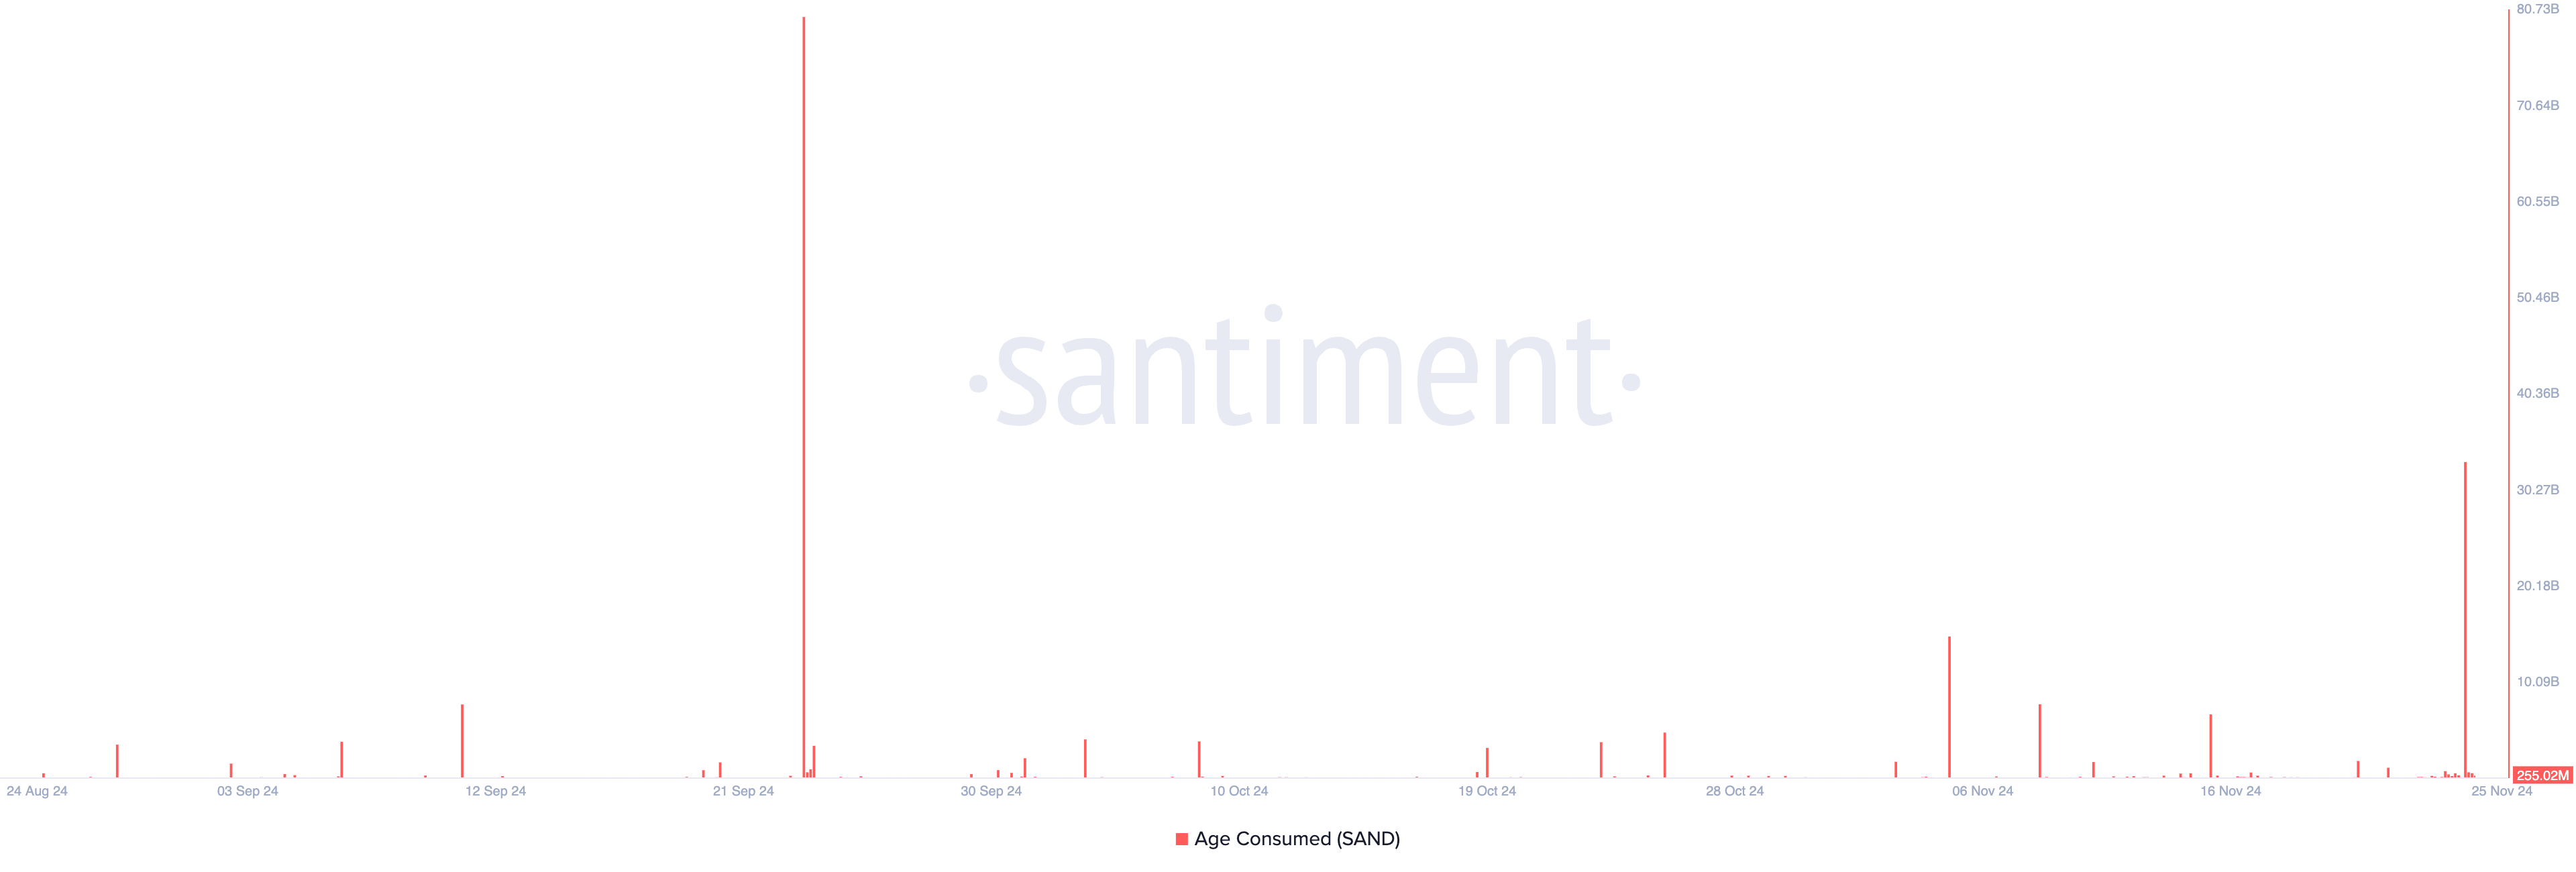
SAND’s price hike over the past week has prompted its long-term holders to move their previously dormant tokens around. This is reflected in the surge in the token’s age-consumed metric, which measures the movement of long-held coins. According to Santiment, this skyrocketed to a two-month high of 33.19 billion on Sunday.
This metric’s rally is notable because long-term holders are not in the habit of moving their coins around. Therefore, when they do, especially during periods of price uptick, it hints at a shift in market trends. Significant spikes in age-consumed during a rally like this suggest that long-term holders are offloading, possibly leading to increased selling pressure.
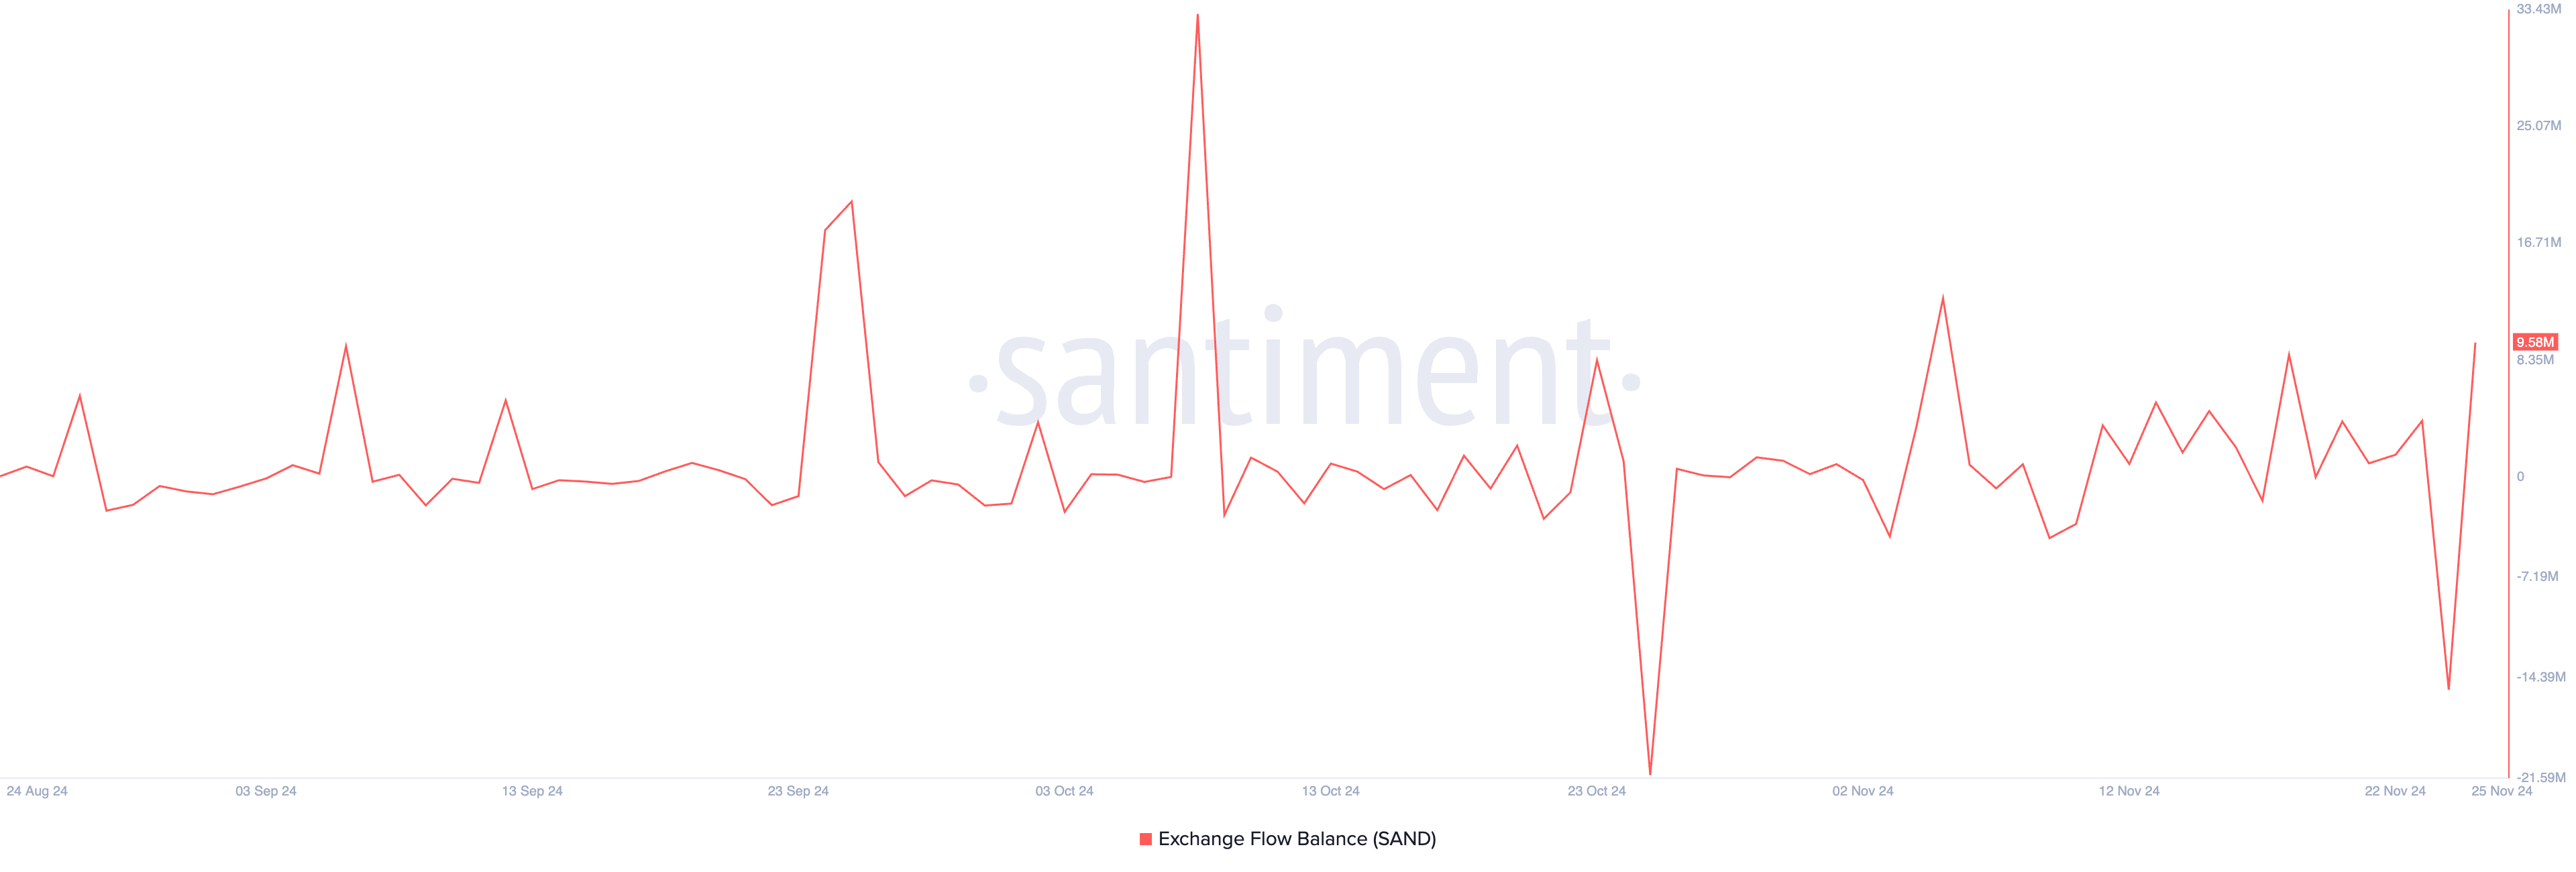
Notably, the rise in SAND’s Exchange Flow Balance over the past 24 hours confirms the selling activity. According to Santiment, this metric, which measures the net difference between the amount of an asset sent to exchanges and the amount of an asset withdrawn from exchanges over a specific period, has climbed by 162%.
This reflects an increase in the amount of SAND tokens being deposited to exchanges. It signals that holders are preparing to sell, possibly leading to downward price pressure.
On the daily chart, SAND’s Relative Strength Index (RSI) stands at 87.18, indicating overbought conditions. The RSI measures whether an asset is oversold or overbought, ranging from 0 to 100. Values above 70 signal that the asset is overbought and could face a decline, while values below 30 suggest it is oversold and might rebound.
With an RSI of 87.18, SAND is signaling overbought conditions, putting it at risk of a near-term pullback. If a decline occurs, its price could drop to $0.72. Increased selling pressure at this level may push SAND further down to $0.61, distancing it even more from the sought-after $1 target.
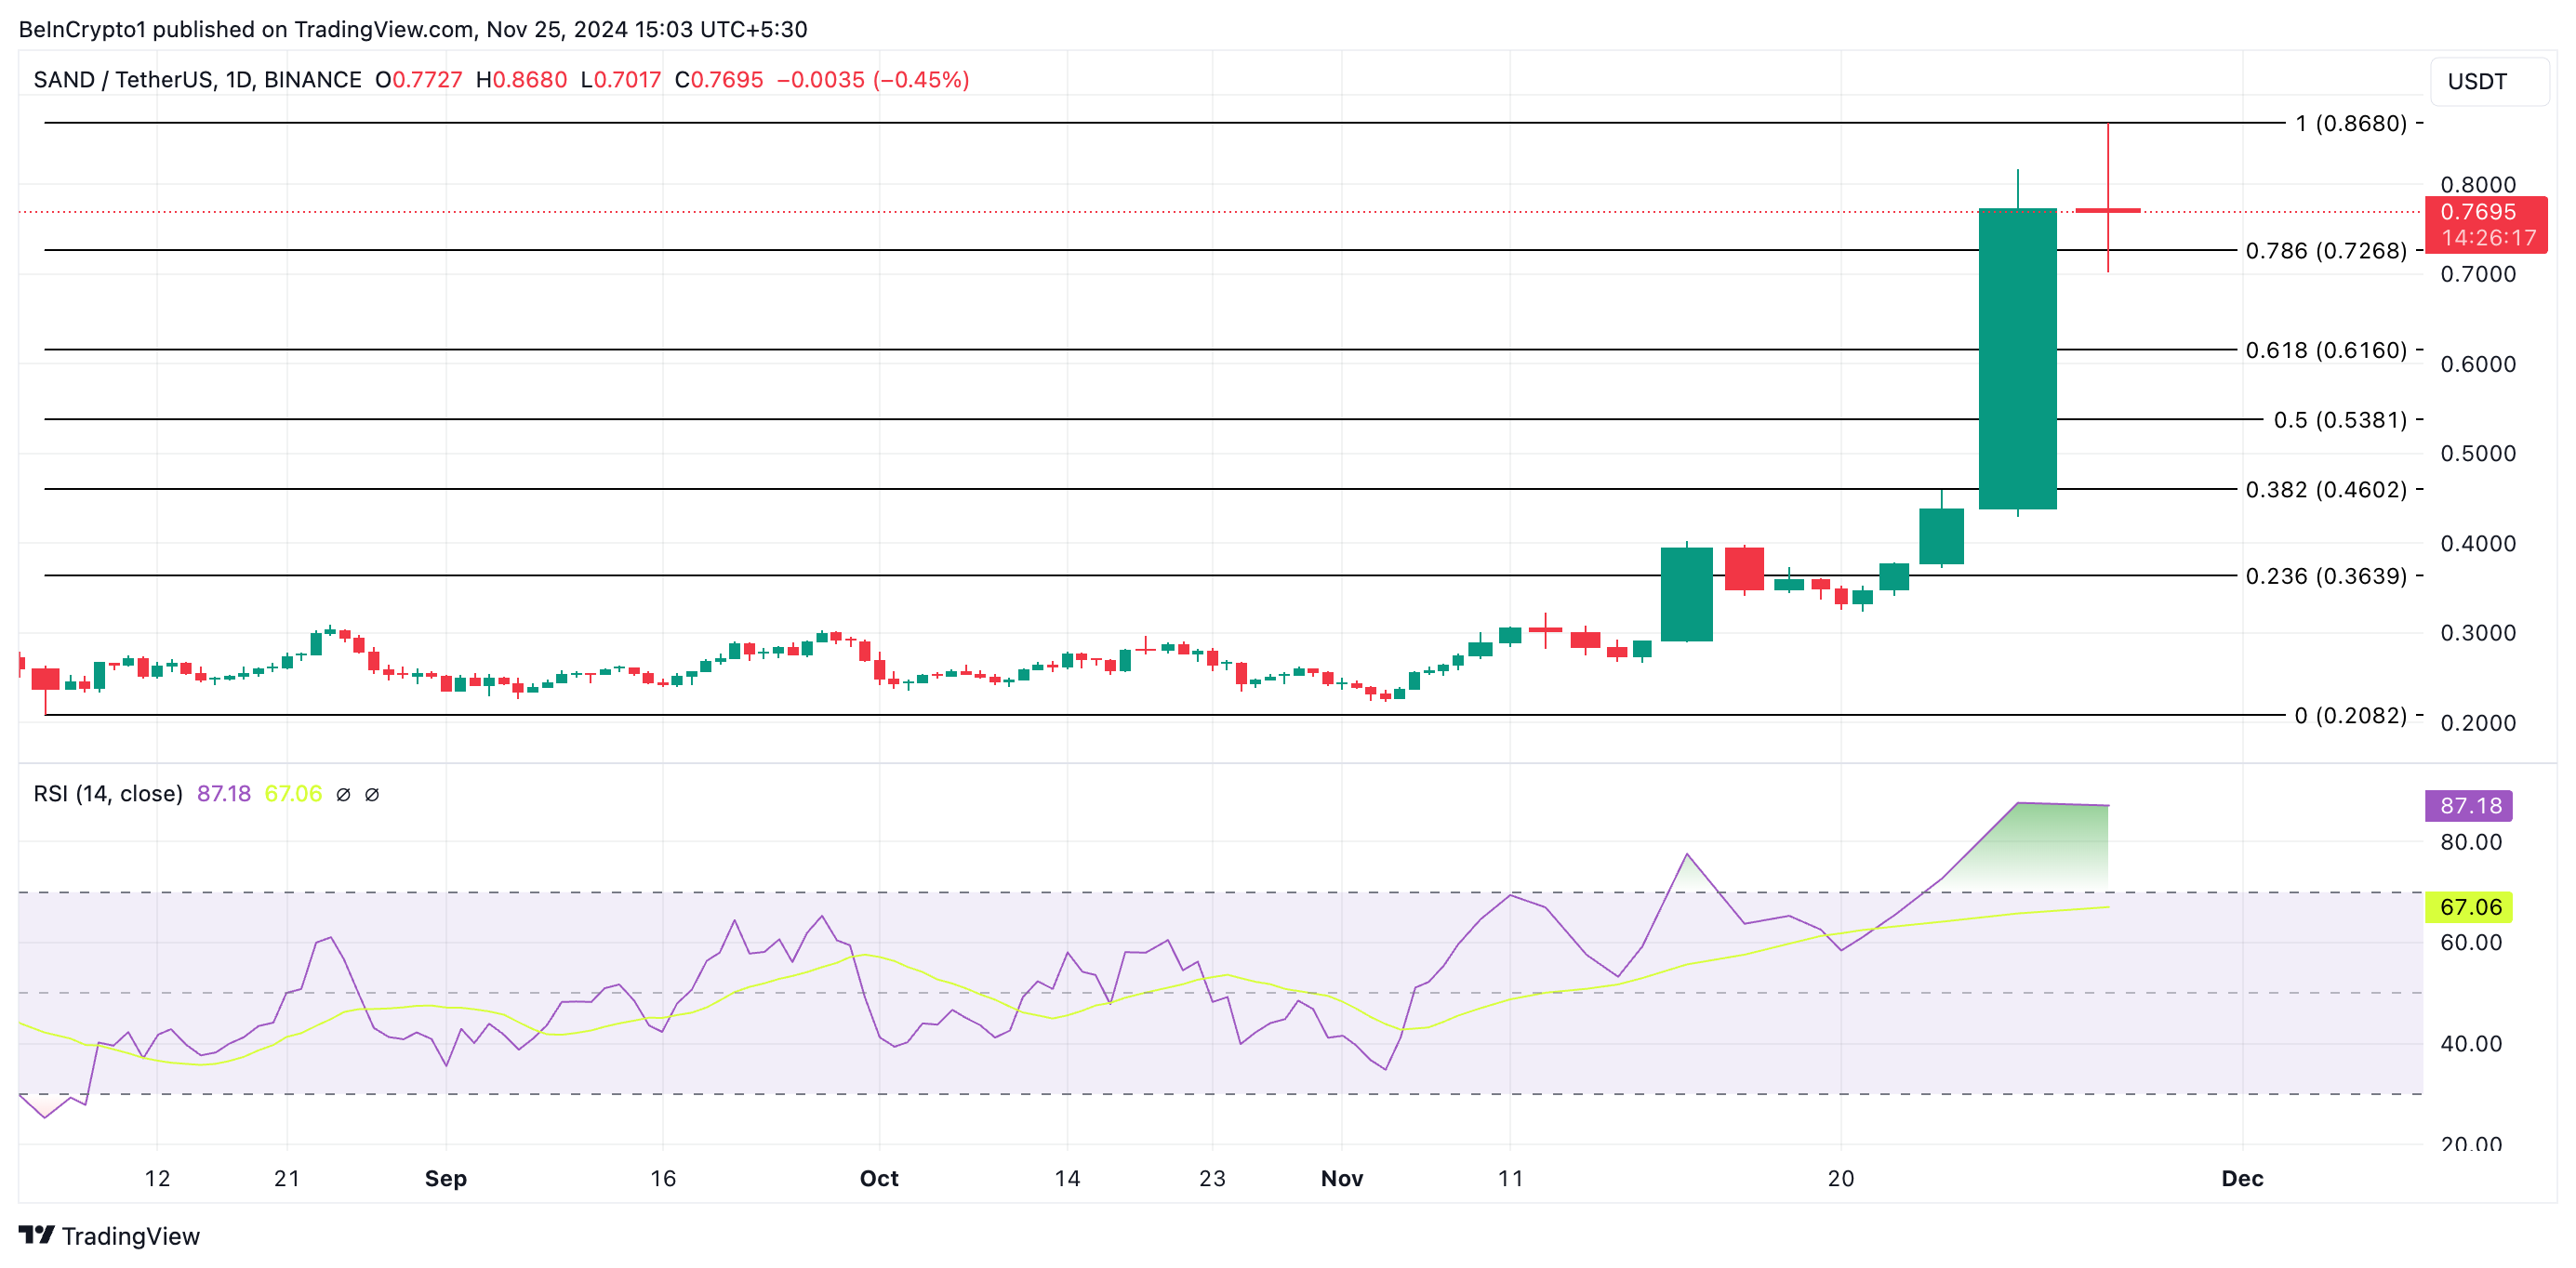
On the other hand, the SAND token price may reclaim its year-to-date high of $0.86 if the selling pressure wanes. This will invalidate the bearish thesis above.
Disclaimer
In line with the Trust Project guidelines, this price analysis article is for informational purposes only and should not be considered financial or investment advice. BeInCrypto is committed to accurate, unbiased reporting, but market conditions are subject to change without notice. Always conduct your own research and consult with a professional before making any financial decisions. Please note that our Terms and Conditions, Privacy Policy, and Disclaimers have been updated.
Ripple Announces First Tokenized Money Market Fund on XRP Ledger

Why the XLM Price Rally May Reach the $0.91 All-Time High

Dogecoin Price To $1.2 In 10-15 Days? What The Bull Pennant Says

Today’s Trending Altcoins — November 25: GIGA, LKY, MAD
Why Is Ethereum Up Today? Will It Hit $10,000?

Can the SAND Token Price Touch $1?

2.52 Million Altcoins Are Ruining Crypto’s Future

Animoca Brands Valuation Tanks 75% In Two Years, Here’s Why

Crypto exchange BingX hacked for $43 million

Are The Big Players Losing Interest?

Hong Kong’s Securities Association Tips Authorities On Crypto Self-Regulation

Coinbase cbBTC Set to go Live on Solana
2.52 Million Altcoins Are Ruining Crypto’s Future
Animoca Brands Valuation Tanks 75% In Two Years, Here’s Why
Crypto exchange BingX hacked for $43 million
Are The Big Players Losing Interest?
Hong Kong’s Securities Association Tips Authorities On Crypto Self-Regulation
Coinbase cbBTC Set to go Live on Solana
-

 Bitcoin23 hours ago
Senator’s Bold Proposal To Replenish US Reserves
-
 Market22 hours ago
Can the SAND Token Price Rally Be Sustained?
-

 Bitcoin21 hours ago
Bitcoin Whales Remain Determined, $3.96 Billion Worth Of BTC Gobbled Up In 96 Hours
-
 Altcoin8 hours ago
Super Pepe Coin Whale Sells 130B PEPE, Shifts Focus To EIGEN
-

 Market21 hours ago
Cantor Fitzgerald Deepens Tether Ties With 5% Stake Acquisition
-

 Market8 hours ago
Harmful Livestreams Prompt Ban Calls
-

 Bitcoin20 hours ago
$100K Bitcoin Is Only The Beginning, VanEck Targets $180K
-

 Market19 hours ago
Why Ethereum Price May Fall Under $3,000