
Ethereum
Ethereum’s Explosion To $3,800 Puts 90% Investors In Profit
On-chain data shows 90% of all Ethereum investors are now in profit following the sharp surge that the asset’s price has seen beyond $3,800.
Ethereum Investors Overwhelming In The Green After ETF Rally
According to data from the market intelligence platform IntoTheBlock, ETH’s latest rally has meant that a shift in investor profitability has occurred on the network.
To keep track of holder profitability, the analytics firm makes use of on-chain data to find what the average acquisition price or cost basis of each address on the blockchain is.
If this price is less than the current spot value of the cryptocurrency for any address, then that particular investor is considered to be in profit, or “in the money”, as IntoTheBlock defines.
On the other hand, the cost basis being lower than the asset’s price suggests the address is holding some net amount of loss, so its holder would be “out of the money.”
Naturally, if the average buying price of the wallet is equal to the spot price of the coin, then the investor would be considered to be just breaking even (“at the money”).
Now, here is what the profitability breakdown of the Ethereum userbase looks like following the sharp rally that the asset has enjoyed:
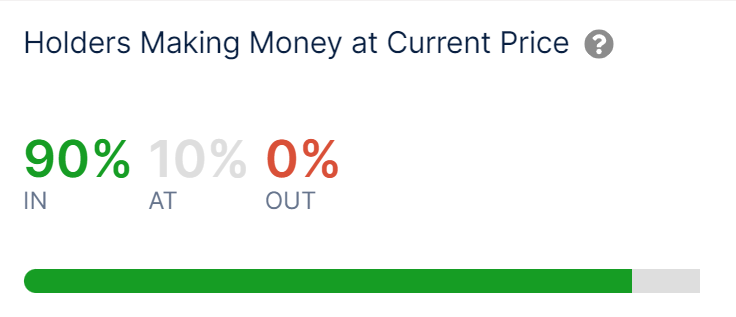
Looks like a large amount of investors are in the green at the moment | Source: IntoTheBlock on X
As is visible above, 90% of the total addresses on the Ethereum network are holding their coins at some net unrealized gain following the sharp surge the asset’s price has seen.
Interestingly, 0% of the wallets are also out of the money, meaning there is no one on the blockchain that’s in losses anymore. 10% of the investors are still on break-even, though.
Historically, holders in profit have been more likely to sell than those in loss. As such, whenever the market has seen a large imbalance towards green investors, the chances of a selloff happening have been notable.
Because of this reason, tops in the cryptocurrency’s price can become more probable at high profitability ratio levels. Since an overwhelming amount of ETH investors are carrying gains now, a mass profit-taking event may be likely to occur, which can impede the current rally.
It should be noted, though, that during bull markets, the asset has generally been able to sustain high investor profits for a while, as high demand keeps flowing in to absorb any profit-taking, before a top eventually occurs.
That said, the likelihood of at least temporary cooldowns taking place can go up if profitability remains high for too long. It now remains to be seen how the Ethereum price develops from here on out and whether the hype around the spot ETFs will be able to counteract any selloffs in the market.
ETH Price
With a rally of over 22% over the past 24 hours, Ethereum has managed to reach the highest levels in more than two months as its price is now trading around $3,800.
The price of the coin seems to have observed some sharp bullish momentum in the past day | Source: ETHUSD on TradingView
Featured image from Bastian Riccardi on Unsplash.com, IntoTheBlock.com, chart from TradingView.com


Meet Samuel Edyme, Nickname – HIM-buktu. A web3 content writer, journalist, and aspiring trader, Edyme is as versatile as they come. With a knack for words and a nose for trends, he has penned pieces for numerous industry player, including AMBCrypto, Blockchain.News, and Blockchain Reporter, among others.
Edyme’s foray into the crypto universe is nothing short of cinematic. His journey began not with a triumphant investment, but with a scam. Yes, a Ponzi scheme that used crypto as payment roped him in. Rather than retreating, he emerged wiser and more determined, channeling his experience into over three years of insightful market analysis.
Before becoming the voice of reason in the crypto space, Edyme was the quintessential crypto degen. He aped into anything that promised a quick buck, anything ape-able, learning the ropes the hard way. These hands-on experience through major market events—like the Terra Luna crash, the wave of bankruptcies in crypto firms, the notorious FTX collapse, and even CZ’s arrest—has honed his keen sense of market dynamics.
When he isn’t crafting engaging crypto content, you’ll find Edyme backtesting charts, studying both forex and synthetic indices. His dedication to mastering the art of trading is as relentless as his pursuit of the next big story. Away from his screens, he can be found in the gym, airpods in, working out and listening to his favorite artist, NF. Or maybe he’s catching some Z’s or scrolling through Elon Musk’s very own X platform—(oops, another screen activity, my bad…)
Well, being an introvert, Edyme thrives in the digital realm, preferring online interaction over offline encounters—(don’t judge, that’s just how he is built). His determination is quite unwavering to be honest, and he embodies the philosophy of continuous improvement, or “kaizen,” striving to be 1% better every day. His mantras, “God knows best” and “Everything is still on track,” reflect his resilient outlook and how he lives his life.
In a nutshell, Samuel Edyme was born efficient, driven by ambition, and perhaps a touch fierce. He’s neither artistic nor unrealistic, and certainly not chauvinistic. Think of him as Bruce Willis in a train wreck—unflappable. Edyme is like trading in your car for a jet—bold. He’s the guy who’d ask his boss for a pay cut just to prove a point—(uhhh…). He is like watching your kid take his first steps. Imagine Bill Gates struggling with rent—okay, maybe that’s a stretch, but you get the idea, yeah. Unbelievable? Yes. Inconceivable? Perhaps.
Edyme sees himself as a fairly reasonable guy, albeit a bit stubborn. Normal to you is not to him. He is not the one to take the easy road, and why would he? That’s just not the way he roll. He has these favorite lyrics from NF’s “Clouds” that resonate deeply with him: “What you think’s probably unfeasible, I’ve done already a hundredfold.”
PS—Edyme is HIM. HIM-buktu. Him-mulation. Him-Kardashian. Himon and Pumba. He even had his DNA tested, and guess what? He’s 100% Him-alayan. Screw it, he ate the opp.

The Ethereum price has been consolidating for about a week since it hit a four-month high at $3,420. As the second largest cryptocurrency, Ethereum has the biggest price correlation with Bitcoin. However, you could argue the Ethereum price has been largely left behind in terms of performance throughout the ongoing bull cycle. Interestingly, a crypto analyst, Ben Lilly, has shared a bold prediction about the trajectory of the Ethereum price.
Taking to a post on the social media platform X, Ben Lilly forecasted that the Ethereum price will reach a new all-time high (ATH) between December 21, 2024, and January 7, 2025. The prediction stems from his analysis of the previous performance of the ETH price movements during Bitcoin’s ATH discovery phase in 2021.
A Historical Parallel: Ethereum’s 2021 Rally
In his analysis, Ben Lilly referenced Ethereum’s price behavior during the historic rally of the Bitcoin price in the 2021 bull run. At the time, the Ethereum price was trading nearly 60% below its 2018 peak. After Bitcoin broke out to fresh ATH levels, it took Ethereum five weeks to follow suit, rallying by about 640% to reach its current ATH of $4,878.
Related Reading
Lilly believes the present market conditions mirror those of 2021, with the Bitcoin price recently entering price discovery mode. Ethereum, which was approximately 50% below its 2021 peak of $4,418 as of November 2024, has started to rebound, showing over 20% gains within just two weeks from a low of $2,366 on November 4.
Interestingly, the analyst’s comments suggest that as the Bitcoin price continues to set new price records this bull run, Ethereum is likely to follow with a substantial price leap very soon. The timeframe for this substantial price leap, he projects, aligns closely with late December 2024 and early January 2025.
Based on his projections, the analyst asserts that Ethereum could repeat its historical pattern and rally significantly within a short timeframe. He highlights that a 300% surge from Ethereum’s November 4 low price level could push it toward the $10,000 mark.
ETH will form a new ATH between Dec 21-Jan7.
I don’t make the rules. pic.twitter.com/NVgVdQ8Bsj
— Ben Lilly (@MrBenLilly) November 20, 2024
Current State Of The Ethereum Price
Ben Lilly’s Ethereum price prediction highlights the importance of the Bitcoin price momentum to that of the second-largest asset. Particularly, the 2021 pattern he pointed to is a result of an altcoin season where the altcoin market (led by Ethereum) started to outperform the Bitcoin price.
Related Reading
As it stands, an altcoin season has yet to materialize this cycle, and all the interest is going into Bitcoin. The Bitcoin price is currently on an all-time high roll, meaning the market will have to continue to wait for the interest to roll into Ethereum.
At the time of writing, the ETH price is trading at $3,107 and is down by 3.84% in the past seven days.
Featured image created with Dall.E, chart from Tradingview.com

Data shows the Ethereum derivatives-related metrics have shot up recently, a sign that the price is at risk of going through a volatile storm.
Ethereum Open Interest & Leverage Ratio Have Both Spiked Recently
In a CryptoQuant Quicktake post, an analyst has discussed about the trend in the derivatives indicators of Ethereum. The metrics in question are the Open Interest and the Estimated Leverage Ratio.
First, the Open Interest keeps track of the total amount of ETH-related contracts that are currently open on all derivatives platforms. The metric naturally takes into account for both long and short positions.
When the value of this metric rises, it means the investors are opening up fresh positions on the market. Such a trend suggests derivatives trading interest in the coin is going up.
On the other hand, the indicator registering a drawdown implies positions in the market are going down. This could be because of investors willfully closing them up, or due to exchanges forcibly liquidating them.
Now, here is a chart that shows the trend in the Ethereum Open Interest over the last few years:

The value of the metric appears to have been shooting up in recent days | Source: CryptoQuant
The above graph shows that the Ethereum Open Interest has witnessed rapid growth recently. It has surpassed the previous all-time high (ATH) to set a new record above $13 billion.
When considering the timeframe of the past four months, the indicator has increased by over 40%, which suggests an explosion in speculative interest around the cryptocurrency has occurred.
This development, however, may not be the healthiest, as the trend in the second indicator of relevance, the Estimated Leverage Ratio, would suggest. This metric measures the ratio between the Open Interest and the Derivatives Exchange Reserve.
The Derivatives Exchange Reserve is naturally just the total amount of the cryptocurrency sitting in wallets associated with all centralized derivatives exchanges.
The Estimated Leverage Ratio tells us the amount of leverage or loan that the average derivatives user in the Ethereum market is currently opting for.
Below is a chart for this indicator.

Looks like the value of the metric has been heading up over the last few weeks | Source: CryptoQuant
From the graph, it’s apparent that the Ethereum Estimated Leverage Ratio has shot up recently. This would mean that the increase in the Open Interest has been more rapid than the rise in the Derivatives Exchange Reserve.
The investors are now sitting on all-time high (ATH) leverage, which can be a bad sign for ETH as it implies any volatility in the future could take down the overleveraged positions and induce a mass liquidation event called a squeeze.
The quant has pointed out that the Ethereum Funding Rate, a ratio between long and short positions, is positive right now, which suggests that if a squeeze is to happen shortly, it’s more likely to involve the bullish side of the market.
ETH Price
At the time of writing, Ethereum is floating around $3,000, down almost 7% over the past week.
The price of the coin seems to have been consolidating sideways recently | Source: ETHUSDT on TradingView
Featured image from Dall-E, CryptoQuant.com, chart from TradingView.com

Ethereum Sees Neutral Netflow On Binance: What Does This Signal?
Trump Media Files Trademark for Crypto Platform TruthFi

UK to unveil crypto and stablecoin regulatory framework early next year

Banana Gun Rises After Justin Sun’s $6.2 Million Art Purchase
Cardano (ADA) Price Hits 41% Weekly Growth, $1 Target in Sight

Why SUI Network Outage Did Not Cause a Price Crash

2.52 Million Altcoins Are Ruining Crypto’s Future

Animoca Brands Valuation Tanks 75% In Two Years, Here’s Why

Crypto exchange BingX hacked for $43 million

Are The Big Players Losing Interest?

Hong Kong’s Securities Association Tips Authorities On Crypto Self-Regulation

Coinbase cbBTC Set to go Live on Solana
2.52 Million Altcoins Are Ruining Crypto’s Future
Animoca Brands Valuation Tanks 75% In Two Years, Here’s Why
Crypto exchange BingX hacked for $43 million
Are The Big Players Losing Interest?
Hong Kong’s Securities Association Tips Authorities On Crypto Self-Regulation
Coinbase cbBTC Set to go Live on Solana
-

 Market18 hours ago
This is Why MoonPay Shattered Solana Transaction Records
-

 Ethereum15 hours ago
Fundraising platform JustGiving accepts over 60 cryptocurrencies including Bitcoin, Ethereum
-
 Regulation23 hours ago
US SEC Pushes Timeline For Franklin Templeton Crypto Index ETF
-

 Market23 hours ago
RENDER Price Soars 48%, But Whale Activity Declines
-
 Regulation22 hours ago
BitClave Investors Get $4.6M Back In US SEC Settlement Distribution
-

 Market21 hours ago
Nvidia Q3 Revenue Soars 95% to $35.1B, Beats Estimates
-

 Market20 hours ago
Dogecoin (DOGE) Price Momentum Weakens Despite Rally
-

 Altcoin20 hours ago
Crypto Analyst Says Dogecoin Price Has Entered Parabolic Surge To $23.36. Here Are The Reasons Why