
Market
Can Solana (SOL) Make It to $200 Before the End of May?

Solana’s (SOL) price is observing support from the institutions to observe considerable gains this month.
As the retail investors also join in, the question remains whether SOL can return to $200 before June.
Solana Is Regaining Institutions’ Favor
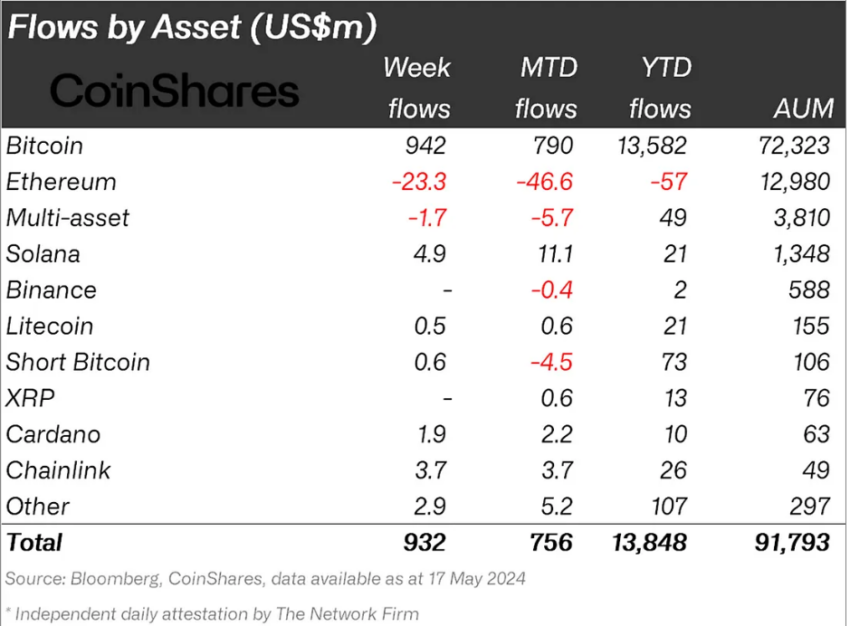
Institutional investors’ actions have always impacted Solana’s price throughout 2022 and 2023. The same bullishness is reviving, with SOL noting $11.1 million in inflows this month.
This surge has made Solana the second best-performing altcoin in institutions’ portfolios after Chainlink, in line with Litecoin’s year-to-date performance.
For the week ending May 17, SOL recorded about $5 million worth of inflows, as the CPI report induced optimism in the crypto market. Since these large wallet holders are known to influence an asset’s price action, it would not be surprising to see Solana react positively in the coming days.
Read More: How to Buy Solana (SOL) and Everything You Need To Know
It’s not just institutions but retail investors who are pining for growth. This is visible in open interest, which represents the total number of active derivative contracts, like options or futures, that have not yet been settled.
It is an important measure of market activity and liquidity, indicating money flow into or out of the market.
This Open Interest rose by $800 million in the past week from $1.77 billion to $2.5 billion. Since the funding rate is positive, it can be ascertained that most of the money has gone towards long contracts.
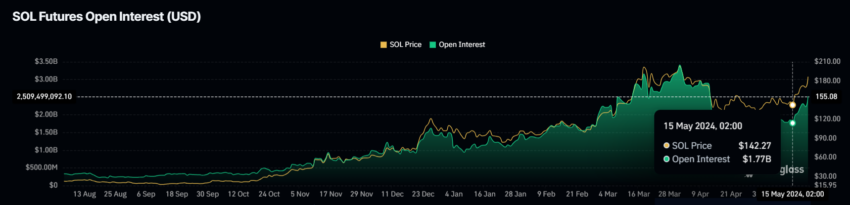
This means that investors are betting on Solana’s price to rise.
SOL Price Prediction: Key Resistance to Watch
Solana’s price bounced off the support at $169 to trade at $180 at the time of writing. While the aforementioned cues are bullish, the altcoin still faces resistance at $191. Breaching this resistance level will enable further growth.
Should SOL reclaim $200 as a support floor, it could rise above $201, marking a new year-to-date high.
Read More: Solana (SOL) Price Prediction 2024/2025/2030
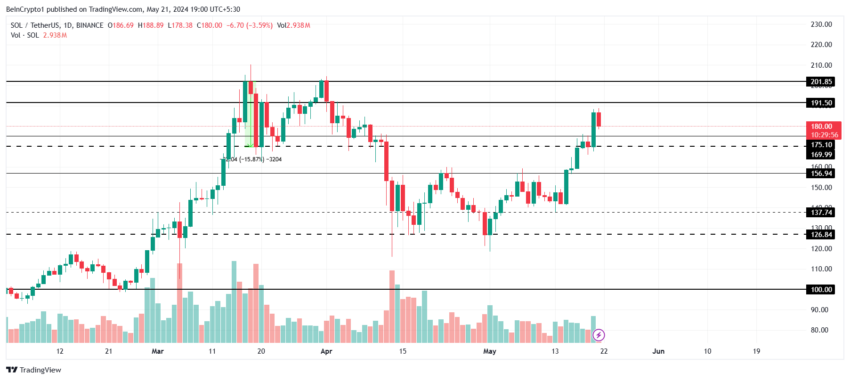
However, if the breach fails, Solana’s price is vulnerable to falling below the support at $175 to hit $169. If the latter support floor is broken, the bullish thesis would be invalidated, potentially sending SOL to $156.
Disclaimer
In line with the Trust Project guidelines, this price analysis article is for informational purposes only and should not be considered financial or investment advice. BeInCrypto is committed to accurate, unbiased reporting, but market conditions are subject to change without notice. Always conduct your own research and consult with a professional before making any financial decisions. Please note that our Terms and Conditions, Privacy Policy, and Disclaimers have been updated.


Aayush Jindal, a luminary in the world of financial markets, whose expertise spans over 15 illustrious years in the realms of Forex and cryptocurrency trading. Renowned for his unparalleled proficiency in providing technical analysis, Aayush is a trusted advisor and senior market expert to investors worldwide, guiding them through the intricate landscapes of modern finance with his keen insights and astute chart analysis.
From a young age, Aayush exhibited a natural aptitude for deciphering complex systems and unraveling patterns. Fueled by an insatiable curiosity for understanding market dynamics, he embarked on a journey that would lead him to become one of the foremost authorities in the fields of Forex and crypto trading. With a meticulous eye for detail and an unwavering commitment to excellence, Aayush honed his craft over the years, mastering the art of technical analysis and chart interpretation.
As a software engineer, Aayush harnesses the power of technology to optimize trading strategies and develop innovative solutions for navigating the volatile waters of financial markets. His background in software engineering has equipped him with a unique skill set, enabling him to leverage cutting-edge tools and algorithms to gain a competitive edge in an ever-evolving landscape.
In addition to his roles in finance and technology, Aayush serves as the director of a prestigious IT company, where he spearheads initiatives aimed at driving digital innovation and transformation. Under his visionary leadership, the company has flourished, cementing its position as a leader in the tech industry and paving the way for groundbreaking advancements in software development and IT solutions.
Despite his demanding professional commitments, Aayush is a firm believer in the importance of work-life balance. An avid traveler and adventurer, he finds solace in exploring new destinations, immersing himself in different cultures, and forging lasting memories along the way. Whether he’s trekking through the Himalayas, diving in the azure waters of the Maldives, or experiencing the vibrant energy of bustling metropolises, Aayush embraces every opportunity to broaden his horizons and create unforgettable experiences.
Aayush’s journey to success is marked by a relentless pursuit of excellence and a steadfast commitment to continuous learning and growth. His academic achievements are a testament to his dedication and passion for excellence, having completed his software engineering with honors and excelling in every department.
At his core, Aayush is driven by a profound passion for analyzing markets and uncovering profitable opportunities amidst volatility. Whether he’s poring over price charts, identifying key support and resistance levels, or providing insightful analysis to his clients and followers, Aayush’s unwavering dedication to his craft sets him apart as a true industry leader and a beacon of inspiration to aspiring traders around the globe.
In a world where uncertainty reigns supreme, Aayush Jindal stands as a guiding light, illuminating the path to financial success with his unparalleled expertise, unwavering integrity, and boundless enthusiasm for the markets.

Global investment management firm VanEck has officially registered a statutory trust in Delaware for Binance’s BNB (BNB) exchange-traded fund (ETF).
This move marks the first attempt to launch a spot BNB ETF in the United States. It could potentially open new avenues for institutional and retail investors to gain exposure to the asset through a regulated investment vehicle.
VanEck Moves Forward with BNB ETF
The trust was registered on March 31 under the name “VanEck BNB ETF” with filing number 10148820. It was recorded on Delaware’s official state website.

The proposed BNB ETF would track the price of BNB. It is the native cryptocurrency of the BNB Chain ecosystem, developed by the cryptocurrency exchange Binance.
As per the latest data, BNB ranks as the fifth-largest cryptocurrency by market capitalization at $87.1 billion. Despite its significant market position, both BNB’s price and the broader cryptocurrency market have faced some challenges recently.
Over the past month, the altcoin’s value has declined 2.2%. At the time of writing, BNB was trading at $598. This represented a 1.7% dip in the last 24 hours, according to data from BeInCrypto.

While the trust filing hasn’t yet led to a price uptick, the community remains optimistic about the prospects of BNB, especially with this new development.
“Send BNB to the moon now,” an analyst posted on X (formerly Twitter).
The filing comes just weeks after VanEck made a similar move for Avalanche (AVAX). On March 10, VanEck registered a trust for an AVAX-focused ETF.
This was quickly followed by the filing of an S-1 registration statement with the US Securities and Exchange Commission (SEC). Given this precedent, a similar S-1 filing for a BNB ETF could follow soon.
“A big step toward bringing BNB to US institutional investors!” another analyst wrote.
Meanwhile, the industry has seen an influx of crypto fund applications at the SEC following the election of a pro-crypto administration. In fact, a recent survey revealed that 71% of ETF investors are bullish on crypto and plan to increase their allocations to cryptocurrency ETFs in the next 12 months.
“Three-quarters of allocators expect to increase their investment in cryptocurrency-focused ETFs over the next 12 months, with demand highest in Asia (80%), and the US (76%), in contrast to Europe (59%),” the survey revealed.
This growing interest in crypto ETFs could drive further demand for assets like BNB, making the VanEck BNB ETF a potentially significant product in the market.
Disclaimer
In adherence to the Trust Project guidelines, BeInCrypto is committed to unbiased, transparent reporting. This news article aims to provide accurate, timely information. However, readers are advised to verify facts independently and consult with a professional before making any decisions based on this content. Please note that our Terms and Conditions, Privacy Policy, and Disclaimers have been updated.

XRP price started a fresh decline from the $2.20 zone. The price is now consolidating and might face hurdles near the $2.120 level.
- XRP price started a fresh decline after it failed to clear the $2.20 resistance zone.
- The price is now trading below $2.150 and the 100-hourly Simple Moving Average.
- There is a connecting bearish trend line forming with resistance at $2.120 on the hourly chart of the XRP/USD pair (data source from Kraken).
- The pair might extend losses if it fails to clear the $2.20 resistance zone.
XRP Price Faces Rejection
XRP price failed to continue higher above the $2.20 resistance zone and reacted to the downside, like Bitcoin and Ethereum. The price declined below the $2.150 and $2.120 levels.
The bears were able to push the price below the 50% Fib retracement level of the recovery wave from the $2.023 swing low to the $2.199 high. There is also a connecting bearish trend line forming with resistance at $2.120 on the hourly chart of the XRP/USD pair.
The price is now trading below $2.150 and the 100-hourly Simple Moving Average. However, the bulls are now active near the $2.10 support level. They are protecting the 61.8% Fib retracement level of the recovery wave from the $2.023 swing low to the $2.199 high.

On the upside, the price might face resistance near the $2.120 level and the trend line zone. The first major resistance is near the $2.150 level. The next resistance is $2.20. A clear move above the $2.20 resistance might send the price toward the $2.240 resistance. Any more gains might send the price toward the $2.2650 resistance or even $2.2880 in the near term. The next major hurdle for the bulls might be $2.320.
Another Decline?
If XRP fails to clear the $2.150 resistance zone, it could start another decline. Initial support on the downside is near the $2.10 level. The next major support is near the $2.0650 level.
If there is a downside break and a close below the $2.0650 level, the price might continue to decline toward the $2.020 support. The next major support sits near the $2.00 zone.
Technical Indicators
Hourly MACD – The MACD for XRP/USD is now gaining pace in the bearish zone.
Hourly RSI (Relative Strength Index) – The RSI for XRP/USD is now below the 50 level.
Major Support Levels – $2.10 and $2.050.
Major Resistance Levels – $2.120 and $2.20.
Will Cardano Price Bounce Back to $0.70 or Crash to $0.60?

Why A Massive Drop To $1,400 Could Rock The Underperformer

How Will Elon Musk Leaving DOGE Impact Dogecoin Price?

Whales Dump 760,000 Ethereum in Two Weeks — Is More Selling Ahead?
Here’s Why This Analyst Believes XRP Price Could Surge 44x

Kraken Obtains Restricted Dealer Registration in Canada

2.52 Million Altcoins Are Ruining Crypto’s Future

Animoca Brands Valuation Tanks 75% In Two Years, Here’s Why

Crypto exchange BingX hacked for $43 million

Are The Big Players Losing Interest?

Hong Kong’s Securities Association Tips Authorities On Crypto Self-Regulation

Coinbase cbBTC Set to go Live on Solana
2.52 Million Altcoins Are Ruining Crypto’s Future
Animoca Brands Valuation Tanks 75% In Two Years, Here’s Why
Crypto exchange BingX hacked for $43 million
Are The Big Players Losing Interest?
Hong Kong’s Securities Association Tips Authorities On Crypto Self-Regulation
Coinbase cbBTC Set to go Live on Solana
-

 Market18 hours ago
Bitcoin Price Bounces Back—Can It Finally Break Resistance?
-

 Bitcoin23 hours ago
Bitcoin Could Serve as Inflation Hedge or Tech Stock, Say Experts
-
 Market22 hours ago
SUI Price Stalls After Major $147 Million Token Unlock
-

 Market21 hours ago
BeInCrypto US Morning Briefing: Standard Chartered and Bitcoin
-

 Market20 hours ago
Analyst Reveals ‘Worst Case Scenario’ With Head And Shoulders Formation
-

 Market13 hours ago
BNB Price Faces More Downside—Can Bulls Step In?
-

 Altcoin18 hours ago
Tether Expands Bitcoin Reserves with 8,888 BTC Buy—What’s the Plan?
-

 Market17 hours ago
Ethereum Price Approaches Resistance—Will It Smash Through?