
Market
Solana DEXs Outperformed Rivals with 210 Million Transactions

Decentralized exchanges (DEXs) on the Solana blockchain have outperformed those on other networks, recording 210 million transactions over the past 30 days.
This performance reflects Solana’s increasing role in the decentralized finance (DeFi) ecosystem and its capacity to efficiently handle a high volume of transactions.
What Drives Solana’s Success in DEX Transactions?
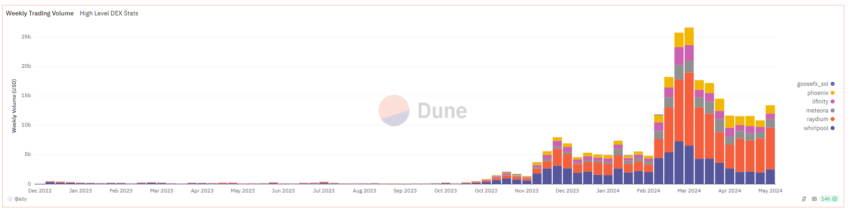
Data from the Dune dashboard shows that Solana’s DEXs have significantly outperformed 15 other layer-1 (L1) and layer-2 (L2) blockchains. These include Ethereum, BNB Chain, and Arbitrum.
Solana’s 210 million transactions over the past 30 days place it far ahead of its nearest competitors. BNB Chain recorded 29 million transactions, while Arbitrum had 13 million. Ethereum, a major player in the DeFi space, managed only 6.7 million transactions, putting it in fifth place.
Moreover, Solana’s DEXs also saw a remarkable total volume of $47.75 billion and over 11 million unique traders within the same timeframe. These numbers contrast sharply with BNB Chain, which reported a total volume of $20.54 billion and over 4.6 million unique traders.
Raydium, a leading Solana DEX, emerged as a key player with an average weekly trading volume of approximately $5 million. Whirlpool and Meteora followed closely, each with average weekly trading volumes of around $1.4 million. Notably, these figures do not include data from some popular Solana DEXs, such as Orca.
Read more: Top 7 Projects on Solana With Massive Potential
The Solana native token (SOL) primarily drove the high transaction numbers. It accounted for roughly 40% of the transactions. Additionally, meme coins and low-capitalization tokens contributed between 20% and 30% of the transactions.
These figures are particularly noteworthy given that meme coins played a significant role in Solana’s performance in Q1 2024. BeInCrypto reported that the market cap of the top 10 Solana meme coins skyrocketed by over 800% during that period. By the end of March, these assets reached a total market capitalization of $9.36 billion.
Solana’s achievements extend beyond transaction numbers. A recent report from CoinGecko highlighted Solana as the fastest among major blockchains. As of April 6, 2024, it had an actual daily average of 1,504 transactions per second (TPS). This speed is 46 times faster than Ethereum and more than five times faster than Polygon—the fastest Ethereum scaling solution.
Read more: How to Buy Solana Meme Coins: A Step-By-Step Guide
“Despite ranking as the fastest blockchain, Solana has still only achieved 1.6% of its theoretical maximum speed of 65,000 TPS,” the report reads.
Disclaimer
In adherence to the Trust Project guidelines, BeInCrypto is committed to unbiased, transparent reporting. This news article aims to provide accurate, timely information. However, readers are advised to verify facts independently and consult with a professional before making any decisions based on this content. Please note that our Terms and Conditions, Privacy Policy, and Disclaimers have been updated.


Dogecoin started a fresh decline from the $0.1880 zone against the US Dollar. DOGE is declining and might test the $0.150 support zone.
- DOGE price started a fresh decline below the $0.1850 and $0.1750 levels.
- The price is trading below the $0.1750 level and the 100-hourly simple moving average.
- There is a key bearish trend line forming with resistance at $0.170 on the hourly chart of the DOGE/USD pair (data source from Kraken).
- The price could extend losses if it breaks the $0.1620 support zone.
Dogecoin Price Dips Further
Dogecoin price started a fresh decline after it failed to clear $0.200, like Bitcoin and Ethereum. DOGE dipped below the $0.1880 and $0.1820 support levels.
The bears were able to push the price below the $0.1750 support level. It even traded close to the $0.1620 support. A low was formed at $0.1628 and the price is now consolidating losses below the 23.6% Fib retracement level of the downward move from the $0.2057 swing high to the $0.1628 low.
Dogecoin price is now trading below the $0.1750 level and the 100-hourly simple moving average. Immediate resistance on the upside is near the $0.170 level. There is also a key bearish trend line forming with resistance at $0.170 on the hourly chart of the DOGE/USD pair.
The first major resistance for the bulls could be near the $0.1730 level. The next major resistance is near the $0.1770 level. A close above the $0.1770 resistance might send the price toward the $0.1850 resistance.

The 50% Fib retracement level of the downward move from the $0.2057 swing high to the $0.1628 low is also near the $0.1850 zone. Any more gains might send the price toward the $0.1880 level. The next major stop for the bulls might be $0.1950.
More Losses In DOGE?
If DOGE’s price fails to climb above the $0.1770 level, it could start another decline. Initial support on the downside is near the $0.1635 level. The next major support is near the $0.1620 level.
The main support sits at $0.1550. If there is a downside break below the $0.1550 support, the price could decline further. In the stated case, the price might decline toward the $0.1320 level or even $0.120 in the near term.
Technical Indicators
Hourly MACD – The MACD for DOGE/USD is now gaining momentum in the bearish zone.
Hourly RSI (Relative Strength Index) – The RSI for DOGE/USD is now below the 50 level.
Major Support Levels – $0.1620 and $0.1550.
Major Resistance Levels – $0.1720 and $0.1770.

Aayush Jindal, a luminary in the world of financial markets, whose expertise spans over 15 illustrious years in the realms of Forex and cryptocurrency trading. Renowned for his unparalleled proficiency in providing technical analysis, Aayush is a trusted advisor and senior market expert to investors worldwide, guiding them through the intricate landscapes of modern finance with his keen insights and astute chart analysis.
From a young age, Aayush exhibited a natural aptitude for deciphering complex systems and unraveling patterns. Fueled by an insatiable curiosity for understanding market dynamics, he embarked on a journey that would lead him to become one of the foremost authorities in the fields of Forex and crypto trading. With a meticulous eye for detail and an unwavering commitment to excellence, Aayush honed his craft over the years, mastering the art of technical analysis and chart interpretation.
As a software engineer, Aayush harnesses the power of technology to optimize trading strategies and develop innovative solutions for navigating the volatile waters of financial markets. His background in software engineering has equipped him with a unique skill set, enabling him to leverage cutting-edge tools and algorithms to gain a competitive edge in an ever-evolving landscape.
In addition to his roles in finance and technology, Aayush serves as the director of a prestigious IT company, where he spearheads initiatives aimed at driving digital innovation and transformation. Under his visionary leadership, the company has flourished, cementing its position as a leader in the tech industry and paving the way for groundbreaking advancements in software development and IT solutions.
Despite his demanding professional commitments, Aayush is a firm believer in the importance of work-life balance. An avid traveler and adventurer, he finds solace in exploring new destinations, immersing himself in different cultures, and forging lasting memories along the way. Whether he’s trekking through the Himalayas, diving in the azure waters of the Maldives, or experiencing the vibrant energy of bustling metropolises, Aayush embraces every opportunity to broaden his horizons and create unforgettable experiences.
Aayush’s journey to success is marked by a relentless pursuit of excellence and a steadfast commitment to continuous learning and growth. His academic achievements are a testament to his dedication and passion for excellence, having completed his software engineering with honors and excelling in every department.
At his core, Aayush is driven by a profound passion for analyzing markets and uncovering profitable opportunities amidst volatility. Whether he’s poring over price charts, identifying key support and resistance levels, or providing insightful analysis to his clients and followers, Aayush’s unwavering dedication to his craft sets him apart as a true industry leader and a beacon of inspiration to aspiring traders around the globe.
In a world where uncertainty reigns supreme, Aayush Jindal stands as a guiding light, illuminating the path to financial success with his unparalleled expertise, unwavering integrity, and boundless enthusiasm for the markets.
Reason to trust
![]()
Strict editorial policy that focuses on accuracy, relevance, and impartiality
Created by industry experts and meticulously reviewed
The highest standards in reporting and publishing
Strict editorial policy that focuses on accuracy, relevance, and impartiality
Morbi pretium leo et nisl aliquam mollis. Quisque arcu lorem, ultricies quis pellentesque nec, ullamcorper eu odio.
Ethereum price started another decline and traded below the $1,880 level. ETH is now consolidating and remains at risk of more losses.
- Ethereum struggled to continue higher above the $2,000 resistance level.
- The price is trading below $1,880 and the 100-hourly Simple Moving Average.
- There is a connecting bearish trend line forming with resistance at $1,820 on the hourly chart of ETH/USD (data feed via Kraken).
- The pair must clear the $1,820 and $1,880 resistance levels to start a decent increase.
Ethereum Price Dips Again
Ethereum price failed to continue higher above $2,100 and started another decline, like Bitcoin. ETH declined below the $1,920 and $1,880 support levels.
It tested the $1,765 zone. A low was formed at $1,767 and the price recently attempted a fresh upward move. There was a move above the $1,800 level but the price is still below the 23.6% Fib retracement level of the recent decline from the $2,033 swing high to the $1,767 low.
Ethereum price is now trading below $1,880 and the 100-hourly Simple Moving Average. There is also a connecting bearish trend line forming with resistance at $1,820 on the hourly chart of ETH/USD.
On the upside, the price seems to be facing hurdles near the $1,820 level. The next key resistance is near the $1,880 level and the 50% Fib retracement level of the recent decline from the $2,033 swing high to the $1,767 low. The first major resistance is near the $1,920 level.

A clear move above the $1,920 resistance might send the price toward the $2,000 resistance. An upside break above the $2,000 resistance might call for more gains in the coming sessions. In the stated case, Ether could rise toward the $2,050 resistance zone or even $2,120 in the near term.
More Losses In ETH?
If Ethereum fails to clear the $1,880 resistance, it could start another decline. Initial support on the downside is near the $1,780 level. The first major support sits near the $1,765 zone.
A clear move below the $1,765 support might push the price toward the $1,720 support. Any more losses might send the price toward the $1,680 support level in the near term. The next key support sits at $1,650.
Technical Indicators
Hourly MACD – The MACD for ETH/USD is losing momentum in the bearish zone.
Hourly RSI – The RSI for ETH/USD is now below the 50 zone.
Major Support Level – $1,765
Major Resistance Level – $1,880

Dogecoin (DOGE) Bulls In Trouble—Can They Prevent a Drop Below $0.15?

XRP Price Fate Hangs on $2.00—Major Move Incoming?

Ethereum Price Weakens—Can Bulls Prevent a Major Breakdown?

Bitcoin Bears Tighten Grip—Where’s the Next Support?

Cardano Price Eyes Massive Pump In May Following Cyclical Patern From 2024

Solana (SOL) Price Risks Dip Below $110 as Bears Gain Control

2.52 Million Altcoins Are Ruining Crypto’s Future

Animoca Brands Valuation Tanks 75% In Two Years, Here’s Why

Crypto exchange BingX hacked for $43 million

Are The Big Players Losing Interest?

Hong Kong’s Securities Association Tips Authorities On Crypto Self-Regulation

Coinbase cbBTC Set to go Live on Solana
2.52 Million Altcoins Are Ruining Crypto’s Future
Animoca Brands Valuation Tanks 75% In Two Years, Here’s Why
Crypto exchange BingX hacked for $43 million
Are The Big Players Losing Interest?
Hong Kong’s Securities Association Tips Authorities On Crypto Self-Regulation
Coinbase cbBTC Set to go Live on Solana
-
 Market21 hours ago
Whale Leverages $27.5 Million PEPE Long on Hyperliquid
-

 Ethereum20 hours ago
Ethereum May Have Hit Cycle Bottom, But Pricing Bands Signal Strong Resistance At $2,300
-
 Ethereum19 hours ago
Ethereum Analyst Eyes $1,200-$1,300 Level As Potential Acquisition Zone – Details
-

 Ethereum18 hours ago
Whales Accumulate 470,000 Ethereum In One Week – Bullish Momentum Ahead?
-

 Market23 hours ago
Can Ethereum’s Utility Make a Comeback Against Bitcoin?
-

 Ethereum22 hours ago
Ethereum Playing Catch-Up? Bloomberg Examines ETH’s Struggles In New Report
-

 Market14 hours ago
Top 3 Made in USA Coins to Watch This Week
-

 Ethereum21 hours ago
Ethereum MVRV Ratio Nears 160-Day MA Crossover – Accumulation Trend Ahead?