
Market
Lido and Paradigm Back Symbiotic, Rival to EigenLayer

A recent report reveals that Konstantin Lomashuk and Vasiliy Shapovalov, co-founder of Lido—the largest liquid staking protocol in Ethereum (ETH)—fund a competitor of Ethereum’s restaking protocol EigenLayer.
According to a source familiar with this matter, Symbiotic is the protocol that will receive Lido co-founder’s backing. It will get support through the Cyber Fund.
Symbiotic Also Gains Backing from Paradigm
In addition to Lido’s co-founders, Symbiotic has support from Paradigm, a well-known venture capital (VC) firm in the crypto industry. Paradigm is also one of Lido’s main investors.
The report further reveals that Paradigm initially approached Sreeram Kannan, co-founder of EigenLayer, to invest in the project. However, Sreeram Kannan rejected Paradigm’s offer and accepted investment from Andreessen Horowitz (a16z) instead.
Since its introduction in October 2020, Lido has become a breakthrough in the decentralized finance (DeFi) sector. It developed a protocol that allows users to stake their ETH and receive Lido Staked ETH (stETH) tokens, which can be used for various things.
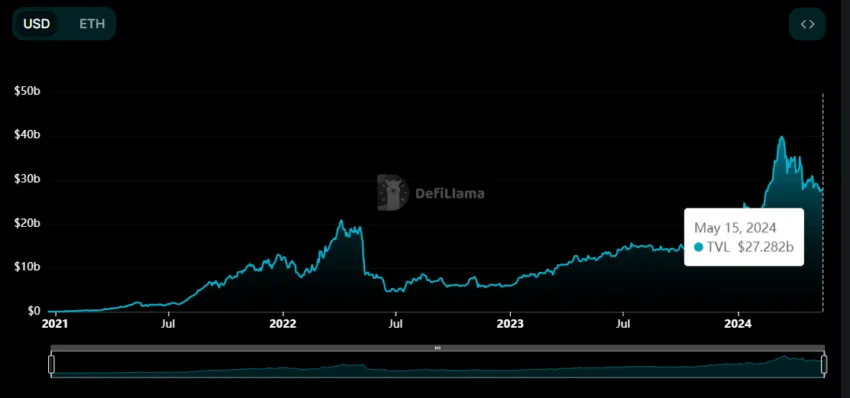
Lido has proven so popular that it is now Ethereum’s largest DeFi protocol. According to DeFiLlama data, Lido now has a total value locked (TVL) of $27.28 billion.
Read more: The Ultimate Guide to Lido Staked ETH (stETH)
Meanwhile, EigenLayer is currently the second largest DeFi protocol with a TVL of $14.29 billion. Since EigenLayer achieved this figure relatively quickly, its presence may threaten Lido. Therefore, it is plausible that Lido plans to back EigenLayer’s competitor to maintain its dominance.
How is Symbiotic Different from EigenLayer?
The report also explained how Symbiotic works. This protocol will be permissionless, providing a flexible mechanism for decentralized networks to coordinate node operators and economic security providers.
“Symbiotic will offer a way for decentralized applications, called actively validated services, or “AVSs,” to collectively secure one another. Users will be able to restake assets that they’ve deposited with other crypto protocols to help secure these AVSs,” the report reads.
Unlike EigenLayer, Symbiotic will enable users to deposit any assets based on Ethereum’s ERC-20 token standard directly into its protocol. This means Symbiotic will be directly compatible with stETH and thousands of other crypto tokens that use the ERC-20 token standard.
Meanwhile, EigenLayer currently accepts ETH assets, several ETH-linked liquid staking tokens (LST), and native EIGEN tokens. However, Symbiotic will not accept ETH deposits at all. Instead, it allows users to stake using stETH and other popular assets that are not natively compatible with EigenLayer.
However, it remains to be seen when Symbiotic will launch. Some sources said this project would be released at the end of 2024.
Indeed, restaking is one of the most interesting crypto narratives in 2024. A recent report from CoinGecko noted that EigenLayer’s restaking contributed to the Ethereum ecosystem’s achievement in Q1 2024.
In the quarter, restaking on EigenLayer increased by 36%, with a total of 4.3 million ETH being restaked. The majority of restaked ETH was held by Liquid Restaking Protocols (LRTs), which amounted to 2.28 million ETH.
Read more: Ethereum Restaking: What Is It And How Does It Work?
The allure of restaking extends beyond Ethereum. BeInCrypto previously reported that Jito, a liquid staking protocol on Solana, was rumored to create its restaking services.
Disclaimer
In adherence to the Trust Project guidelines, BeInCrypto is committed to unbiased, transparent reporting. This news article aims to provide accurate, timely information. However, readers are advised to verify facts independently and consult with a professional before making any decisions based on this content. Please note that our Terms and Conditions, Privacy Policy, and Disclaimers have been updated.


Ethereum price started a fresh increase above the $3,220 zone. ETH is rising and aiming for more gains above the $3,350 resistance.
- Ethereum started a fresh increase above the $3,220 and $3,300 levels.
- The price is trading above $3,250 and the 100-hourly Simple Moving Average.
- There is a short-term contracting triangle forming with resistance at $3,360 on the hourly chart of ETH/USD (data feed via Kraken).
- The pair could gain bullish momentum if it clears the $3,385 resistance zone.
Ethereum Price Regains Traction
Ethereum price remained supported above $3,000 and started a fresh increase like Bitcoin. ETH gained pace for a move above the $3,150 and $3,220 resistance levels.
The bulls pumped the price above the $3,300 level. It gained over 10% and traded as high as $3,387. It is now consolidating gains above the 23.6% Fib retracement level of the recent move from the $3,036 swing low to the $3,387 high.
Ethereum price is now trading above $3,220 and the 100-hourly Simple Moving Average. On the upside, the price seems to be facing hurdles near the $3,350 level. There is also a short-term contracting triangle forming with resistance at $3,360 on the hourly chart of ETH/USD.

The first major resistance is near the $3,385 level. The main resistance is now forming near $3,420. A clear move above the $3,420 resistance might send the price toward the $3,550 resistance. An upside break above the $3,550 resistance might call for more gains in the coming sessions. In the stated case, Ether could rise toward the $3,650 resistance zone or even $3,880.
Another Decline In ETH?
If Ethereum fails to clear the $3,350 resistance, it could start another decline. Initial support on the downside is near the $3,300 level. The first major support sits near the $3,250 zone.
A clear move below the $3,250 support might push the price toward $3,220 or the 50% Fib retracement level of the recent move from the $3,036 swing low to the $3,387 high. Any more losses might send the price toward the $3,150 support level in the near term. The next key support sits at $3,050.
Technical Indicators
Hourly MACD – The MACD for ETH/USD is gaining momentum in the bullish zone.
Hourly RSI – The RSI for ETH/USD is now above the 50 zone.
Major Support Level – $3,250
Major Resistance Level – $3,385
Ethereum price started a fresh increase above the $3,220 zone. ETH is rising and aiming for more gains above the $3,350 resistance.
- Ethereum started a fresh increase above the $3,220 and $3,300 levels.
- The price is trading above $3,250 and the 100-hourly Simple Moving Average.
- There is a short-term contracting triangle forming with resistance at $3,360 on the hourly chart of ETH/USD (data feed via Kraken).
- The pair could gain bullish momentum if it clears the $3,385 resistance zone.
Ethereum Price Regains Traction
Ethereum price remained supported above $3,000 and started a fresh increase like Bitcoin. ETH gained pace for a move above the $3,150 and $3,220 resistance levels.
The bulls pumped the price above the $3,300 level. It gained over 10% and traded as high as $3,387. It is now consolidating gains above the 23.6% Fib retracement level of the recent move from the $3,036 swing low to the $3,387 high.
Ethereum price is now trading above $3,220 and the 100-hourly Simple Moving Average. On the upside, the price seems to be facing hurdles near the $3,350 level. There is also a short-term contracting triangle forming with resistance at $3,360 on the hourly chart of ETH/USD.
The first major resistance is near the $3,385 level. The main resistance is now forming near $3,420. A clear move above the $3,420 resistance might send the price toward the $3,550 resistance. An upside break above the $3,550 resistance might call for more gains in the coming sessions. In the stated case, Ether could rise toward the $3,650 resistance zone or even $3,880.
Another Decline In ETH?
If Ethereum fails to clear the $3,350 resistance, it could start another decline. Initial support on the downside is near the $3,300 level. The first major support sits near the $3,250 zone.
A clear move below the $3,250 support might push the price toward $3,220 or the 50% Fib retracement level of the recent move from the $3,036 swing low to the $3,387 high. Any more losses might send the price toward the $3,150 support level in the near term. The next key support sits at $3,050.
Technical Indicators
Hourly MACD – The MACD for ETH/USD is gaining momentum in the bullish zone.
Hourly RSI – The RSI for ETH/USD is now above the 50 zone.
Major Support Level – $3,250
Major Resistance Level – $3,385

GOAT price has skyrocketed 214.29% in one month, recently breaking into the $1 billion market cap and securing its place as the 10th largest meme coin. It now stands just ahead of MOG, which closely trails its position in the rankings.
However, recent indicators suggest that GOAT’s uptrend may be weakening, raising questions about whether it can sustain its rally or face a potential correction.
GOAT BBTrend Is Negative For The First Time In 4 Days
GOAT BBTrend has turned negative for the first time since November 17, now sitting at -0.54. This shift suggests that bearish momentum is beginning to take hold, with the asset’s recent upward trajectory starting to weaken potentially.
BBTrend measures the strength and direction of price trends using Bollinger Bands, with positive values indicating an uptrend and negative values signaling a downtrend. A negative BBTrend reflects increased downward pressure, which could indicate the start of a broader market shift.
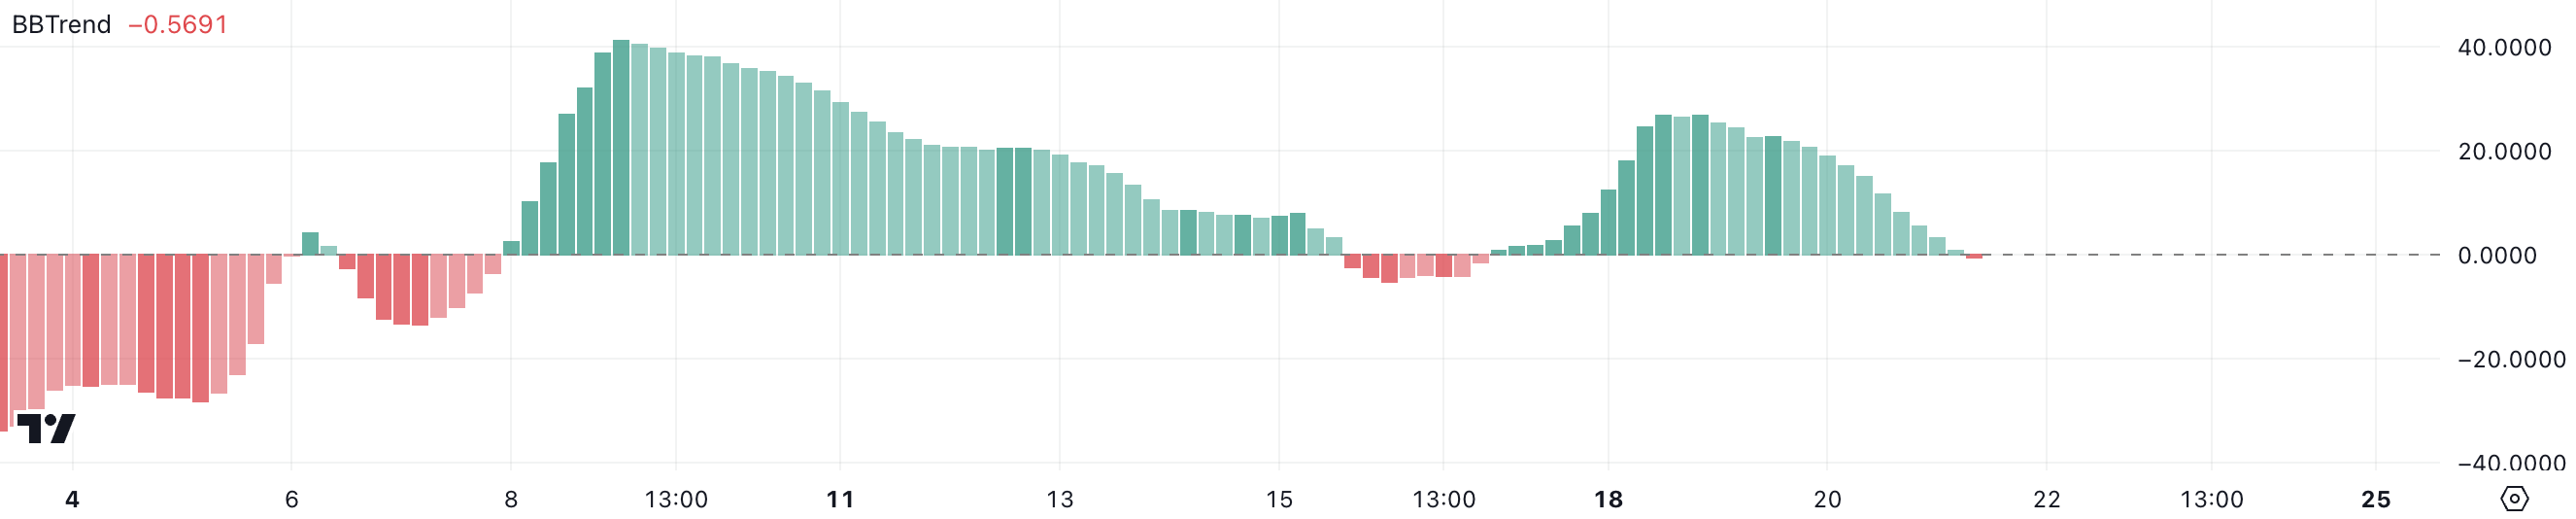
GOAT has had an impressive November, gaining 61% and reaching a new all-time high on November 17.
However, the current negative BBTrend, if it persists and grows, could signal the potential for further bearish momentum.
GOAT Is In A Neutral Zone
GOAT’s RSI has dropped to 52, down from over 70 a few days ago when it reached its all-time high. This decline indicates that buying momentum has cooled off, and the market has moved out of the overbought zone.
The drop suggests a shift toward a more neutral sentiment as traders consolidate gains and the strong bullish pressure seen earlier subsides.
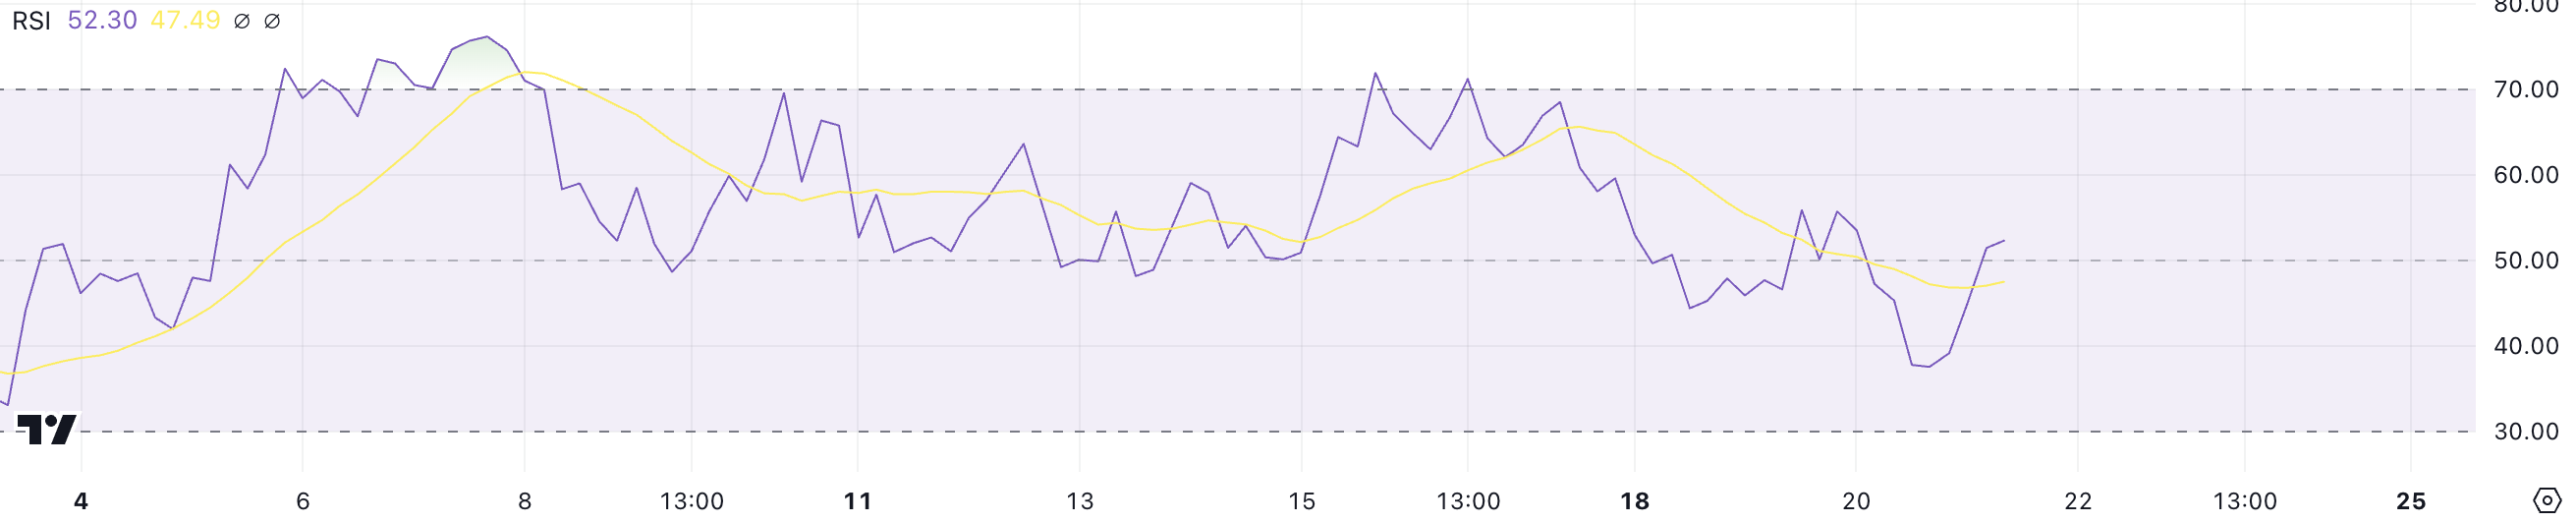
RSI measures the strength and velocity of price changes, with values above 70 indicating overbought conditions and below 30 signaling oversold levels. At 52, GOAT’s RSI is in a neutral zone, neither signaling strong bullish nor bearish momentum.
This could mean the current uptrend is losing strength, and the price may consolidate or move sideways unless renewed buying pressure reignites upward momentum.
GOAT Price Prediction: A New Surge Until $1.50?
If GOAT current uptrend regains strength, it could retest its all-time high of $1.37, establishing its market cap above $1 billion, a fundamental threshold for being among the biggest meme coins in the market today.
Breaking above this level could pave the way for further gains, potentially reaching the next thresholds at $1.40 or even $1.50, signaling renewed bullish momentum and market confidence.
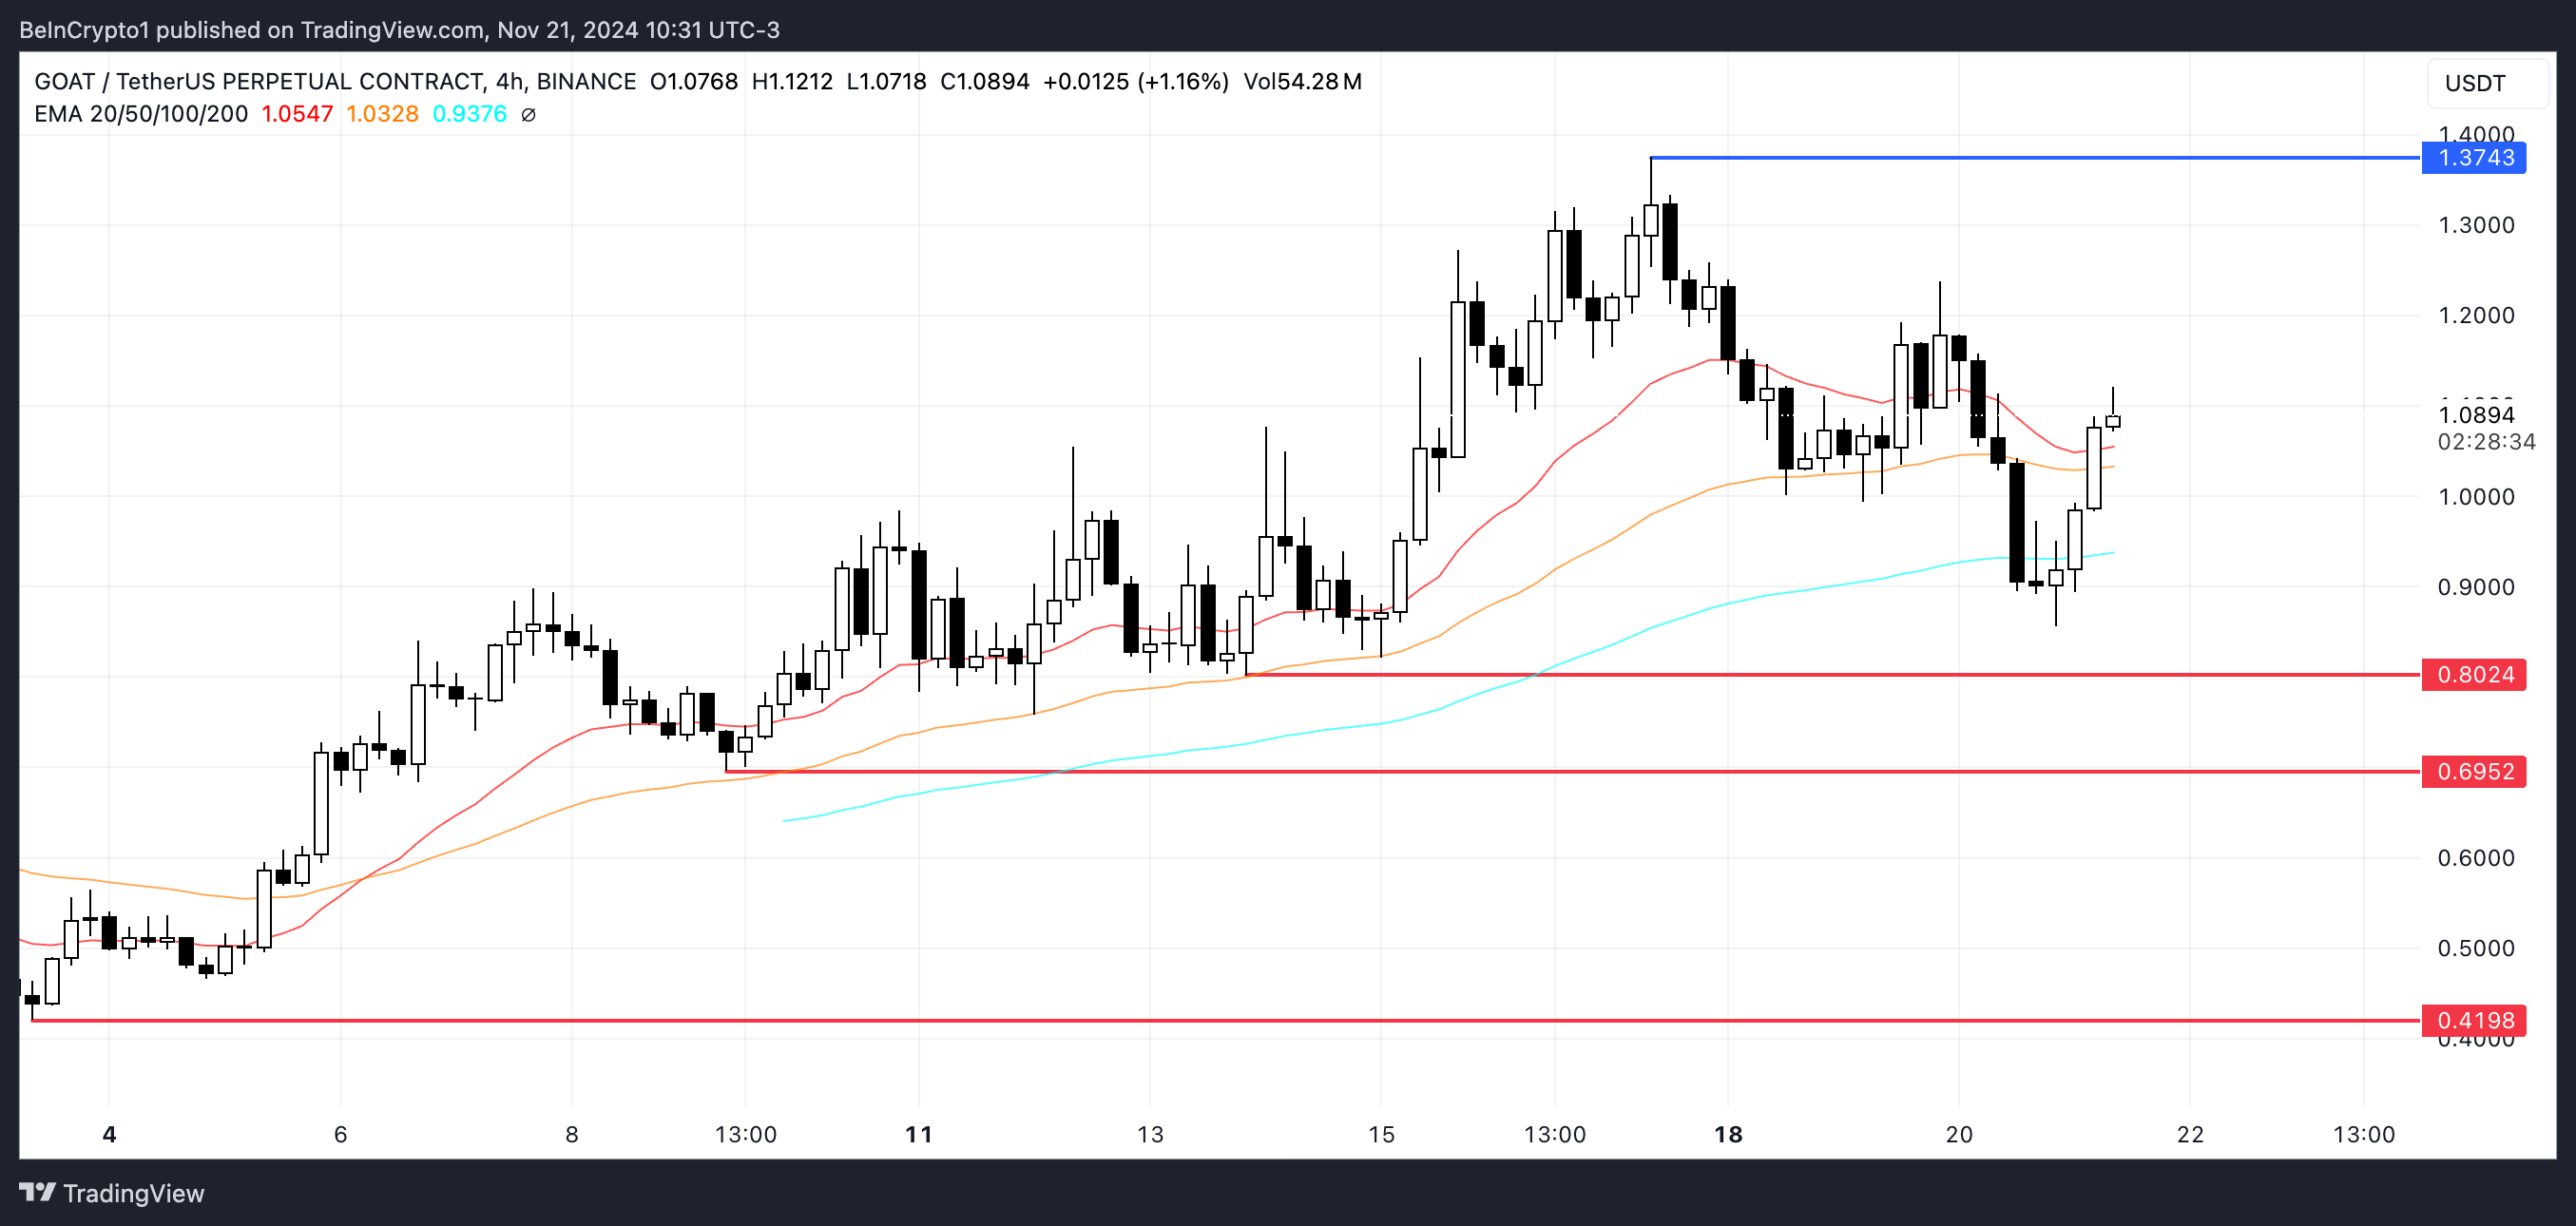
However, as shown by indicators like RSI and BBTrend, the uptrend may be losing steam. If a downtrend emerges, GOAT price could test its nearest support zones at $0.80 and $0.69.
Should these levels fail to hold, the price could fall further, potentially reaching $0.419, putting its position in the top 10 ranking of biggest meme coins at risk.
Disclaimer
In line with the Trust Project guidelines, this price analysis article is for informational purposes only and should not be considered financial or investment advice. BeInCrypto is committed to accurate, unbiased reporting, but market conditions are subject to change without notice. Always conduct your own research and consult with a professional before making any financial decisions. Please note that our Terms and Conditions, Privacy Policy, and Disclaimers have been updated.

BTC Surges to $99K, ETH Shoots, XRP Jumps 25%

Rallies 10% and Targets More Upside
Rallies 10% and Targets More Upside

“Crypto Dad” Chris Giancarlo Emerges Top For White House Crypto Czar Role
Dogecoin Code Appears In CyberTruck And Model 3 Website, Will Tesla Accept DOGE Payments For Cars Soon?

GOAT Price Sees Slower Growth After Reaching $1B Market Cap

2.52 Million Altcoins Are Ruining Crypto’s Future

Animoca Brands Valuation Tanks 75% In Two Years, Here’s Why

Crypto exchange BingX hacked for $43 million

Are The Big Players Losing Interest?

Hong Kong’s Securities Association Tips Authorities On Crypto Self-Regulation

Coinbase cbBTC Set to go Live on Solana
2.52 Million Altcoins Are Ruining Crypto’s Future
Animoca Brands Valuation Tanks 75% In Two Years, Here’s Why
Crypto exchange BingX hacked for $43 million
Are The Big Players Losing Interest?
Hong Kong’s Securities Association Tips Authorities On Crypto Self-Regulation
Coinbase cbBTC Set to go Live on Solana
-

 Ethereum21 hours ago
Fundraising platform JustGiving accepts over 60 cryptocurrencies including Bitcoin, Ethereum
-

 Market22 hours ago
Cardano’s Hoskinson Wants Brian Armstrong for US Crypto-Czar
-

 Market18 hours ago
South Korea Unveils North Korea’s Role in Upbit Hack
-
 Altcoin16 hours ago
Sui Network Back Online After 2-Hour Outage, Price Slips
-

 Market21 hours ago
Litecoin (LTC) at a Crossroads: Can It Rebound and Rally?
-
 Altcoin15 hours ago
Dogecoin Whale Accumulation Sparks Optimism, DOGE To Rally 9000% Ahead?
-
 Altcoin20 hours ago
Why FLOKI Price Hits 6-Month Peak With 5% Surge?
-

 Bitcoin13 hours ago
Marathon Digital Raises $1B to Expand Bitcoin Holdings