
Market
Can XRP Price Maintain Momentum? Key Levels to Watch in the Short Term

XRP price is attempting a recovery wave from the $0.4865 support. The price could gain bullish momentum if it clears the $0.5120 resistance.
- XRP remained stable and started a recovery wave above $0.500.
- The price is now trading above $0.5050 and the 100-hourly Simple Moving Average.
- There was a break above a major bearish trend line with resistance at $0.5025 on the hourly chart of the XRP/USD pair (data source from Kraken).
- The pair could start a decent increase if there is a close above the $0.5120 resistance.
XRP Price Reclaims $0.50
After a steady decline, XRP price found support near the $0.4865 zone. A low was formed at $0.4864 and the price is now attempting a recovery wave, like Bitcoin and Ethereum. There was a move above the $0.4950 and $0.50 resistance levels.
Besides, there was a break above a major bearish trend line with resistance at $0.5025 on the hourly chart of the XRP/USD pair. The pair even spiked above $0.5100. A high was formed at $0.5120 and the price is now consolidating gains.
There was a test of the 23.6% Fib retracement level of the upward move from the $0.4867 swing low to the $0.5120 high. The price is now trading above $0.5050 and the 100-hourly Simple Moving Average.
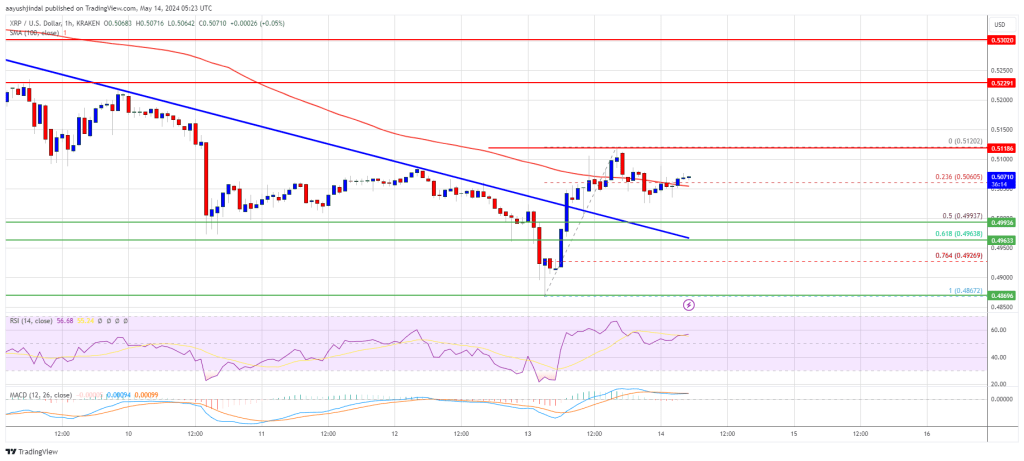
Immediate resistance is near the $0.5085 level. The first key resistance is near $0.5120. A close above the $0.5120 resistance zone could spark a strong increase. The next key resistance is near $0.5220. If the bulls remain in action above the $0.5220 resistance level, there could be a rally toward the $0.5350 resistance. Any more gains might send the price toward the $0.550 resistance.
Another Decline?
If XRP fails to clear the $0.5120 resistance zone, it could start another decline. Initial support on the downside is near the $0.5050 level and the 100-hourly Simple Moving Average.
The next major support is at $0.50 or the 50% Fib retracement level of the upward move from the $0.4867 swing low to the $0.5120 high. If there is a downside break and a close below the $0.50 level, the price might accelerate lower. In the stated case, the price could retest the $0.4865 support zone.
Technical Indicators
Hourly MACD – The MACD for XRP/USD is now gaining pace in the bullish zone.
Hourly RSI (Relative Strength Index) – The RSI for XRP/USD is now above the 50 level.
Major Support Levels – $0.500 and $0.4865.
Major Resistance Levels – $0.5120 and $0.5220.


More than 100,000 users of popular crypto exchanges Binance and Gemini may be at risk after a trove of sensitive information appeared for sale on the dark web.
The leaked data reportedly includes full names, email addresses, phone numbers, and location details—raising alarms over growing cyber threats in the crypto sector.
Dark Web Actors Are Targeting Crypto Users
On March 27, a dark web user operating under the alias AKM69 listed a large database allegedly tied to Gemini, one of the largest crypto trading platforms in the US.
According to Dark Web Informer, the dataset mainly includes information about users from the United States, with a few entries from Singapore and the United Kingdom. The attacker claims the data could be used for marketing, fraud, or crypto recovery scams.
“The database for sale reportedly includes 100,000 records, each containing full names, emails, phone numbers, and location data of individuals from the United States and a few entries from Singapore and the UK,” the report stated.
It is unclear whether the leak resulted from a direct breach of Gemini’s systems or from other vulnerabilities, such as compromised user accounts or phishing campaigns.
Meanwhile, this incident followed another alarming listing on March 26.
According to the report, a separate dark web actor, kiki88888, allegedly offered a trove of Binance user data for sale. The database is said to hold over 132,000 entries, including the exchange users’ login information.

The Dark Web Informer suggests phishing attacks likely caused the breach rather than a compromise of the exchange’s systems.
“Some of you really need to stop clicking random stuff,” the Informer stated.
Binance and Gemini have yet to publicly comment on these incidents. However, phishing remains one of the most effective methods cybercriminals use to exploit crypto holders.
Scammers often impersonate official accounts or place misleading ads that redirect users to fake websites. Coinbase users are also being extensively targeted through phishing campaigns.
As BeInCrypto reported earlier, in March, Coinbase users lost over $46 million to social engineering scams.
Blockchain security firm Scam Sniffer revealed that phishing-related losses exceeded $15 million in the first two months of the year. This figure highlights the growing scale of the threat.
Given the rising threats, crypto users should stay vigilant and avoid unfamiliar links. They should also protect their accounts with two-factor authentication and hardware wallets whenever possible.
Disclaimer
In adherence to the Trust Project guidelines, BeInCrypto is committed to unbiased, transparent reporting. This news article aims to provide accurate, timely information. However, readers are advised to verify facts independently and consult with a professional before making any decisions based on this content. Please note that our Terms and Conditions, Privacy Policy, and Disclaimers have been updated.

Representative Jordan Pace introduced legislation to create a Bitcoin Reserve for South Carolina, joining a nationwide effort. Currently, nearly half of all US states have an active bill to create a similar Reserve.
However, the talking point that this bill “allows 10% of state funds” in Bitcoin investments is taking off like wildfire. It may scare off fiscal conservatives, which contributed to recent failures.
South Carolina Joins the Bitcoin Reserve Race
Since President Trump announced his intention to create a US Bitcoin Reserve, many state governments have attempted to create smaller models.
In the last month, these efforts have been intensifying, with more and more states joining the effort. Today, South Carolina filed its own Bitcoin Reserve bill, allowing the state to make substantial purchases:
“The State Treasurer may invest in digital assets including, but not limited to, Bitcoin with money that is unexpended, unencumbered, or uncommitted. The amount of money that the State Treasurer may invest in digital assets from a fund specified in this section may not exceed ten precent of the total funds under management,” it reads.
State Representative Jordan Pace proposed South Carolina’s Bitcoin Reserve legislation. He claimed that this bill “gives the Treasurer new tools to protect taxpayer dollars from inflation,” one of crypto’s most well-known use cases. Pace is currently the bill’s only sponsor, and it’s unclear what chances it has of passing.
Still, there may be challenges ahead. Similar proposals in other Republican-led states—like Montana and Wyoming—have already failed. This was largely due to concerns over using public funds to buy cryptocurrency.
Even though Trump backs the idea on a national level, not all GOP lawmakers are convinced at the state level.
That said, there are some signs of progress elsewhere. For example, Texas has advanced its Bitcoin Reserve bill, achieving bipartisan support. A key reason for its success is that the bill doesn’t require the state to make crypto purchases; it simply allows them at the Treasurer’s discretion.
Likewise, South Carolina’s bill wouldn’t force the state to invest 10% of its funds into Bitcoin. It just opens the door for that possibility, giving the state financial flexibility rather than a mandate.
Disclaimer
In adherence to the Trust Project guidelines, BeInCrypto is committed to unbiased, transparent reporting. This news article aims to provide accurate, timely information. However, readers are advised to verify facts independently and consult with a professional before making any decisions based on this content. Please note that our Terms and Conditions, Privacy Policy, and Disclaimers have been updated.


The FDIC and CFTC have both been working to change previous crypto guidelines. As federal regulators reconcile with the industry, they are removing old rules that specifically target crypto.
The former institution is removing the requirement that banks report crypto business, while the latter holds crypto to the same standards as other industries.
FDIC and CFTC Change Crypto Policies
The FDIC is one of the top financial regulators in the US, and it’s turning over a new leaf. After being one of the principal architects of Operation Choke Point 2.0, it recently began declassifying documents and changing rules that allowed crypto debanking.
Today, the agency is revoking a 2022 directive that impacted banks’ interactions with crypto:
“With today’s action, the FDIC is turning the page on the flawed approach of the past three years. I expect this to be one of several steps the FDIC will take to lay out a new approach for how banks can engage in crypto- and blockchain-related activities in accordance with safety and soundness standards,” said FDIC Acting Chairman Travis Hill.
Specifically, it rescinded a rule that mandated that all banks and institutions under its supervision notify the FDIC of any crypto involvement. The new guideline claims that banks “may engage in permissible crypto-related activities without receiving prior FDIC approval” without enacting any other policies.
Since Gary Gensler left the SEC, all the top US financial regulators have been trying to rework their relationship with crypto. In an apparent coincidence, the CFTC made a very similar move to the FDIC by rescinding two crypto guidelines.
Both of these actions did not establish a new policy; they merely removed the old ones.
Essentially, both of the CFTC’s rule changes are set to ensure that crypto-related derivatives are subject to the same requirements as non-crypto ones. This is somewhat surprising, considering that the industry has typically tried to insist that it necessitates specific regulations.
However, this is largely beside the point. The FDIC and CFTC are both working to remove previous guidelines that opposed the crypto industry.
These institutions will undoubtedly be amenable to creating new ones in the spirit of cooperation. In the meantime, this olive branch can help build a lot of goodwill.
Disclaimer
In adherence to the Trust Project guidelines, BeInCrypto is committed to unbiased, transparent reporting. This news article aims to provide accurate, timely information. However, readers are advised to verify facts independently and consult with a professional before making any decisions based on this content. Please note that our Terms and Conditions, Privacy Policy, and Disclaimers have been updated.

Dark Web Criminals Are Selling Binance and Gemini User Data

Bitcoin Price Could Surge To $95,000 — But Analyst Sounds ‘Bull Trap’ Alarm

Ethereum Breakdown, Analyst Eyes $1,130–$1,200 Price Target
Did XRP Price Just Hit $21K? Live TV Display Error Goes Viral

El Salvador’s Nayib Bukele Open to White House Visit

South Carolina Could Spend 10% of Funds on Bitcoin Reserve

2.52 Million Altcoins Are Ruining Crypto’s Future

Animoca Brands Valuation Tanks 75% In Two Years, Here’s Why

Crypto exchange BingX hacked for $43 million

Are The Big Players Losing Interest?

Hong Kong’s Securities Association Tips Authorities On Crypto Self-Regulation

Coinbase cbBTC Set to go Live on Solana
2.52 Million Altcoins Are Ruining Crypto’s Future
Animoca Brands Valuation Tanks 75% In Two Years, Here’s Why
Crypto exchange BingX hacked for $43 million
Are The Big Players Losing Interest?
Hong Kong’s Securities Association Tips Authorities On Crypto Self-Regulation
Coinbase cbBTC Set to go Live on Solana
-

 Altcoin22 hours ago
Dogecoin Price Set To Reach $1 As Once In A Year Buy Opportunity Returns
-
 Regulation22 hours ago
AVAX Price Eyes Rally To $44 As Grayscale Files For Avalanche ETF
-
 Regulation17 hours ago
US SEC Drops Charges Against Hawk Tuah Girl Hailey Welch
-

 Market23 hours ago
Hedera Falls 4% as Bears Dominate: What’s Next for HBAR?
-

 Regulation19 hours ago
FDIC Revises Crypto Guidelines Allowing Banks To Enter Digital Assets
-
 Altcoin23 hours ago
Why the US SEC Is Delaying the Ripple Case?
-

 Ethereum23 hours ago
Ethereum Fails To Break $2,100 Resistance – Growing Downside Risk?
-
 Regulation18 hours ago
Sonic Labs To Abandon Plans For Algorithmic USD Stablecoin, Here’s Why