
Market
Can BONK Break out of This Consolidation?

BONK’s price has been facing minimal support from the market and investors even when other altcoins are charting rallies.
The meme coin stuck in consolidation has reached a point where it would need a massive push to break out.
BONK Investors Losing Hope
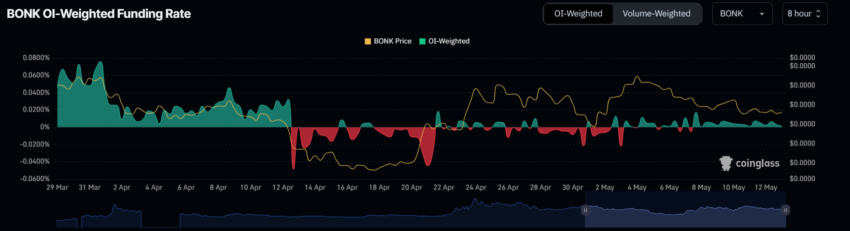
BONK’s price largely follows the broader market cues, and the lack of optimism there, combined with investors’ skepticism, is becoming a problem for BONK holders. The latter is evident in the funding rate of the asset.
The funding rate is a mechanism used in perpetual futures contracts to balance the market between long and short positions. It showcases which direction the traders are leaning in. Positive values suggest the dominance of long contracts, while negative hints at short contracts taking precedence.
In the case of BONK’s case, despite being positive, the funding rate is nearly at zero after recovering from negative last week. This means that the investors are not betting on a price rise as strongly as expected, likely owing to the lack of bullishness in the market.
This can be noted in the Average Directional Index (ADX), which has declined since mid-April. This indicator is used to identify the strength of a trend, whether it’s bullish or bearish.
As BONK’s price rallied on April 20, the ADX began dipping despite exceeding 25.0. This is the threshold for strength, and the indicator above 25.0 indicates that the trend is gaining strength.
Read More: Bonk Airdrop Eligibility: Who Can Claim and How?
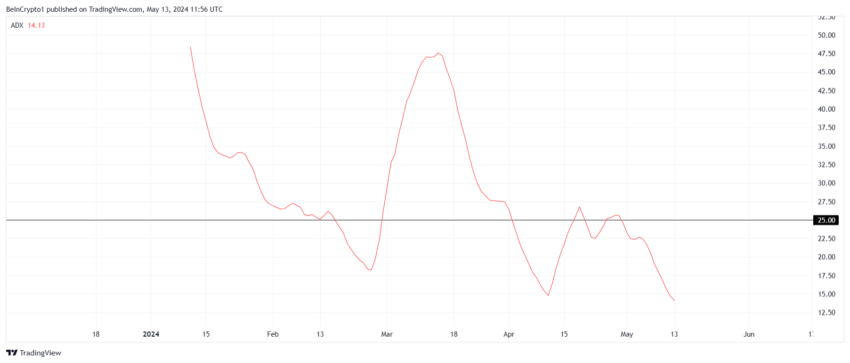
Thus, a decline during the rally is evidence that BONK did not have support from the market to complete a break out of the consolidation, and this may remain the case.
BONK Price Prediction: Look Down
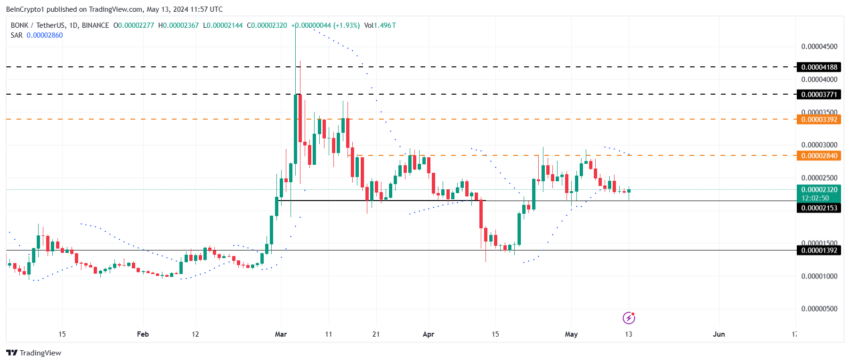
BONK’s price trading at $0.00002320 is above the support of $0.00002153 after failing to breach the resistance at $0.00002840. These price points have been the limits of the consolidation for almost a month now.
While the meme coin failed attempts at breaching it, it successfully broke down below the support. Despite the recovery, BONK is closer to repeating a decline than breaking out of the consolidation.
Read More: 11 Best Solana Meme Coins to Watch in 2024
Thus, BONK holders should expect the same going forward.
However, a break out above $0.00002840 would invalidate the bearish-neutral thesis, potentially resulting in a rally of $0.00003000 and beyond.
Disclaimer
In line with the Trust Project guidelines, this price analysis article is for informational purposes only and should not be considered financial or investment advice. BeInCrypto is committed to accurate, unbiased reporting, but market conditions are subject to change without notice. Always conduct your own research and consult with a professional before making any financial decisions. Please note that our Terms and Conditions, Privacy Policy, and Disclaimers have been updated.


Solana (SOL) has experienced significant volatility recently, with a marked decline following its failure to breach the $150 mark.
Over the last few days, Solana has struggled to break through certain resistance levels that have been affected by broader market trends. However, investor optimism appears to be driving recent price movements as SOL nears $120.
Solana Gains Support
One of the indicators showing promise for Solana’s recovery is its velocity, which measures the pace at which tokens are being circulated. The velocity has reached a monthly high, signaling that the transaction of supply is accelerating.
Amidst recovering price, there’s a noticeable increase in the velocity at which tokens are being transacted, highlighting greater demand. Velocity and price tend to move in tandem. Typically, when both price and velocity rise together, it’s considered a bullish signal — a trend currently seen with Solana.

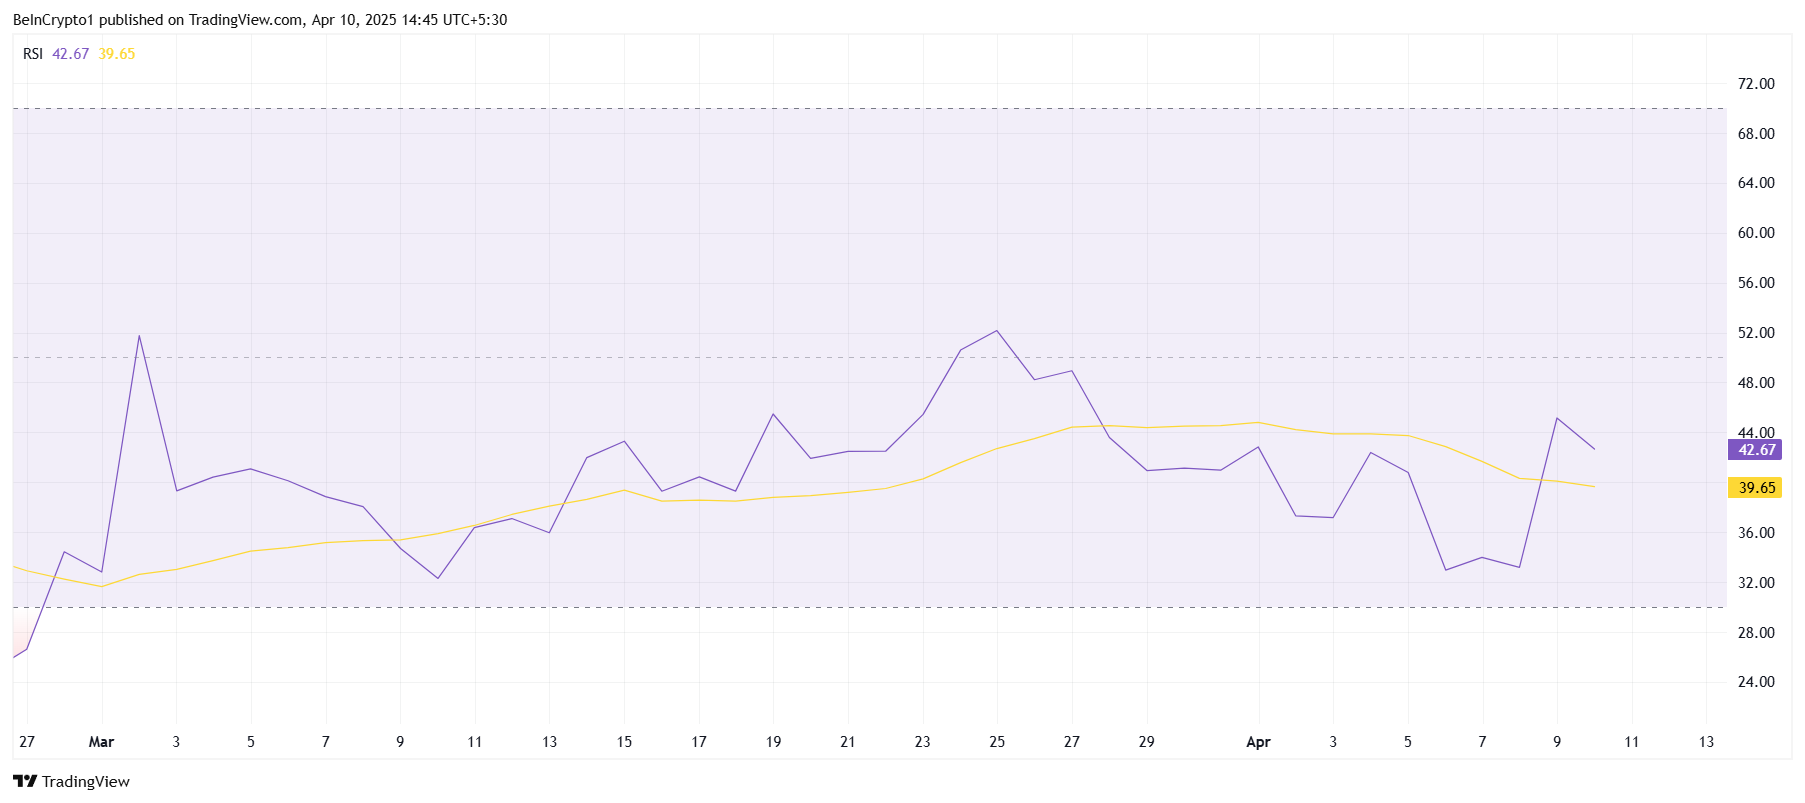
However, despite the favorable signs from the velocity, Solana’s macro momentum remains relatively weak. The Relative Strength Index (RSI) is still stuck in the bearish zone, under the neutral 50.0 mark.
While the broader market has seen some rallies, Solana’s RSI indicates a lack of significant buying momentum. This suggests that while some positive movement is occurring, broader macroeconomic factors may still be playing a limiting role.
The persistent bearish sentiment reflected in the RSI implies that Solana’s recovery may face continued challenges. Despite occasional price bounces, the altcoin has not yet experienced enough momentum to break free from the bearish pressure.
SOL Price Attempts Recovery
Solana’s price has risen by 8.2% in the past 24 hours, trading at $114. While it is showing signs of recovery, the altcoin remains under the key psychological price of $120. Beyond it lies a crucial resistance of $123, which has proven challenging in recent days.
If the bullish momentum continues, Solana could rise past $120 and aim for $123. Securing it as support would likely lead to further gains, pushing Solana toward the $135 mark. Investor confidence and continued supply distribution could support this upward movement.
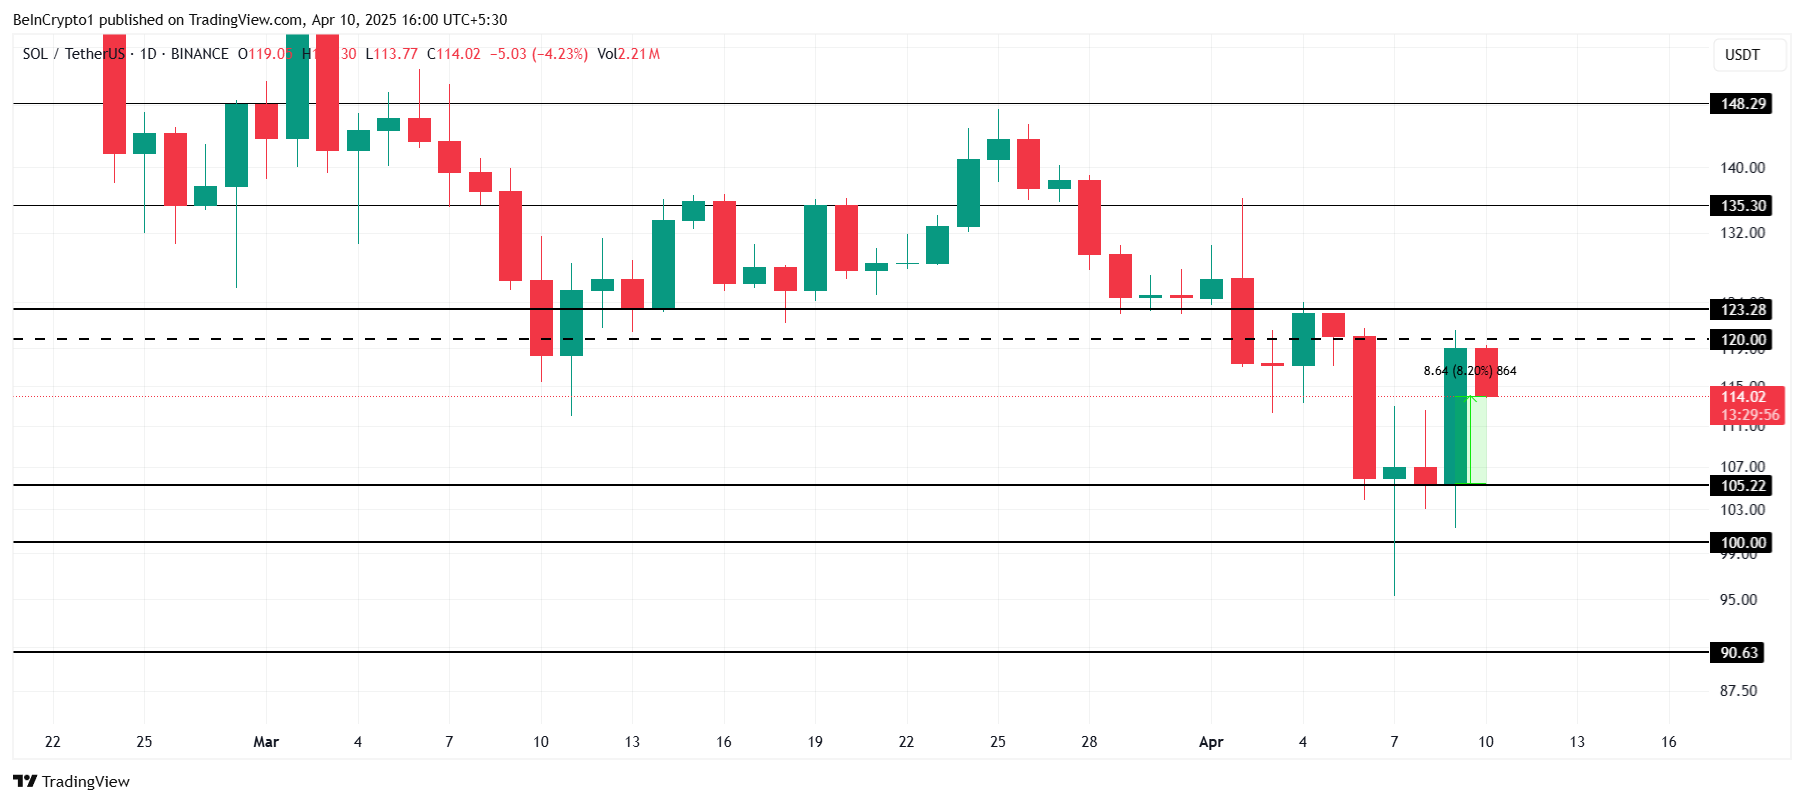
However, if Solana fails to breach the $123 resistance, the price may retreat toward $105 or even lower. A drop below $105 could signal a deeper decline, with the altcoin potentially heading toward the $100 mark. This would invalidate the recent bullish outlook, extending the correction phase for Solana.
Disclaimer
In line with the Trust Project guidelines, this price analysis article is for informational purposes only and should not be considered financial or investment advice. BeInCrypto is committed to accurate, unbiased reporting, but market conditions are subject to change without notice. Always conduct your own research and consult with a professional before making any financial decisions. Please note that our Terms and Conditions, Privacy Policy, and Disclaimers have been updated.

Aayush Jindal, a luminary in the world of financial markets, whose expertise spans over 15 illustrious years in the realms of Forex and cryptocurrency trading. Renowned for his unparalleled proficiency in providing technical analysis, Aayush is a trusted advisor and senior market expert to investors worldwide, guiding them through the intricate landscapes of modern finance with his keen insights and astute chart analysis.
From a young age, Aayush exhibited a natural aptitude for deciphering complex systems and unraveling patterns. Fueled by an insatiable curiosity for understanding market dynamics, he embarked on a journey that would lead him to become one of the foremost authorities in the fields of Forex and crypto trading. With a meticulous eye for detail and an unwavering commitment to excellence, Aayush honed his craft over the years, mastering the art of technical analysis and chart interpretation.
As a software engineer, Aayush harnesses the power of technology to optimize trading strategies and develop innovative solutions for navigating the volatile waters of financial markets. His background in software engineering has equipped him with a unique skill set, enabling him to leverage cutting-edge tools and algorithms to gain a competitive edge in an ever-evolving landscape.
In addition to his roles in finance and technology, Aayush serves as the director of a prestigious IT company, where he spearheads initiatives aimed at driving digital innovation and transformation. Under his visionary leadership, the company has flourished, cementing its position as a leader in the tech industry and paving the way for groundbreaking advancements in software development and IT solutions.
Despite his demanding professional commitments, Aayush is a firm believer in the importance of work-life balance. An avid traveler and adventurer, he finds solace in exploring new destinations, immersing himself in different cultures, and forging lasting memories along the way. Whether he’s trekking through the Himalayas, diving in the azure waters of the Maldives, or experiencing the vibrant energy of bustling metropolises, Aayush embraces every opportunity to broaden his horizons and create unforgettable experiences.
Aayush’s journey to success is marked by a relentless pursuit of excellence and a steadfast commitment to continuous learning and growth. His academic achievements are a testament to his dedication and passion for excellence, having completed his software engineering with honors and excelling in every department.
At his core, Aayush is driven by a profound passion for analyzing markets and uncovering profitable opportunities amidst volatility. Whether he’s poring over price charts, identifying key support and resistance levels, or providing insightful analysis to his clients and followers, Aayush’s unwavering dedication to his craft sets him apart as a true industry leader and a beacon of inspiration to aspiring traders around the globe.
In a world where uncertainty reigns supreme, Aayush Jindal stands as a guiding light, illuminating the path to financial success with his unparalleled expertise, unwavering integrity, and boundless enthusiasm for the markets.

Onyxcoin has surged by nearly 30% in the past 24 hours, riding the wave of a broader crypto market rally.
But beyond the market-wide momentum, on-chain data suggests that XCN’s spike, its strongest in over a month, is driven by genuine demand for the altcoin.
Onyxcoin Rallies, But There Is a Catch
XCN’s double-digit rally has been accompanied by a surge in its daily trading volume. This totals $128 million at press time, rocketing 480% over the past day.
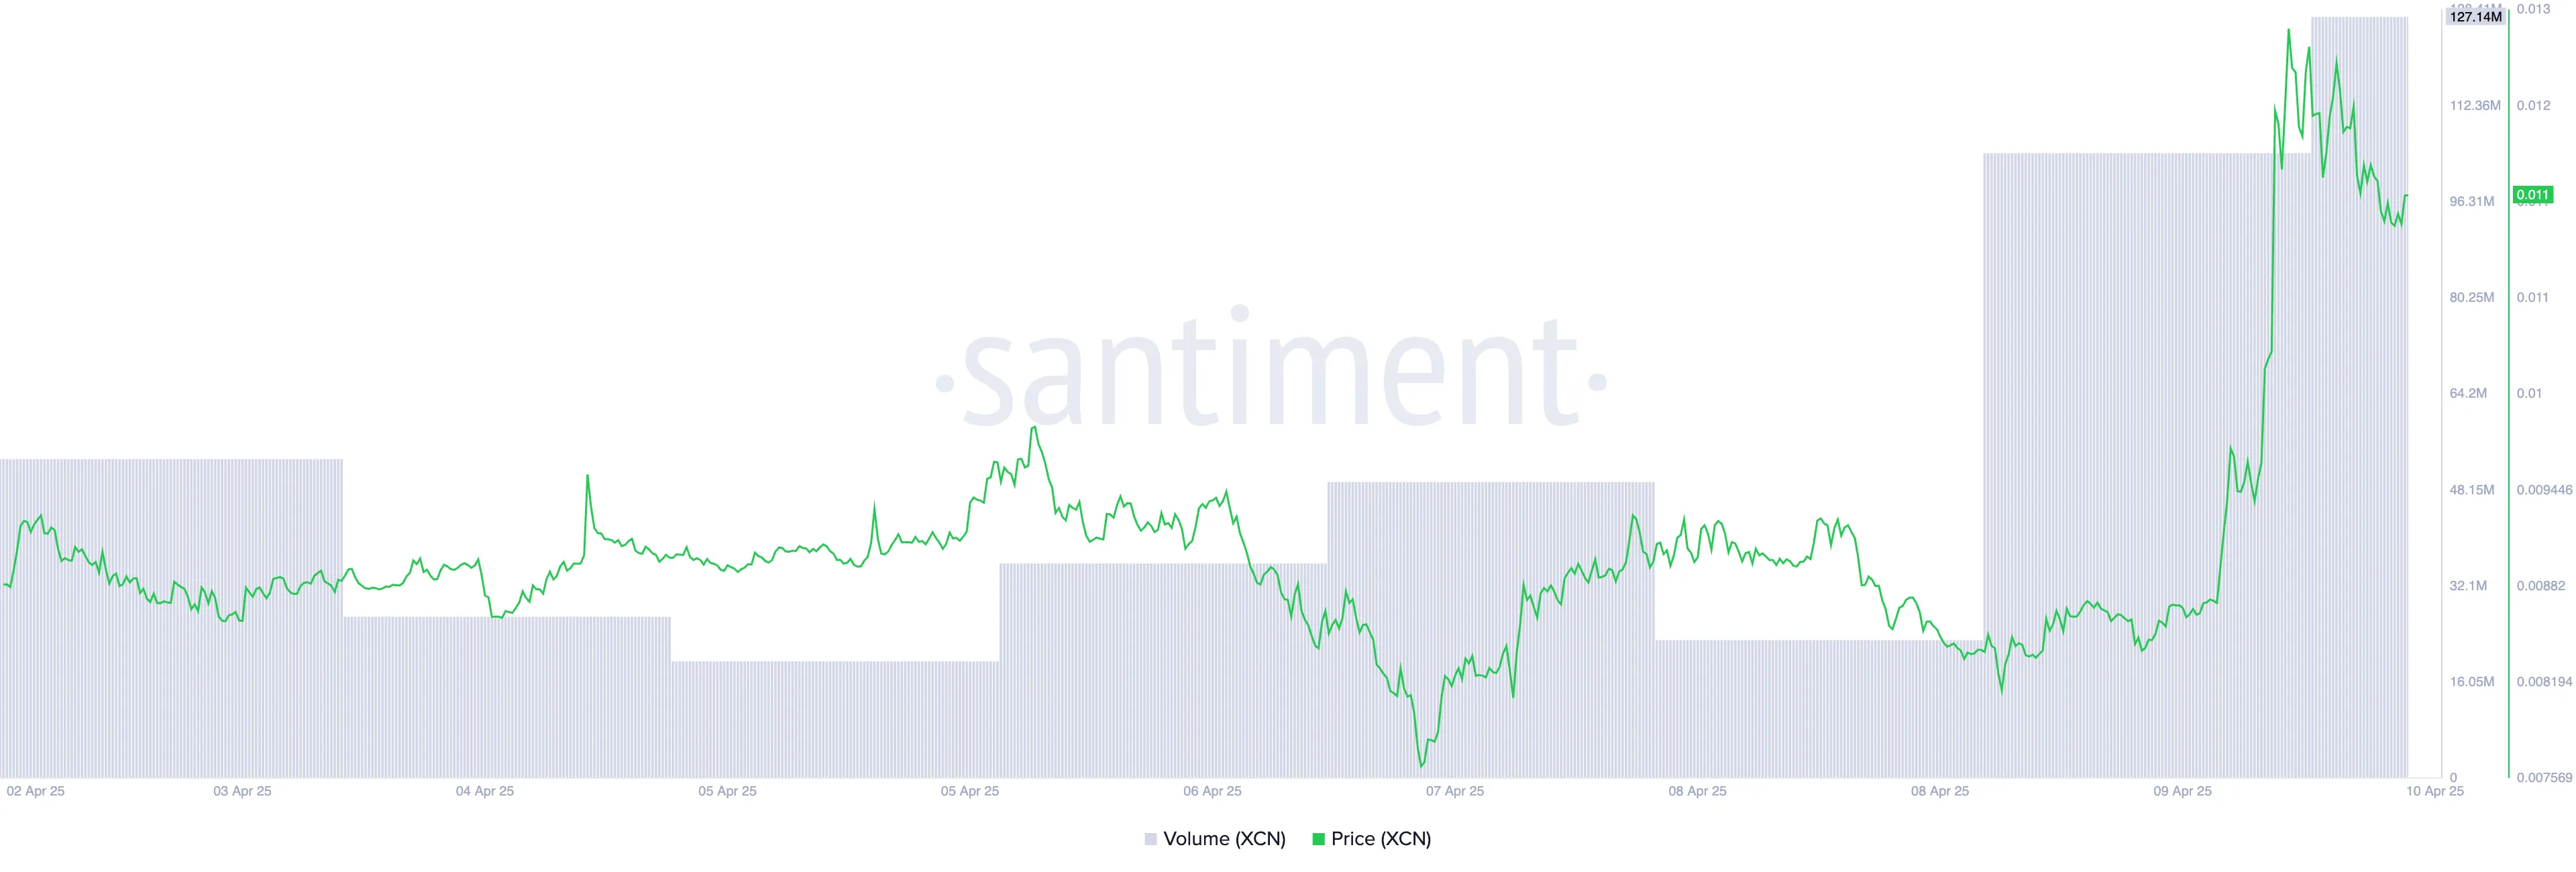
When an asset’s price and trading volume spike simultaneously, it signals strong market interest and momentum. This means more participants are actively trading XCN and validating its price movement.
Moreover, the daily count of active addresses that have traded XCN today has climbed to a 60-day high of 1,646.
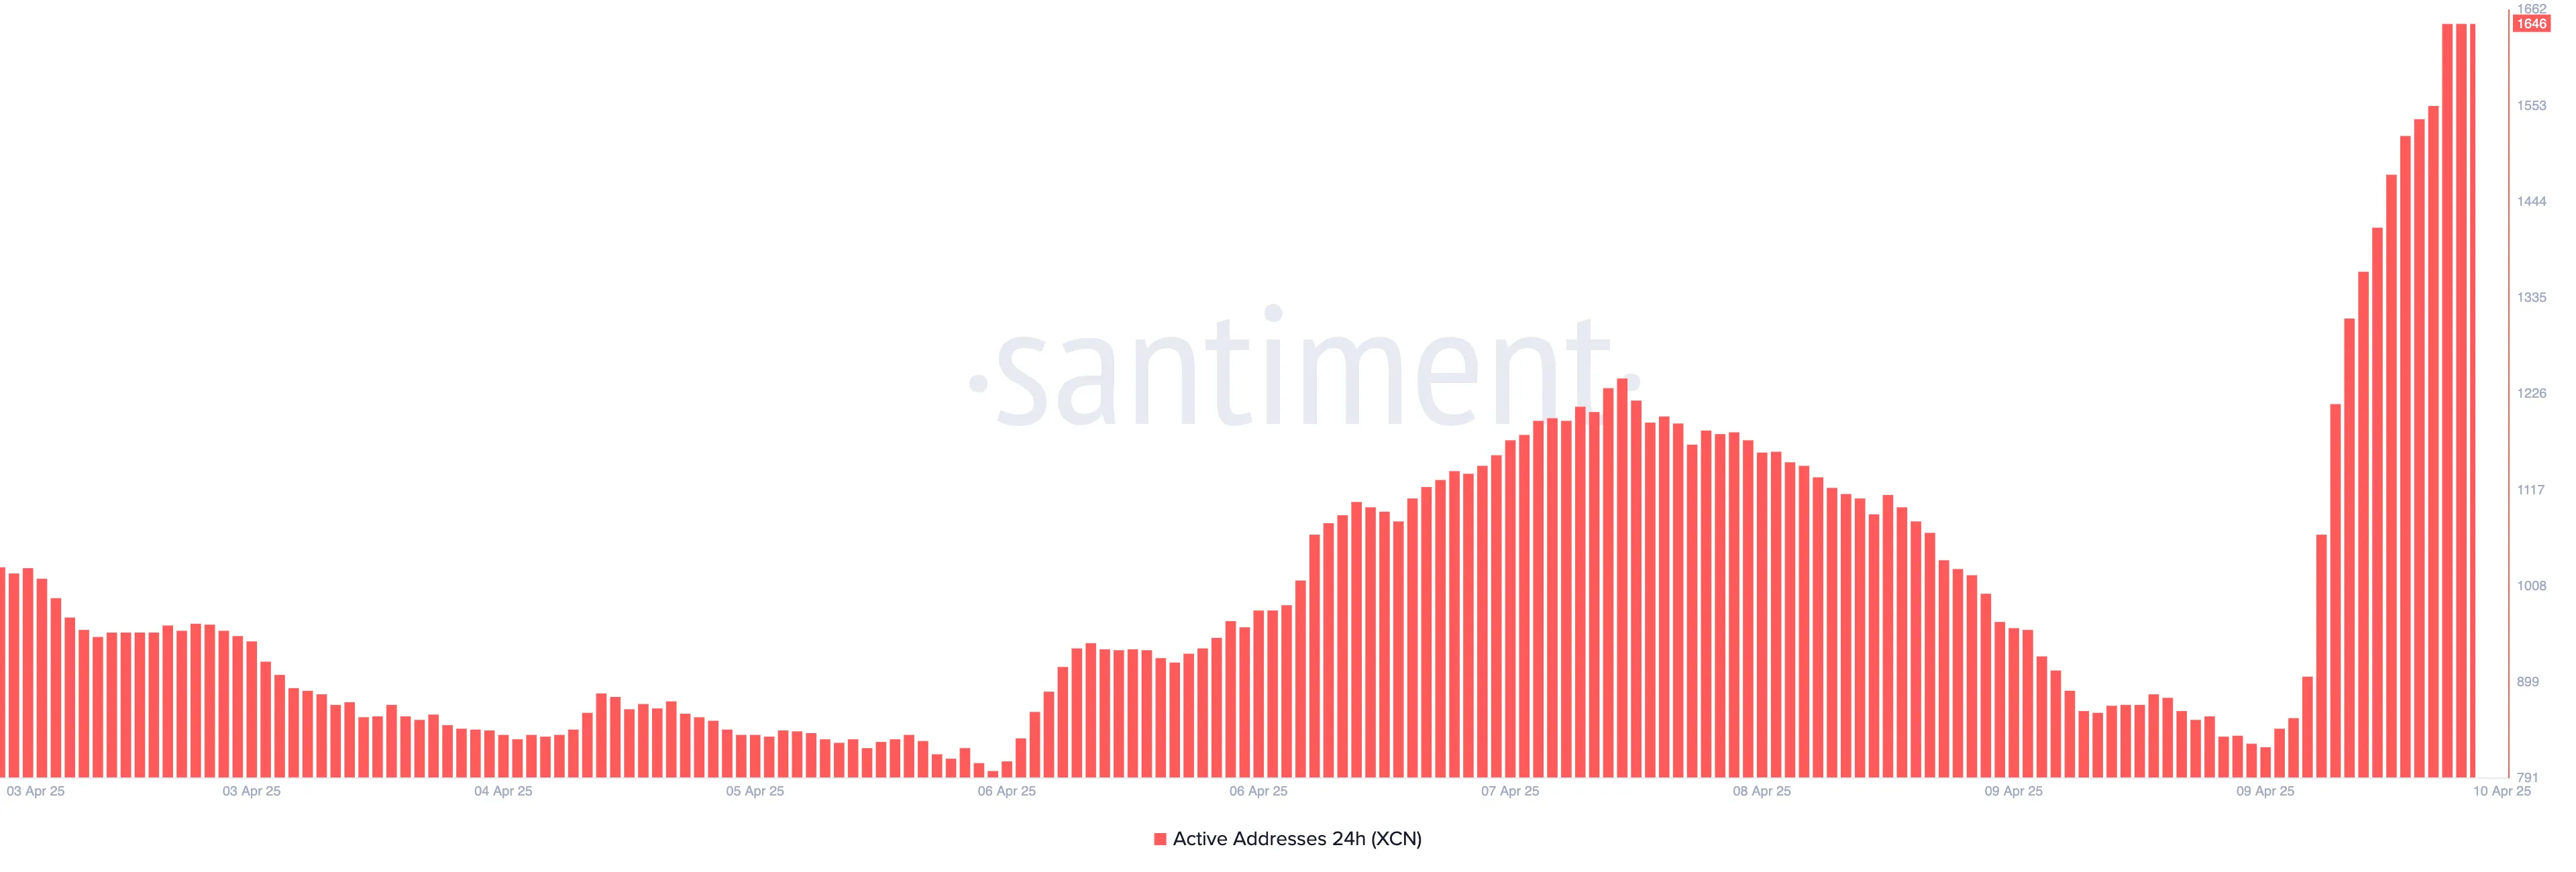
This spike in active addresses reflects growing retail and possibly institutional interest in XCN. More wallets transacting the token typically suggests broader network participation and confidence, which can serve as a strong bullish signal for the asset.
However, not all traders share this bullish sentiment. In the XCN futures market, the outlook is persistently bearish, as reflected by the token’s negative funding rate. This is at a two-month low of -0.18% at press time.
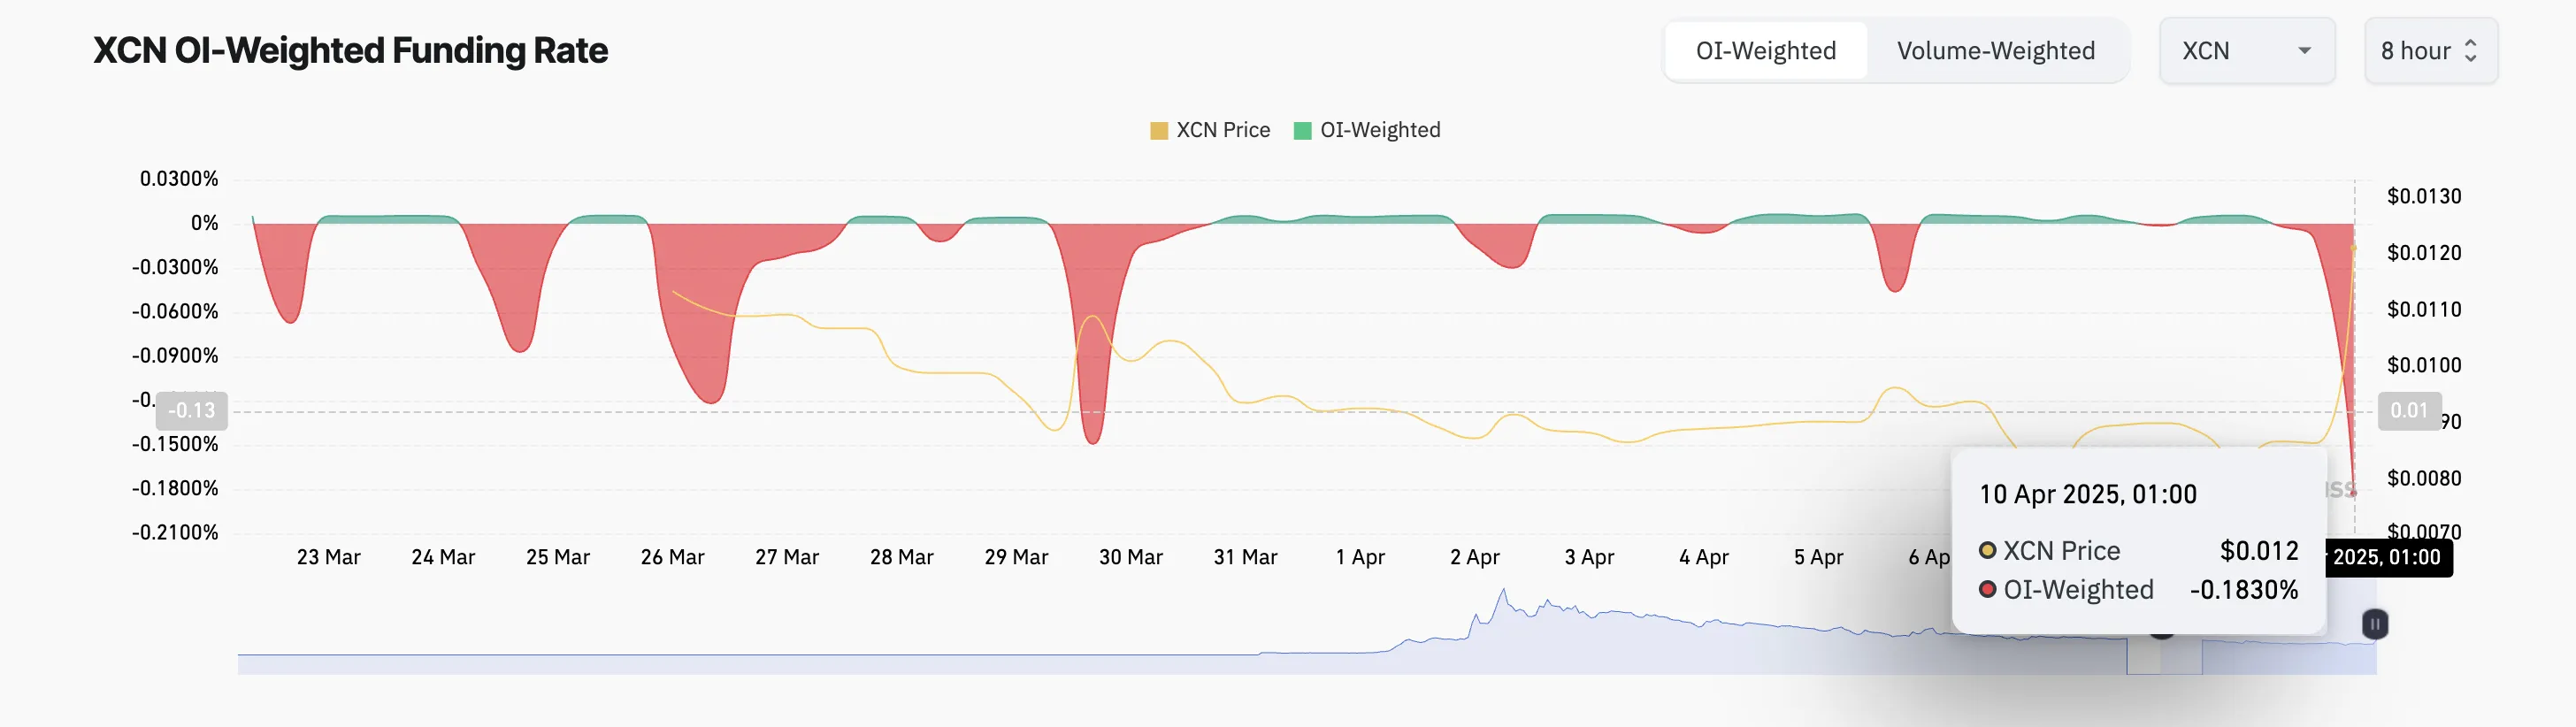
The funding rate is a periodic fee exchanged between long and short traders in perpetual futures to keep the contract price in line with the spot price.
When an asset’s funding rate is negative like this, short traders pay long traders. This indicates bearish sentiment and that more XCN traders are betting on the price to fall.
XCN Clears Key Barrier as Accumulation Grows — Is $0.015 Next?
Apart from the broader market recovery, the price rally is also supported by a visible uptick in on-chain user engagement, signaling that XCN traders are not just following hype but are actively accumulating.
On the daily chart, XCN has broken above the crucial $0.01 resistance level—a price point it struggled to break for two weeks. If the rally persists, XCN’s price could climb to $0.015, a high it last reached on March 5.
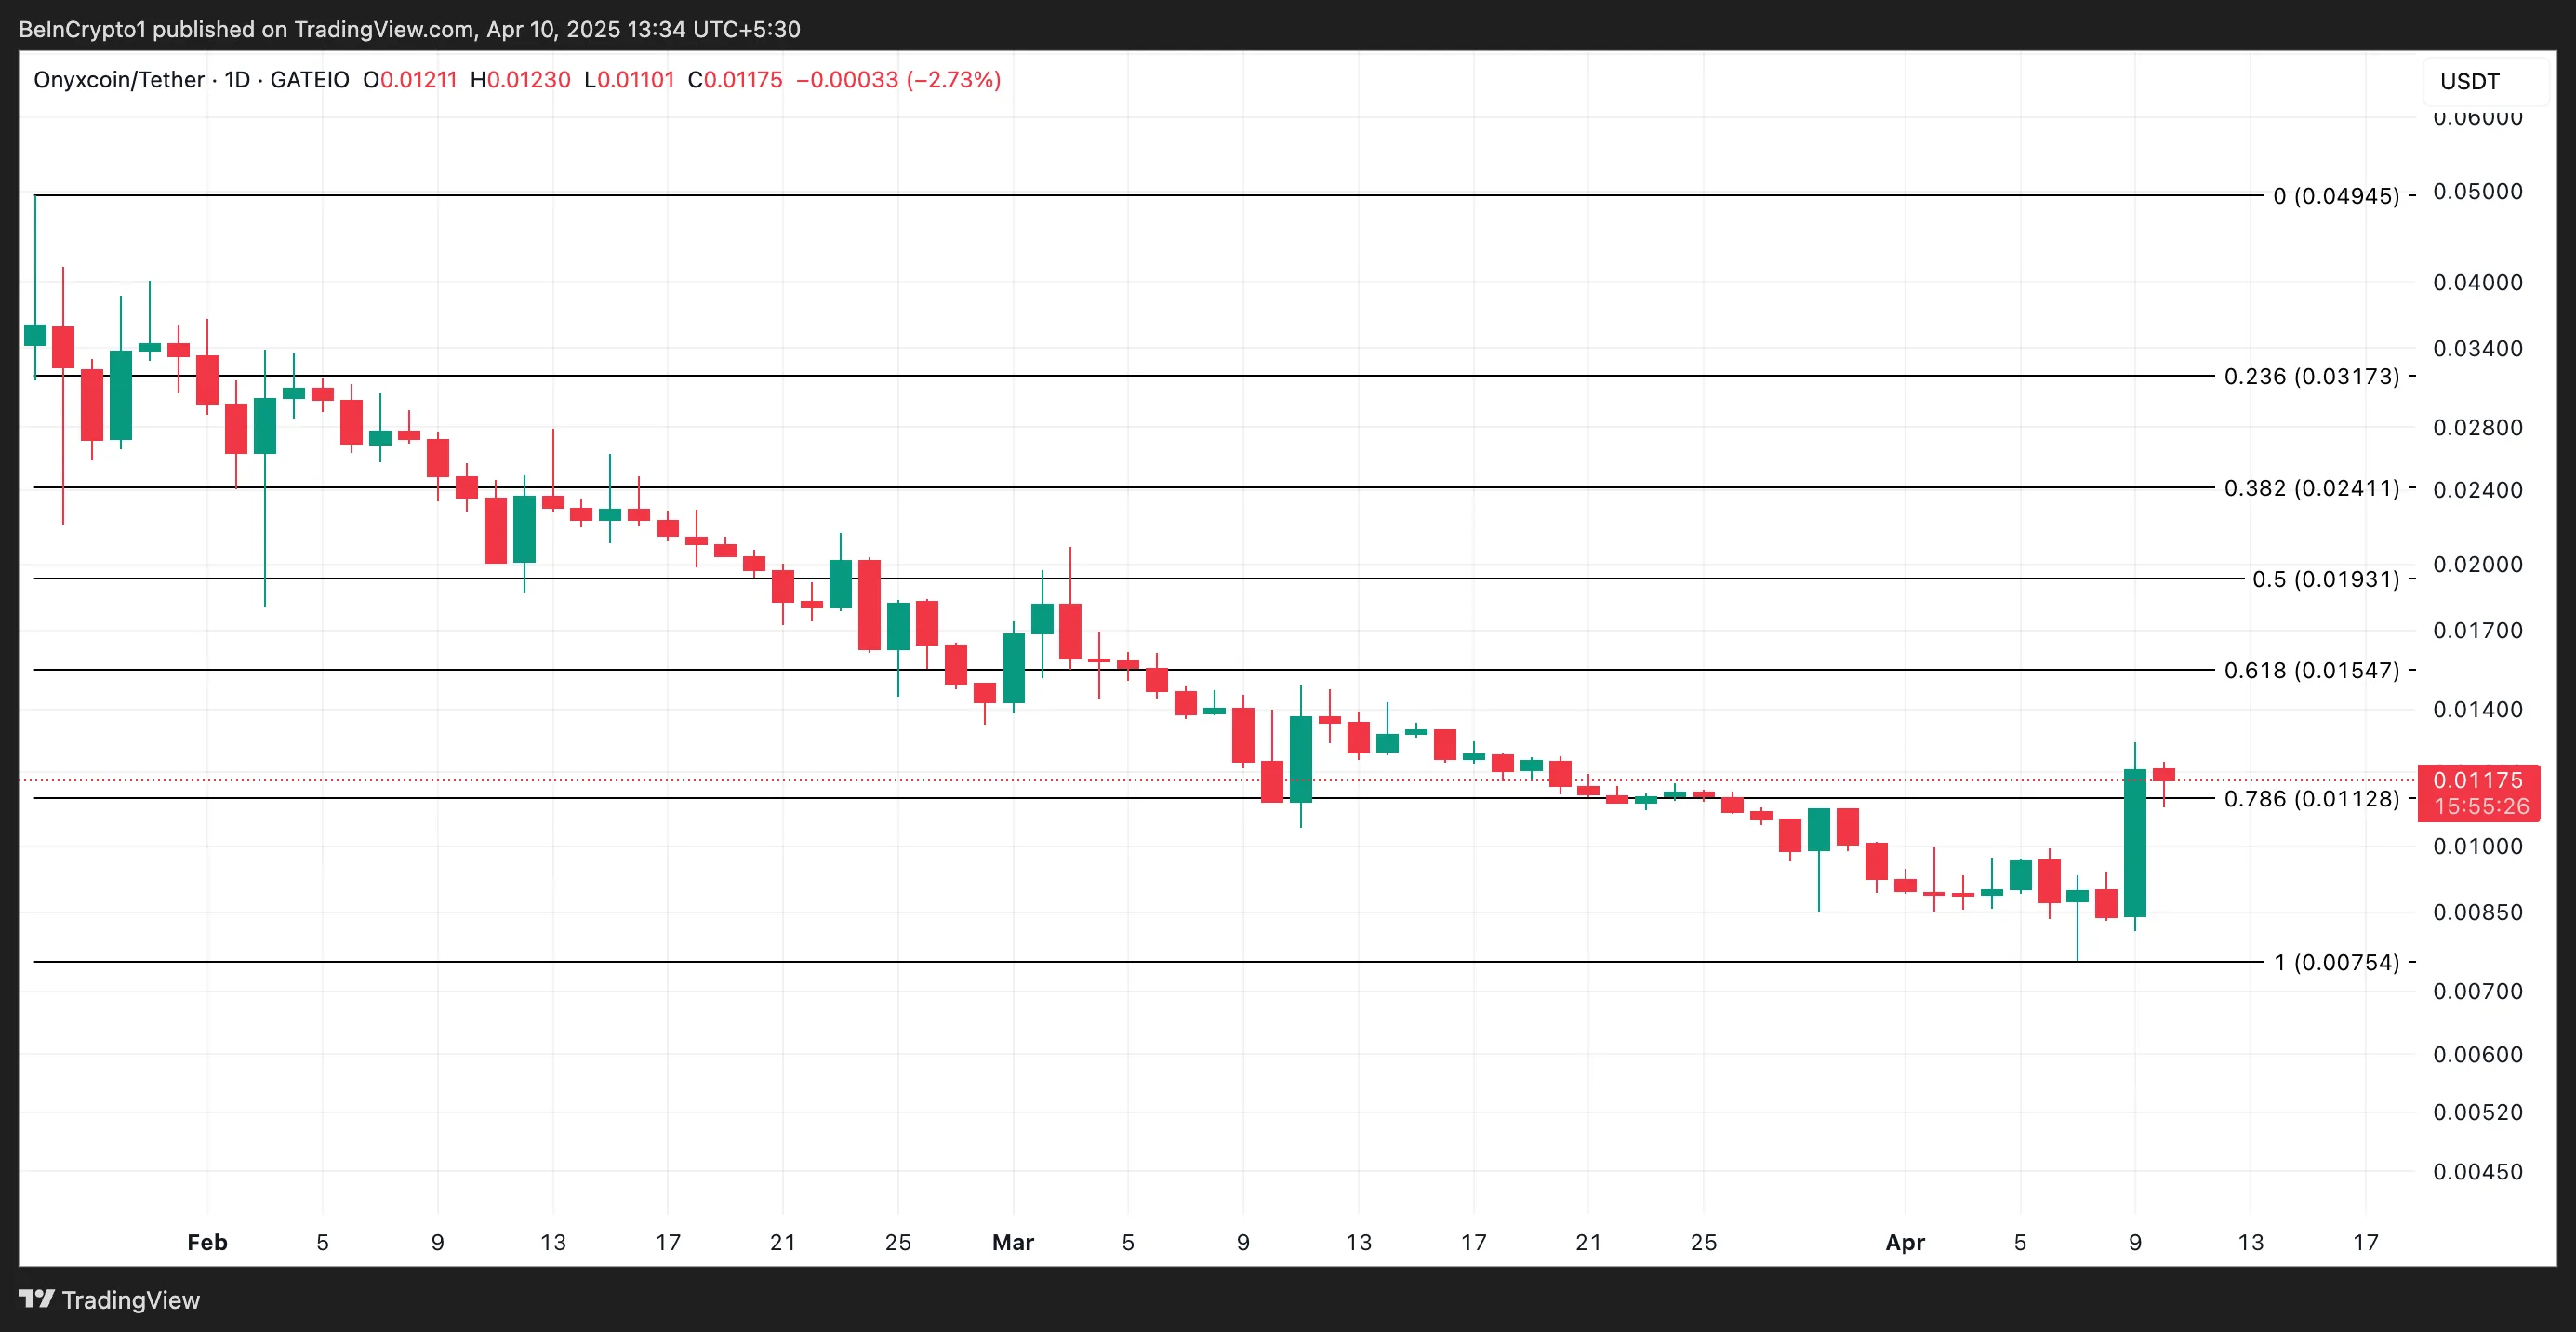
However, if market participants begin profit-taking, XCN could shed its recent gains and fall below the $0.011 support toward $0.0075.
Disclaimer
In line with the Trust Project guidelines, this price analysis article is for informational purposes only and should not be considered financial or investment advice. BeInCrypto is committed to accurate, unbiased reporting, but market conditions are subject to change without notice. Always conduct your own research and consult with a professional before making any financial decisions. Please note that our Terms and Conditions, Privacy Policy, and Disclaimers have been updated.

Ethereum’s Controversial Developer Freed Before Full Sentence

Solana Price Attempts Recovery, Nears $120, But Needs A Push

XRP Price Eyes $2.0 Breakout—Can It Hold and Ignite a Bullish Surge?

Ethereum Long-Term Holders Show Signs Of Capitulation – Prime Accumulation Zone?

Binance Lists BABY As Bitcoin Protocol Babylon Goes Live
Onyxcoin Buyers Drive Strong Demand as XCN Surges Past $0.01


-

 Altcoin20 hours ago
NFT Drama Ends For Shaquille O’Neal With Hefty $11 Million Settlement
-
 Altcoin19 hours ago
Is Dogecoin Price Levels About To Bounce Back?
-
 Bitcoin16 hours ago
MicroStrategy Bitcoin Dump Rumors Circulate After SEC Filing
-
 Market16 hours ago
XRP Primed for a Comeback as Key Technical Signal Hints at Explosive Move
-

 Market14 hours ago
Solana (SOL) Drops 4% as Selling Pressure Intensifies
-
 Market19 hours ago
Web3 Projects Adjust to Market Chaos
-
 Altcoin14 hours ago
Argentina Opens LIBRA Investigation, Top Officials May Be Implicated
-

 Market18 hours ago
FBI Ran Dark Web Money Laundering to Track Crypto Criminals
 Arabic
 Chinese (Simplified)
 Dutch
Dutch English
 French
 German
 Italian
 Portuguese
 Russian
 Spanish
 Vietnamese