
Market
How to Start Trading on dYdX Chain: A Beginners Guide
Trading platforms offer a variety of options for users, but few specialize in decentralized perpetual futures. dYdX stands out in this niche, providing users with an innovative platform for perpetual trading, characterized with high transaction speed, low fees and numerous possibilities for DYDX token holders. It is also perfectly suitable for newbie traders, simplifying the DeFi experience and making the transition from centralized exchanges seamless.
The recent developments in dYdX’s offerings make it an ideal choice for those looking to explore decentralized finance (DeFi) with ease. This guide is designed to help beginners navigate dYdX and its features, providing the essential steps needed to start trading.
What is dYdX?
dYdX is a decentralized perpetual exchange. Launched in 2018, it has established itself as a leader in decentralized perpetual trading through its combination of cutting-edge technology and affordability. The platform’s growth is supported by prominent venture capital firms and investors, including Andreessen Horowitz, Paradigm, and Polychain, among others.
In 2023, dYdX announced its migration from the Ethereum blockchain to the Cosmos ecosystem with the dYdX Chain. This transition marked a significant milestone for the platform, allowing for increased scalability, full decentralization, distribution of 100% of protocol fees to Stakers and higher throughput. The migration also enabled dYdX to implement a fully decentralized order book system and matching engine providing more control and precision for traders.
dYdX Chain is fully decentralized, so users can easily onboard using a variety of wallets or socials thanks to the Privy integration and aren’t required to complete Know Your Customer (KYC) checks. All you need is a funded crypto wallet or social account and you can start trading in a matter of minutes.
dYdX has established itself as a leading platform for perpetual trading of crypto assets. The platform’s average daily transaction volume consistently exceeds $1 billion, reaffirming its position as a significant player in the trading landscape. It has outpaced many decentralized trading platforms and competes with prominent centralized exchanges, demonstrating dYdX’s growing influence in the market.
How to Trade on dYdX?
Step 1: Getting Started
Before you begin trading on dYdX Chain, you need a compatible cryptocurrency wallet, e-mail or socials (X or Discord). Here’s how to set up a wallet:
- Choose a Wallet: Popular options include MetaMask, Trust Wallet, and Ledger. Make sure your chosen wallet is compatible with dYdX on the dydx.trade interface. A hardware wallet like Ledger offers added security by keeping your private keys offline.
You can also set up a new wallet using Privy and log in using your existing email or social accounts. It doesn’t require memorizing a seedphrase — just choose a preferred log in method and click Authorize.
- Install and Configure: Download and install the wallet app or browser extension, and set up your account by following the prompts. Make sure to securely store your recovery seed phrase. Never share this phrase with anyone, as it gives full access to your wallet.
- Fund Your Wallet: Transfer some cryptocurrency, such as USDC, into your wallet. This is necessary for trading on dYdX Chain. Depending on your chosen wallet, you may need to purchase cryptocurrency from an exchange or transfer it from another wallet.
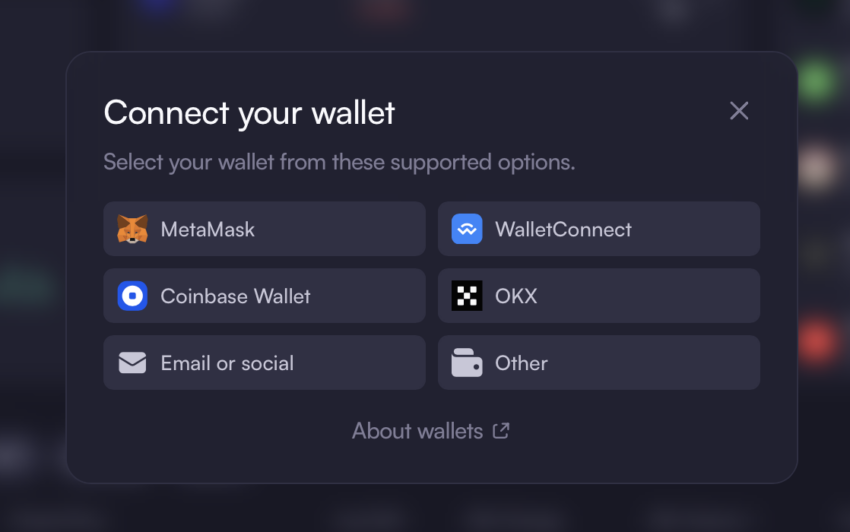
Step 2: Connect to dYdX
With your wallet ready and funded, it’s time to connect to dYdX Chain:
- Visit dydx.trade — the front end user interface for dYdX Chain.
- Connect Your Wallet or socials: Click the “Connect Wallet” button and select your wallet type. Follow the prompts to complete the connection. Ensure your wallet extension or app is open and ready for interaction.
- Authorize: You’ll be asked to authorize transactions through your wallet interface. Make sure to review the details before confirming. This step ensures you understand and approve the connections and transactions taking place.
dYdX Chain is available for iOS: the same dYdX Chain trading experience you know and love — now directly in your pocket!
Download dYdX for iOS here.
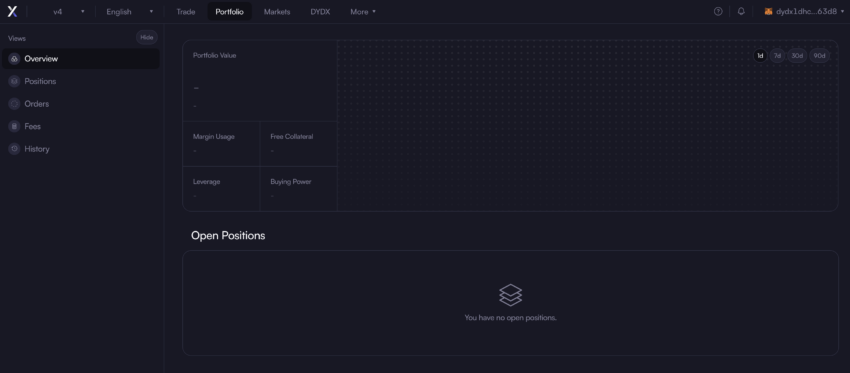
Step 3: Explore the Platform
Once connected, you can explore dYdX Chain’s interface:
- Dashboard: The dashboard provides an overview of your account, including balances, open positions, and trade history. This section also offers shortcuts to key functionalities, making it easier to manage your portfolio.
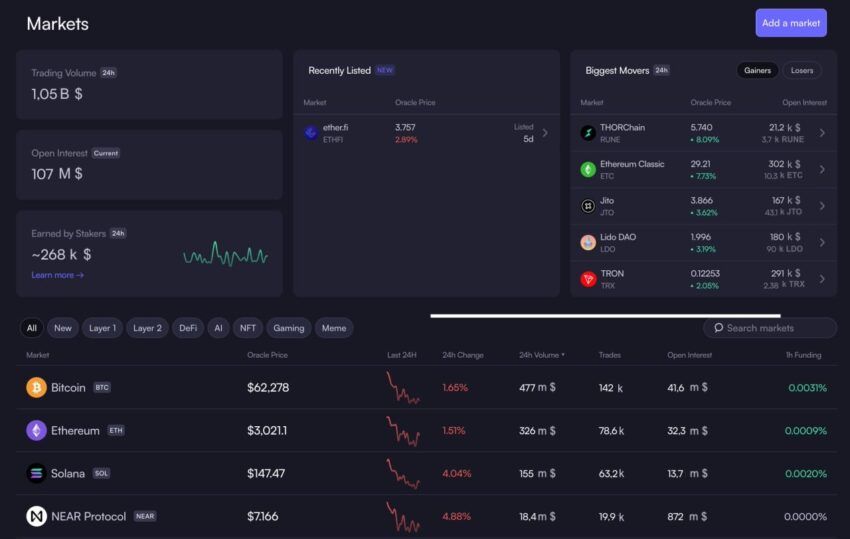
- Markets: Navigate to the Markets section to view available trading pairs, recently listed markets, 24h USDC distribution, biggest movers, current prices and 24h trading volumes. You can also view price trends, helping you make informed decisions.
- Order Book: dYdX Chain’s orderbook and matching engine is fully decentralized and purpose built for the optimal trading experience. It shows active buy and sell orders, giving you insights into market trends. This information can guide your trading strategy, especially when placing limit orders.
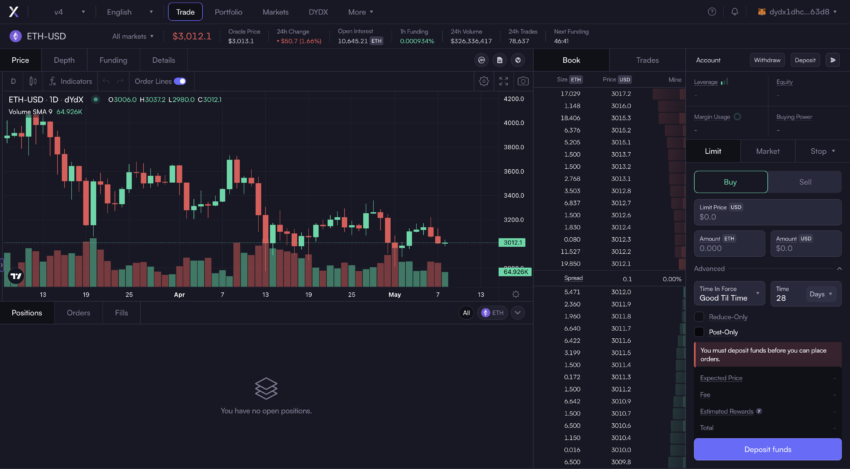
Step 4: Start Trading
Now that you’re familiar with the interface, you’re ready to place trades:
- Select a Market: Choose a trading pair from the Markets section. dYdX Chain offers over 63+ pairs, allowing you to diversify your portfolio or focus on specific assets. You can switch between the selected market and all available pairs using the All Markets button in the top left menu.
- Order Type: Decide on an order type, such as a market order (instant execution at current prices) or limit order (executed at a specified price). Limit orders are useful for specifying exact entry or exit points for your trades. For a detailed overview you can view this comparison table.
- Enter Trade Details: Specify the amount and price for your trade. Double-check these details before finalizing to avoid mistakes.
- Set The Leverage: Deciding what leverage to use is a crucial aspect of perpetual trading. Leverage refers to the funds borrowed from the platform to amplify a trade, acting as a multiplier on gains or losses. dYdX Chain offers up to 20x leverage trading. The liquidation price is calculated automatically before you enter the trade, helping effectively manage the risk.
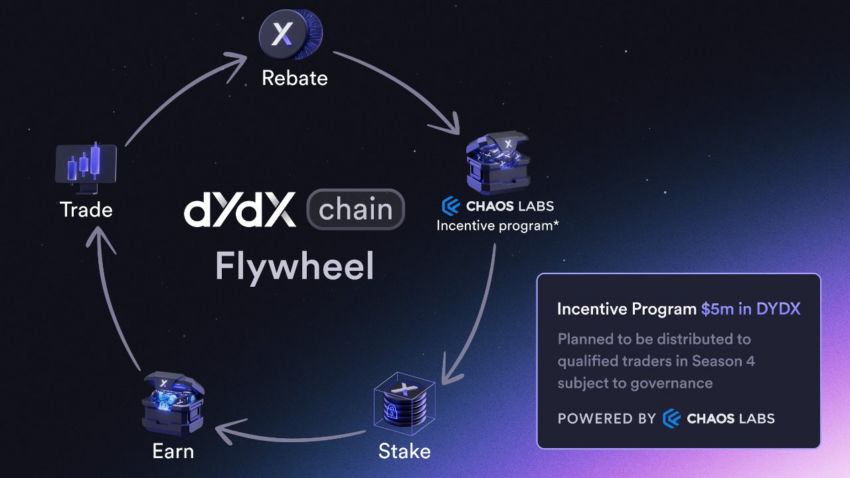
- Understand dYdX Trading Fees: Fees vary based on the type of trade and your trading volume in the last 30 days. Fee is between 0,025% and 0,05% for taker orders. Generally, the fees are lower than that on centralized exchanges. Up to 90% of your trading fees are distributed instantly back into your dYdX Chain address. Additionally there is an incentive program currently live that subject to governance will distributed 5M USD in DYDX to eligible traders.
- Review and Confirm: Double-check all details before executing your trade.
- Manage Your Positions: Monitor open positions from the dashboard and manage them by closing or modifying as needed. Keeping track of your positions helps you adapt to market changes and protect your investments.
Step 5: Get The Most Of dYdX Trading Rewards and Launch Incentives
Trading rewards incentivize users to trade on the protocol. dYdX rewards users for every successful trade based on the amount of fees paid. The system automatically distributes trading rewards directly to the trader’s account per block. Prior to each trade, the UI will also show the expected amount of rewards a trade of that size will receive.
The dYdX Chain also runs a Launch Incentives Program, tailored to expand and transition the current dYdX user base to the new protocol. The governance proposal set aside $20M of DYDX from dYdX Chain Community Treasury to be distributed as rewards for trading and market making activity. You can find an extensive blog post describing the program details here.
Step 6: Stay Informed
Trading on dYdX Chain requires staying updated:
- Community: Join the dYdX community on social media or participate in forums to stay informed about updates and opportunities. Engaging with the community can also provide valuable insights and support.
- Learning Resources: Explore educational materials provided by dYdX Academy and other DeFi resources to enhance your trading skills. Continuous learning can help you refine your strategies and navigate the platform more effectively.
- Security: Always keep security in mind, enabling two-factor authentication (2FA) and avoiding sharing sensitive information. Regularly review your security settings to protect your assets.
Although perpetual trading is inherently risky and not recommended for beginners, dYdX Chain offers an excellent starting point for those interested in trading perpetual futures. The platform boasts high liquidity, support for a wide range of assets, and low fees due to its advanced technology. These features make dYdX Chain a serious competitor to prominent centralized exchanges.
Disclaimer
In adherence to the Trust Project guidelines, BeInCrypto is committed to unbiased, transparent reporting. This news article aims to provide accurate, timely information. However, readers are advised to verify facts independently and consult with a professional before making any decisions based on this content. Please note that our Terms and Conditions, Privacy Policy, and Disclaimers have been updated.


Reason to trust
![]()
Strict editorial policy that focuses on accuracy, relevance, and impartiality
Created by industry experts and meticulously reviewed
The highest standards in reporting and publishing
Strict editorial policy that focuses on accuracy, relevance, and impartiality
Morbi pretium leo et nisl aliquam mollis. Quisque arcu lorem, ultricies quis pellentesque nec, ullamcorper eu odio.
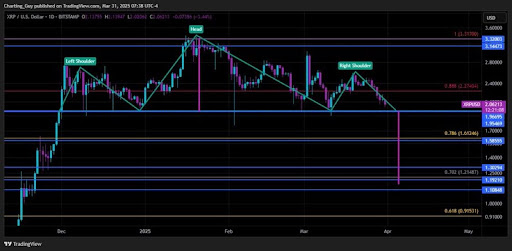
Recent XRP price action has sparked a new prediction from a crypto analyst, as a potential Head and Shoulders pattern emerges on the chart. The analyst warns that this technical formation could trigger a significant price correction for XRP, describing this downturn as the worst-case scenario.
Analyst Predicts XRP Price Crash To $1.15
The ‘Charting Guy,’ a pseudonymous crypto analyst on X (formerly Twitter), has unveiled a potential Head and Shoulder pattern formation on the XRP price chart. The analyst has shared insights into the implications of this technical pattern, projecting a potential crash in the XRP price.
Related Reading
As a well-known bearish reversal pattern, the formation of a Head and Shoulder in the XRP price chart suggests a potential shift from an uptrend to a downtrend. Typically, a Head and Shoulder pattern consists of three peaks: the Left Shoulder, Head, and Right Shoulder. However, the Charting Guy has confirmed that XRP’s current pattern formation consists of two right shoulders and one head. Due to this irregularity, the analyst has expressed doubt about the possibility of the pattern playing out.
If the Head and Shoulder pattern eventually takes shape, it could lead to a significant drop in the XRP price, potentially bringing it down to as low as $1.15. This price level aligns with a key Fibonacci Golden Pocket retracement zone between 0.618 – 0.786.
Notably, the analyst has described this projected price crash as the worst-case scenario for XRP. While he believes a bearish move is possible, the analyst is confident that XRP’s broader market structure is bullish.
Moreover, the Charting Guy argues that if XRP does decline to $1.15, it would likely serve as a healthy retracement in an overall bullish trend. He noted that XRP’s price has been holding the $2 level on daily closes, meaning its price action remains strong above support levels. This also indicates the possibility of an uptrend resumption that could yield higher highs and higher lows for XRP.
Key Support And Resistance Levels To Watch
The Charting Guy’s analysis of XRP’s potential Head and Shoulder pattern formation highlights several critical price levels to watch. Since XRP has consistently closed daily candles above $2, the analyst has determined this level as short-term support.
Related Reading
XRP has also been wicking during recent pullbacks in a crucial range between $1.7 and $1.9. As a result, the crypto analyst has revealed that he will be watching this area closely for a potential price bounce.
The Golden Pocket retracement zone, which represents the worst-case scenario for the XRP price, is between $1.15 and $1.30. If XRP experiences a deeper price correction, lower support levels have been marked from $1.19 to $0.91.
For its resistance levels, the Charting Guy has pinpointed $2.27 as a key price point. Additionally, $3.14 – $3.32 has been identified as an upper resistance range where XRP could rally if bullish momentum resumes.
Featured image from Medium, chart from Tradingview.com


Welcome to the US Morning Crypto Briefing—your essential rundown of the most important developments in crypto for the day ahead.
Grab a coffee to see how Standard Chartered sees early signs of institutional investors turning to Bitcoin as a hedge against equity market volatility, just as traders gear up for a potentially volatile week driven by tariff news. At the same time, Coinbase wraps up its worst quarter since the FTX collapse, and U.S. regulators inch closer to unified stablecoin legislation.
Standard Chartered Sees Signs of Bitcoin Starting to Be Used as Hedge Against Market Volatility
Geoff Kendrick, Head of Digital Assets Research at Standard Chartered, sees signs that institutional traders are starting to use Bitcoin as a hedge against equity market volatility.
In a recent exclusive interview with BeInCrypto, Kendrick highlighted that this trend is already underway, with investors seeking alternatives to traditional instruments. “This is happening already,” Kendrick stated. “Investors used to use FX, specifically AUD, for this purpose due to its highly liquid and positive correlation to stocks, but now I think Bitcoin is being used because it is also highly liquid and trades 24/7.”
Additionally, in an investor note from late March, Kendrick expanded on Bitcoin’s evolving role in investment portfolios, suggesting that over time, Bitcoin may serve multiple purposes—both as a hedge against traditional financial market fluctuations and as a proxy for tech stocks.
He pointed out signs that markets could anticipating a less severe tariff announcement from the U.S. on April 2. “Given this has been the worst quarter for the Nasdaq since Q2 2022, there should be a degree of portfolio rebalancing (buying) that needs to take place,” Kendrick added.
As of April 1, 2025, Bitcoin has shown resilience amid broader market uncertainties. The cryptocurrency is up approximately 3.32%, trading at $84,282. This uptick comes alongside an overall increase in the global cryptocurrency market capitalization. In contrast, U.S. stock futures, including Dow Futures, S&P 500 Futures, and Nasdaq Futures, are all trending lower in pre-market trading, reflecting investor caution ahead of the anticipated tariff announcements.
Bitcoin Options Heat Up Before Trump’s “Liberation Day”
FalconXCrypto Global Co-Head of Markets, Joshua Lim, noted that in anticipation of Wednesday’s Trump-tariff “Liberation Day,” crypto funds are actively purchasing Bitcoin options at two key strike prices: $75,000 on the downside to hedge against potential losses and $90,000 on the upside to capitalize on a price surge.
Lim highlighted that the options market is pricing in a potential 4% move in Bitcoin’s price during the event. “The implied event move embedded in Bitcoin options is around 4% for the 2 April event,” he told BeInCrypto.
He also pointed out that traders are likely to keep buying put options in the short term as a protective measure, maintaining a high options cost premium. “We believe the front of the options curve will hold its premium as traders continue to hedge their portfolios or replace spot positions with limited-loss option positions,” Lim added.
Additionally, he noted a 4-point increase in the VIX, signaling that investors expect heightened volatility in the coming days and are turning to options to manage risk or capitalize on price swings. “US equities are also showing a bid in options, with the front-month VIX up 4 points to 22v from last week,” he said.
Crypto Stocks Slide: Coinbase Suffers Worst Quarter Since FTX Collapse
Coinbase is closing out its roughest quarter since the FTX collapse, with its stock tumbling over 30% since January. While it dipped nearly 1% in early U.S. pre-market trading on Monday, the stock managed to claw back losses and is now up around 1%.
Other crypto-linked companies are also feeling the pressure. Galaxy Digital Holdings has dropped over 8% in pre-market trading, while mining firms Riot Platforms and Core Scientific are only barely staying afloat, each gaining less than 0.5%.
Meanwhile, CoreWeave, which pivoted from Bitcoin mining to AI infrastructure, is struggling after a disappointing IPO. Initially aiming for a $2.7 billion raise, the company had to settle for $1.5 billion, slashing its offer price from the $47–55 range to $40 per share. Since going public last Friday, its shares are down 6.8%, with a 7.3% drop recorded in the last 24 hours.
Byte-Sized Alpha
– Today’s JOLTS report, a key gauge of U.S. job openings, could sway Bitcoin—strong data may boost the dollar and hurt crypto, while a sharp decline could fuel rate-cut hopes and lift risk assets.
– Bitcoin is off to its worst quarterly start since 2018, dropping nearly 12% in Q1 2025—but growing whale accumulation, falling exchange supply, and signs of consolidation hint at a potential rebound ahead.
– Crypto scams are on the rise, with fake Gemini bankruptcy emails and a Coinbase employee breach fueling phishing attacks
– OKX has appointed former NYDFS Superintendent Linda Lacewell as Chief Legal Officer, a move aimed at bolstering its regulatory credibility as the exchange accelerates global expansion into regions like Europe and the UAE.
– A unified U.S. stablecoin regulation could soon become reality, as the STABLE and GENIUS Acts differ by only 20% and enjoy strong bipartisan support alongside SEC and CFTC involvement.
– A push for expanded crypto oversight is underway as incoming CFTC Chair Brian Quintenz meets with Senator Chuck Grassley to discuss regulating the crypto spot market.
Disclaimer
In line with the Trust Project guidelines, this price analysis article is for informational purposes only and should not be considered financial or investment advice. BeInCrypto is committed to accurate, unbiased reporting, but market conditions are subject to change without notice. Always conduct your own research and consult with a professional before making any financial decisions. Please note that our Terms and Conditions, Privacy Policy, and Disclaimers have been updated.

SUI enters a critical phase today as a $147 million token unlock threatens to inject selling pressure into a market already testing key resistance levels. Despite a sharp rebound in momentum—evident in the RSI’s surge from oversold territory—SUI failed to break above the crucial 60 mark, signaling buyer hesitation.
The Ichimoku Cloud shows price action pressing against the cloud’s edge, but lacking the conviction needed for a clear breakout. With a possible golden cross forming on the EMA lines, bulls still have a chance—if they can overcome resistance at $2.50 and avoid being dragged down by post-unlock volatility.
SUI RSI Surged Since Yesterday But Failed To Break Above 60
SUI’s Relative Strength Index (RSI) has jumped sharply to 58.94, up from 29.38 just a day ago, reflecting a strong shift in short-term momentum.
The RSI is a momentum oscillator that measures the speed and magnitude of recent price changes. It typically ranges from 0 to 100. Readings below 30 suggest an asset may be oversold, while levels above 70 indicate it may be overbought.
The rapid rise in SUI’s RSI suggests buyers have stepped in aggressively after a period of heavy selling.
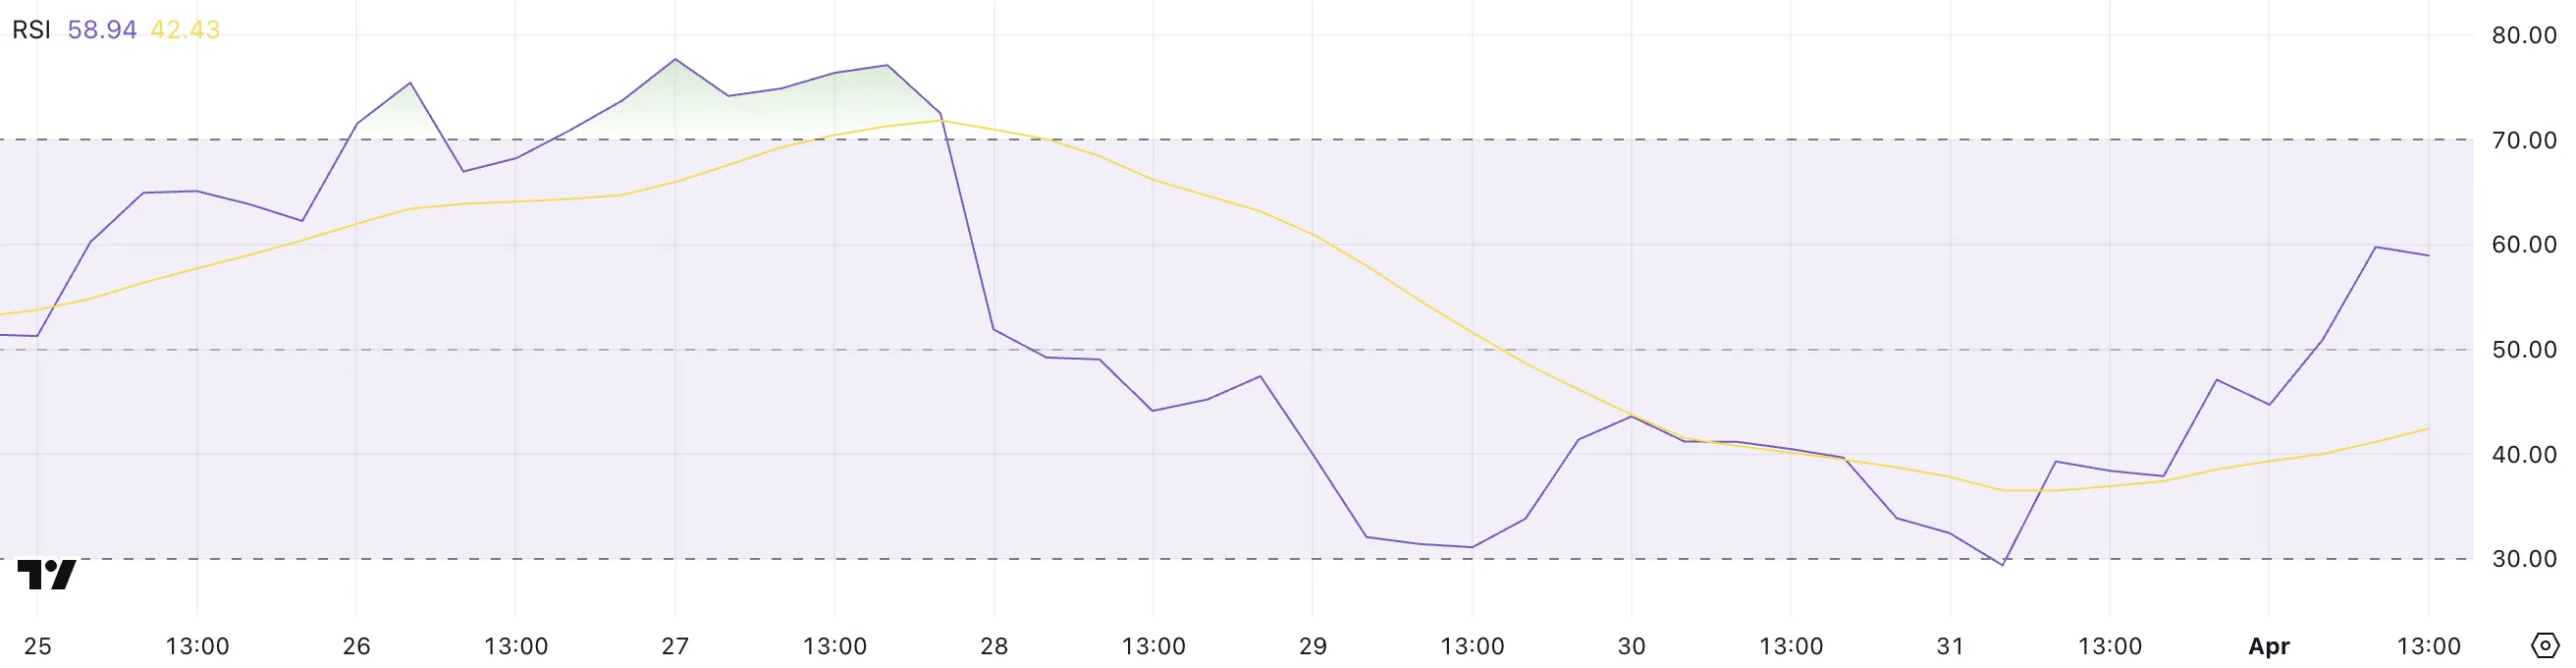
However, despite the impressive rebound, SUI’s RSI briefly approached but failed to break above the 60 threshold earlier today.
This level often acts as a short-term resistance during recovery phases, and the rejection may indicate lingering hesitation among buyers or profit-taking after the surge.
While the RSI nearing 60 is encouraging, a decisive move above it would be needed to confirm a breakout. For now, SUI appears to be in a recovery mode. However, the inability to push past 60 highlights that bulls are not fully in control just yet.
Ichimoku Cloud Shows Lack Of Strong Upward Momentum
SUI blockchain Ichimoku Cloud chart shows a potential breakout attempt, as the price has surged upward and is now hovering right at the edge of the Kumo (cloud).
This movement suggests bullish momentum is trying to build. However, the resistance provided by the thick, red cloud ahead could make it difficult for SUI to sustain the uptrend without stronger confirmation.
The Tenkan-sen (blue line) is starting to rise and has crossed above the Kijun-sen (red line), which is a bullish signal. However, the price still needs to clearly break and hold above the cloud to flip the overall trend from bearish to bullish.
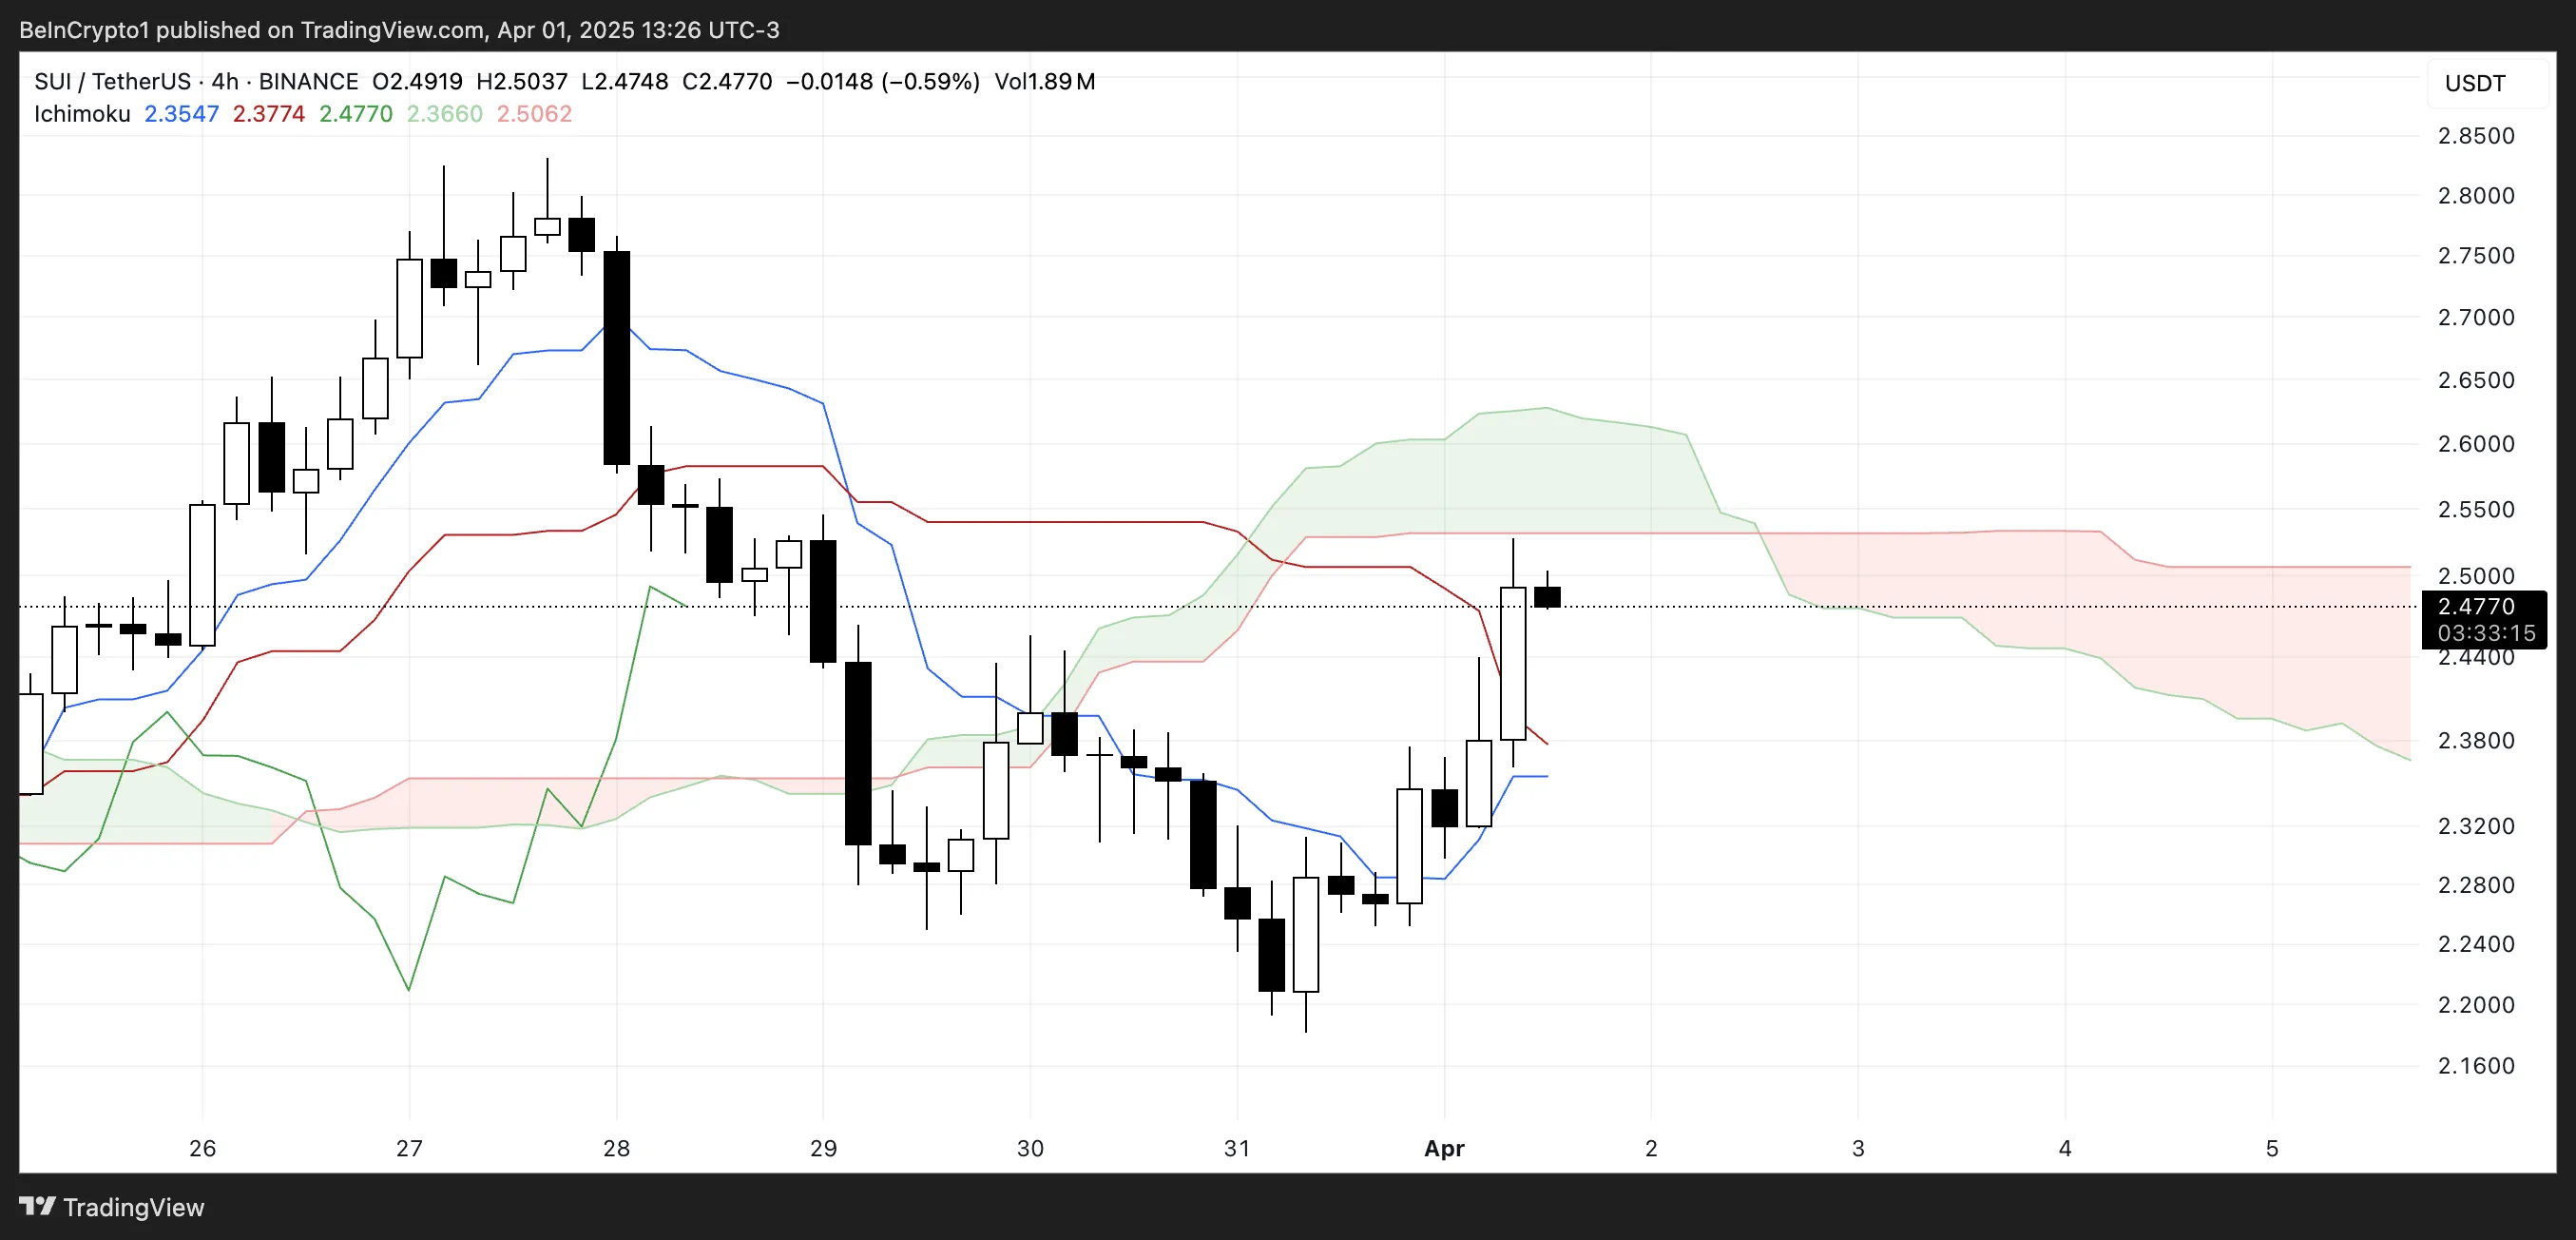
For now, the cloud remains bearish and flat, indicating possible resistance and a lack of strong upward conviction.
The current position suggests that SUI is at a key decision point—either break through the cloud to initiate a trend reversal or get rejected and slip back into the previous downtrend range.
If buyers can sustain the pressure and push the price above the upper cloud boundary, it could trigger a stronger rally. But without increased volume and broader market support, the price risks getting stuck in consolidation or turning back downward.
Will SUI Rise Back To $2.80?
SUI’s EMA lines are tightening and showing signs of a potential golden cross. That happens when a short-term moving average crosses above a longer-term one—a classic bullish signal that often precedes upward momentum.
However, the price is currently grappling with a key resistance near the $2.50 level.
If bulls manage to break through this level, it could open the path for a move toward $2.83.
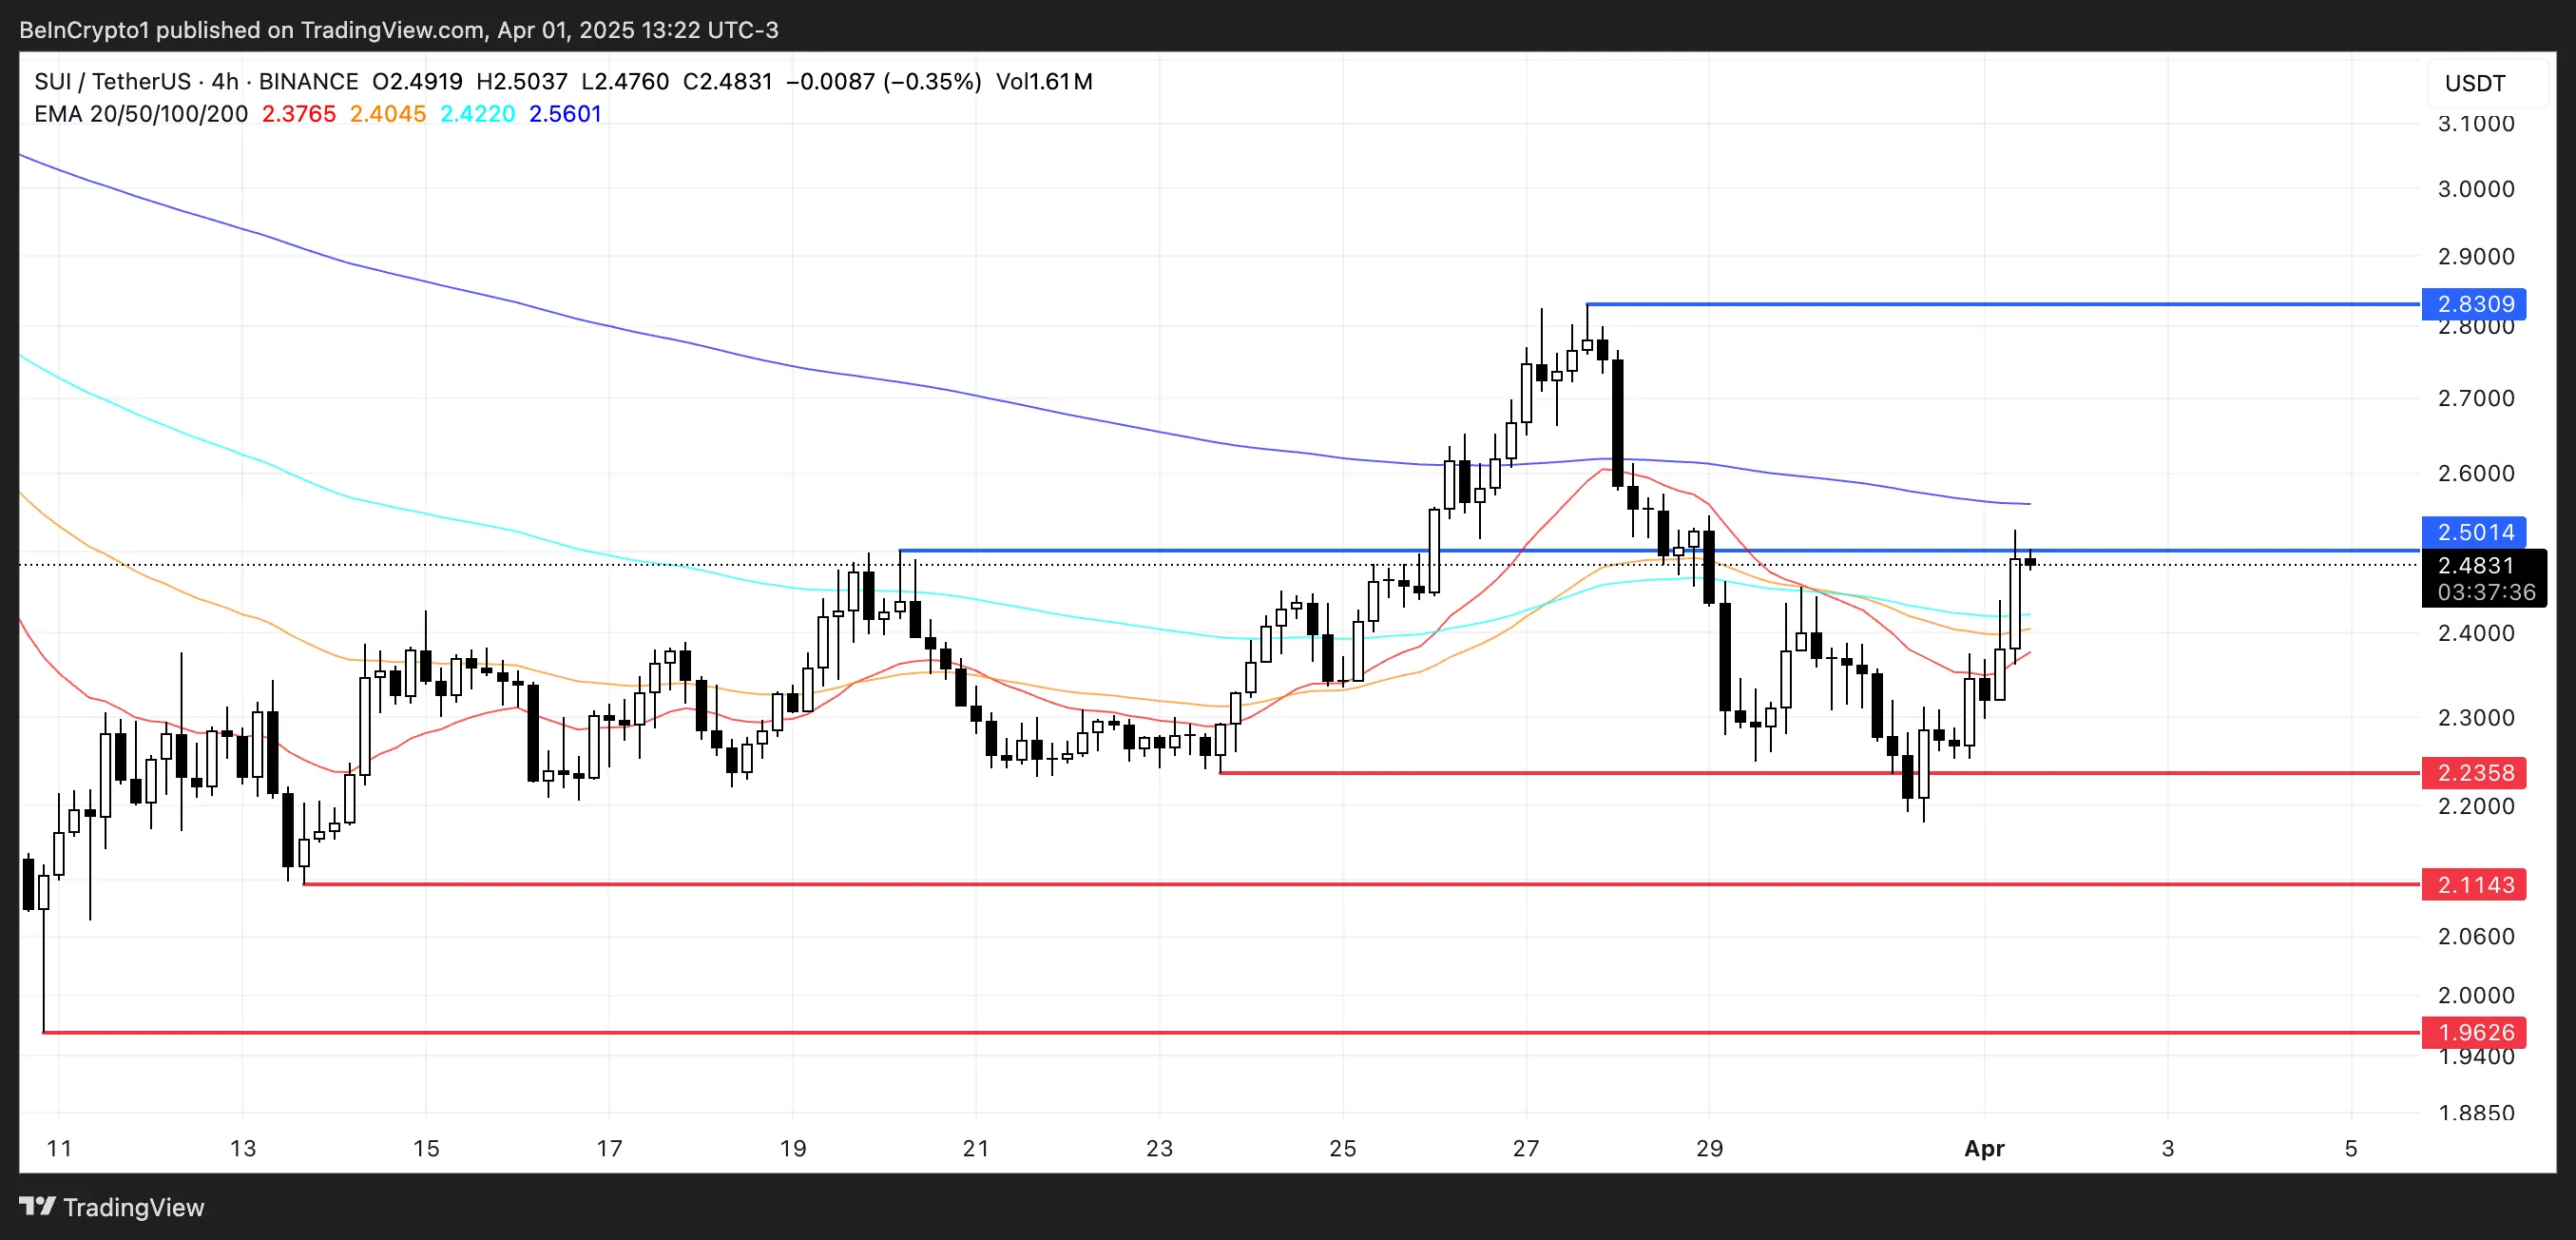
That said, downside risks remain, particularly with today’s $147 million token unlock, which could introduce significant selling pressure. If that selling materializes, SUI price could fall back to test the support at $2.23.
A breakdown below that level would likely shift momentum back in favor of bears. This would expose deeper supports at $2.11 and $1.96.
Disclaimer
In line with the Trust Project guidelines, this price analysis article is for informational purposes only and should not be considered financial or investment advice. BeInCrypto is committed to accurate, unbiased reporting, but market conditions are subject to change without notice. Always conduct your own research and consult with a professional before making any financial decisions. Please note that our Terms and Conditions, Privacy Policy, and Disclaimers have been updated.

Analyst Reveals ‘Worst Case Scenario’ With Head And Shoulders Formation

BeInCrypto US Morning Briefing: Standard Chartered and Bitcoin
SUI Price Stalls After Major $147 Million Token Unlock

Bitcoin Could Serve as Inflation Hedge or Tech Stock, Say Experts

Circle Files for IPO

Solana Faces Resistance While ETH Sees DEX Volume Boost

2.52 Million Altcoins Are Ruining Crypto’s Future

Animoca Brands Valuation Tanks 75% In Two Years, Here’s Why

Crypto exchange BingX hacked for $43 million

Are The Big Players Losing Interest?

Hong Kong’s Securities Association Tips Authorities On Crypto Self-Regulation

Coinbase cbBTC Set to go Live on Solana
2.52 Million Altcoins Are Ruining Crypto’s Future
Animoca Brands Valuation Tanks 75% In Two Years, Here’s Why
Crypto exchange BingX hacked for $43 million
Are The Big Players Losing Interest?
Hong Kong’s Securities Association Tips Authorities On Crypto Self-Regulation
Coinbase cbBTC Set to go Live on Solana
-

 Market17 hours ago
Bitcoin Price Battles Key Hurdles—Is a Breakout Still Possible?
-

 Bitcoin16 hours ago
Big Bitcoin Buy Coming? Saylor Drops a Hint as Strategy Shifts
-

 Market23 hours ago
Ethereum Price Faces a Tough Test—Can It Clear the Hurdle?
-

 Bitcoin15 hours ago
$500 Trillion Bitcoin? Saylor’s Bold Prediction Shakes the Market!
-

 Market22 hours ago
Solana (SOL) Holds Steady After Decline—Breakout or More Downside?
-

 Ethereum21 hours ago
$2,300 Emerges As The Most Crucial Resistance
-

 Market21 hours ago
CFTC’s Crypto Market Overhaul Under New Chair Brian Quintenz
-
 Altcoin13 hours ago
Will XRP, SOL, ADA Make the List?