
Market
What Could Trigger More Losses?

XRP price is consolidating losses above the $0.500 support. The price could extend losses if it fails to recover above the $0.530 resistance zone.
- XRP extended losses and traded below the $0.530 support.
- The price is now trading below $0.5250 and the 100-hourly Simple Moving Average.
- There was a break above a connecting bearish trend line with resistance at $0.5150 on the hourly chart of the XRP/USD pair (data source from Kraken).
- The pair could start another increase if the bulls push the price above $0.530.
XRP Price Stable Above $0.50
Recently, XRP price extended losses and traded below the $0.5250 support, like Bitcoin and Ethereum. There was a move toward the $0.5080 support. A low was formed at $0.5087 and the price is now consolidating losses.
There was a minor increase above the $0.5120 resistance. Besides, there was a break above a connecting bearish trend line with resistance at $0.5150 on the hourly chart of the XRP/USD pair. However, the pair is still trading below $0.5250 and the 100-hourly Simple Moving Average.
Immediate resistance is near the $0.5250 level. It is near the 23.6% Fib retracement level of the downward move from the $0.5699 swing high to the $0.5087 low. The first key resistance is near $0.530 and the 100-hourly Simple Moving Average.
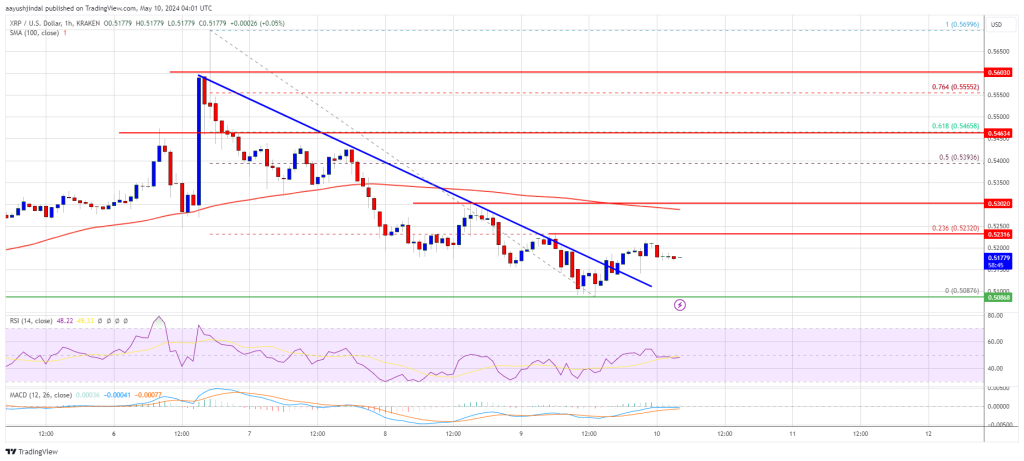
Source: XRPUSD on TradingView.com
A close above the $0.530 resistance zone could spark a strong increase. The next key resistance is near $0.5465. If the bulls remain in action above the $0.5465 resistance level, there could be a rally toward the $0.580 resistance. Any more gains might send the price toward the $0.600 resistance.
More Losses?
If XRP fails to clear the $0.530 resistance zone, it could start another decline. Initial support on the downside is near the $0.5150 level.
The next major support is at $0.5080. If there is a downside break and a close below the $0.5080 level, the price might accelerate lower. In the stated case, the price could retest the $0.4840 support zone.
Technical Indicators
Hourly MACD – The MACD for XRP/USD is now losing pace in the bearish zone.
Hourly RSI (Relative Strength Index) – The RSI for XRP/USD is now below the 50 level.
Major Support Levels – $0.5150 and $0.5080.
Major Resistance Levels – $0.5250 and $0.530.


Crypto and TradFi markets had a strong opening today, as Bitcoin briefly jumped 5% due to optimism about a tariff deal. China and institutional investors in the US wish to avoid a trade war if possible.
Despite these encouraging signs, no deal has actually been reached, and Bitcoin also suffered subsequent losses. The whole market is in a state of flux until the situation becomes more clear.
How Will Bitcoin Perform Under Tariffs?
The crypto markets are full of fear right now, and it’s difficult to determine a safe bet moving forward. Since the market suffered huge liquidations yesterday, it opened with cautious optimism today.
This trend was particularly influenced by Bitcoin, which briefly jumped around 5% due to hopes about a potential deal on Trump’s tariffs.
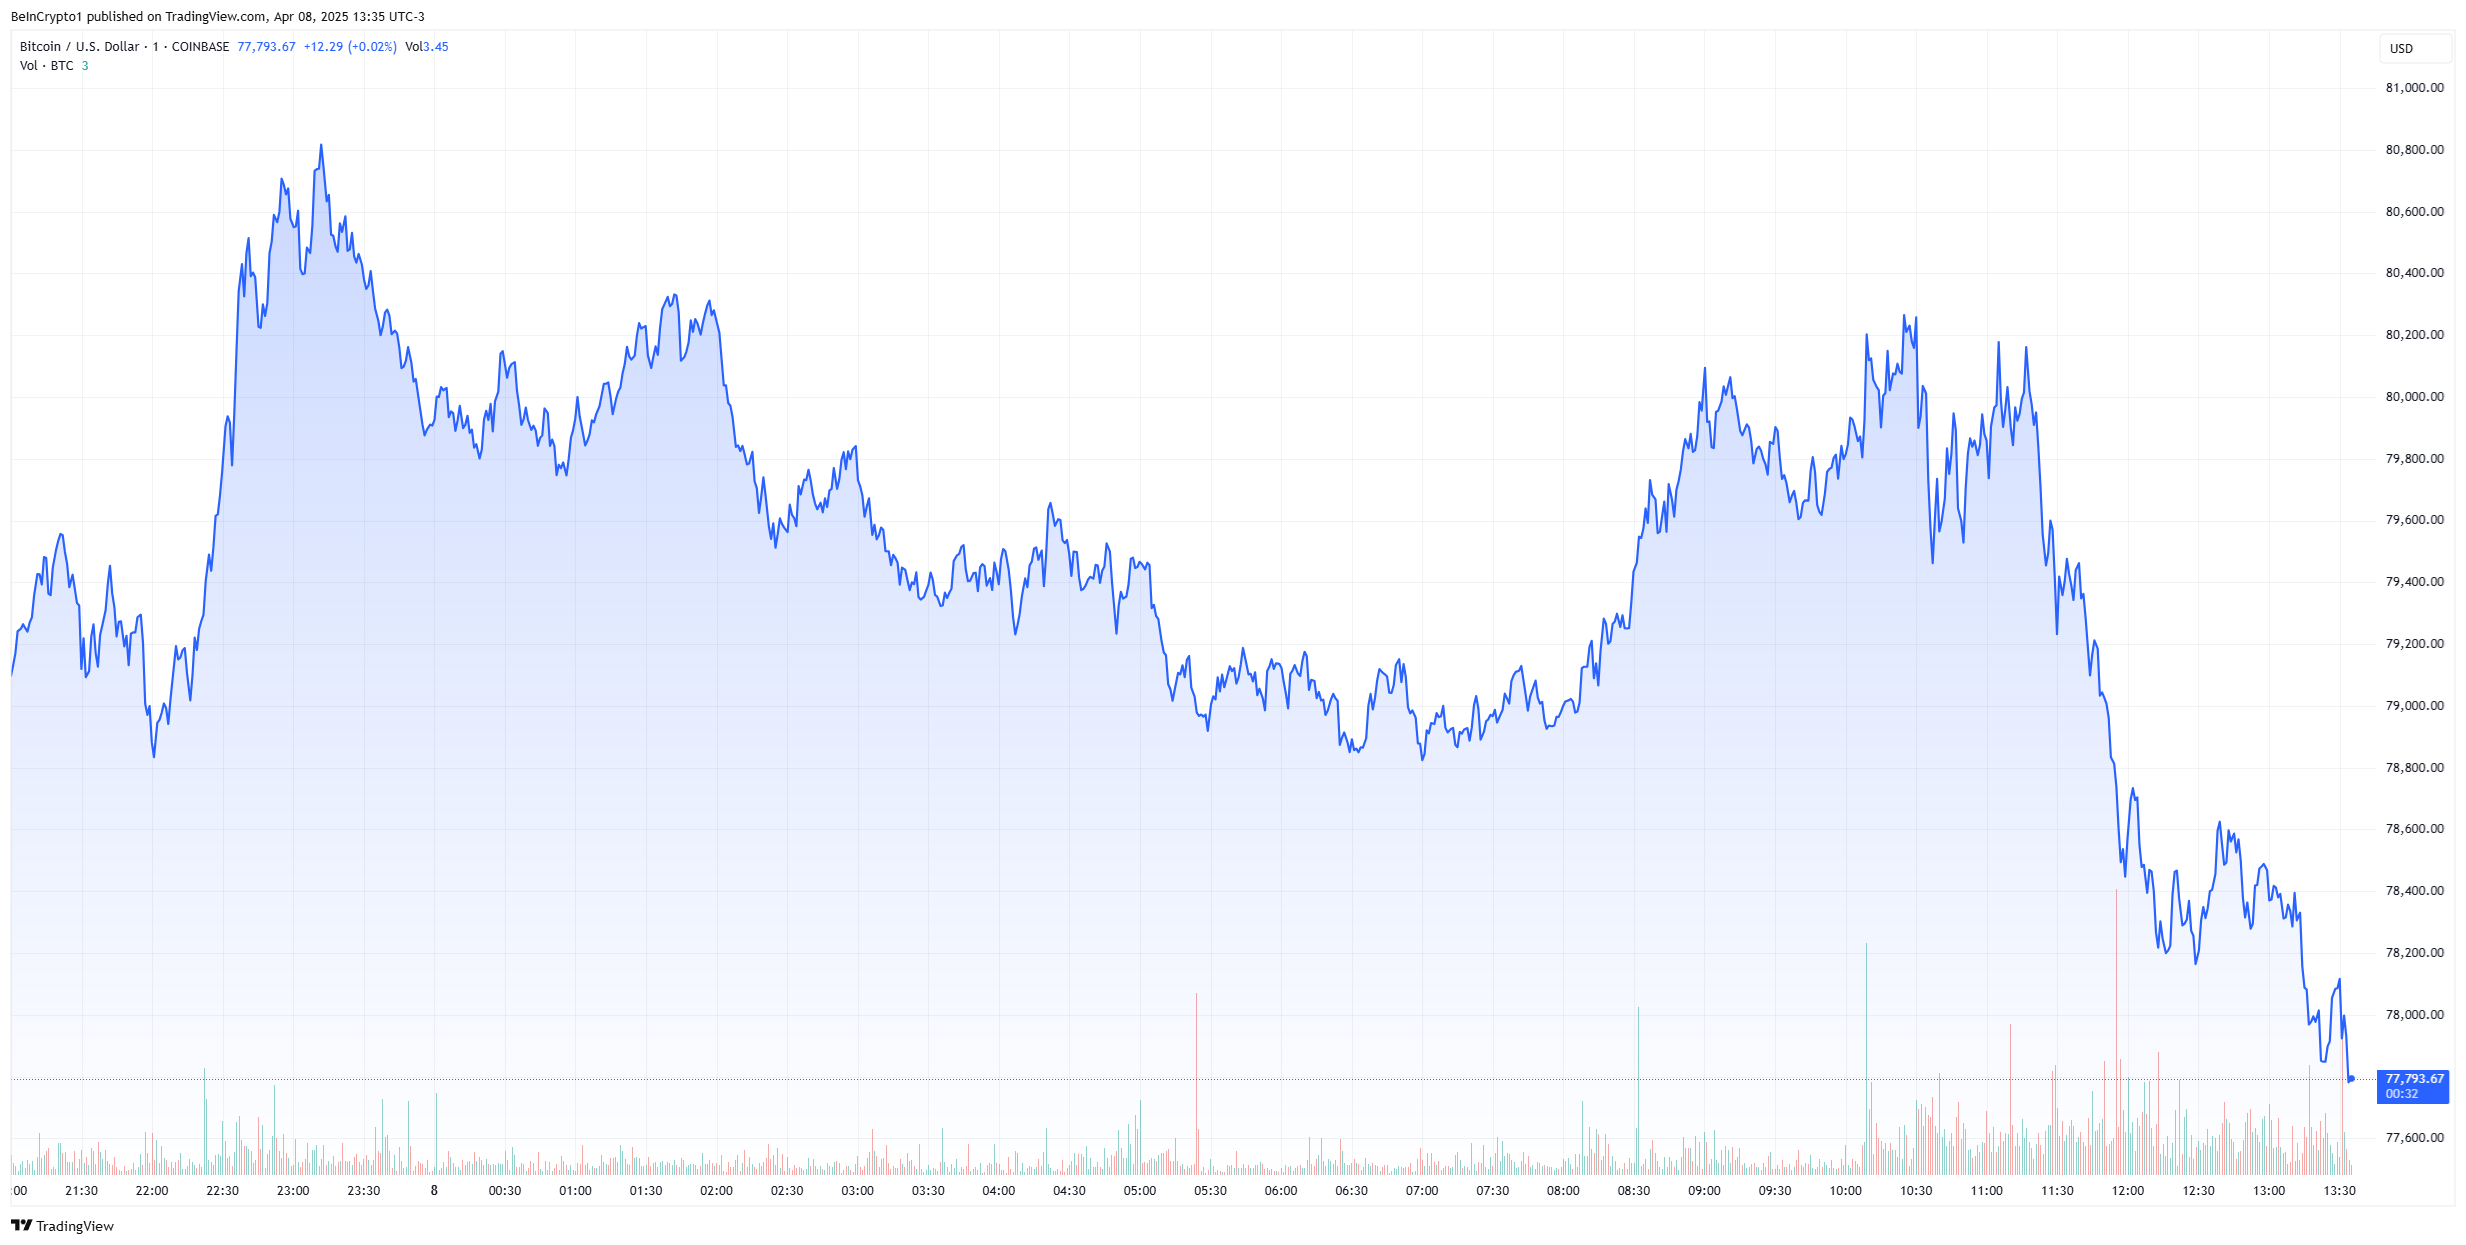
The price of Bitcoin has fluctuated wildly due to the tariffs as speculation about a sell-off increases. However, the whole market is in a chaotic state right now.
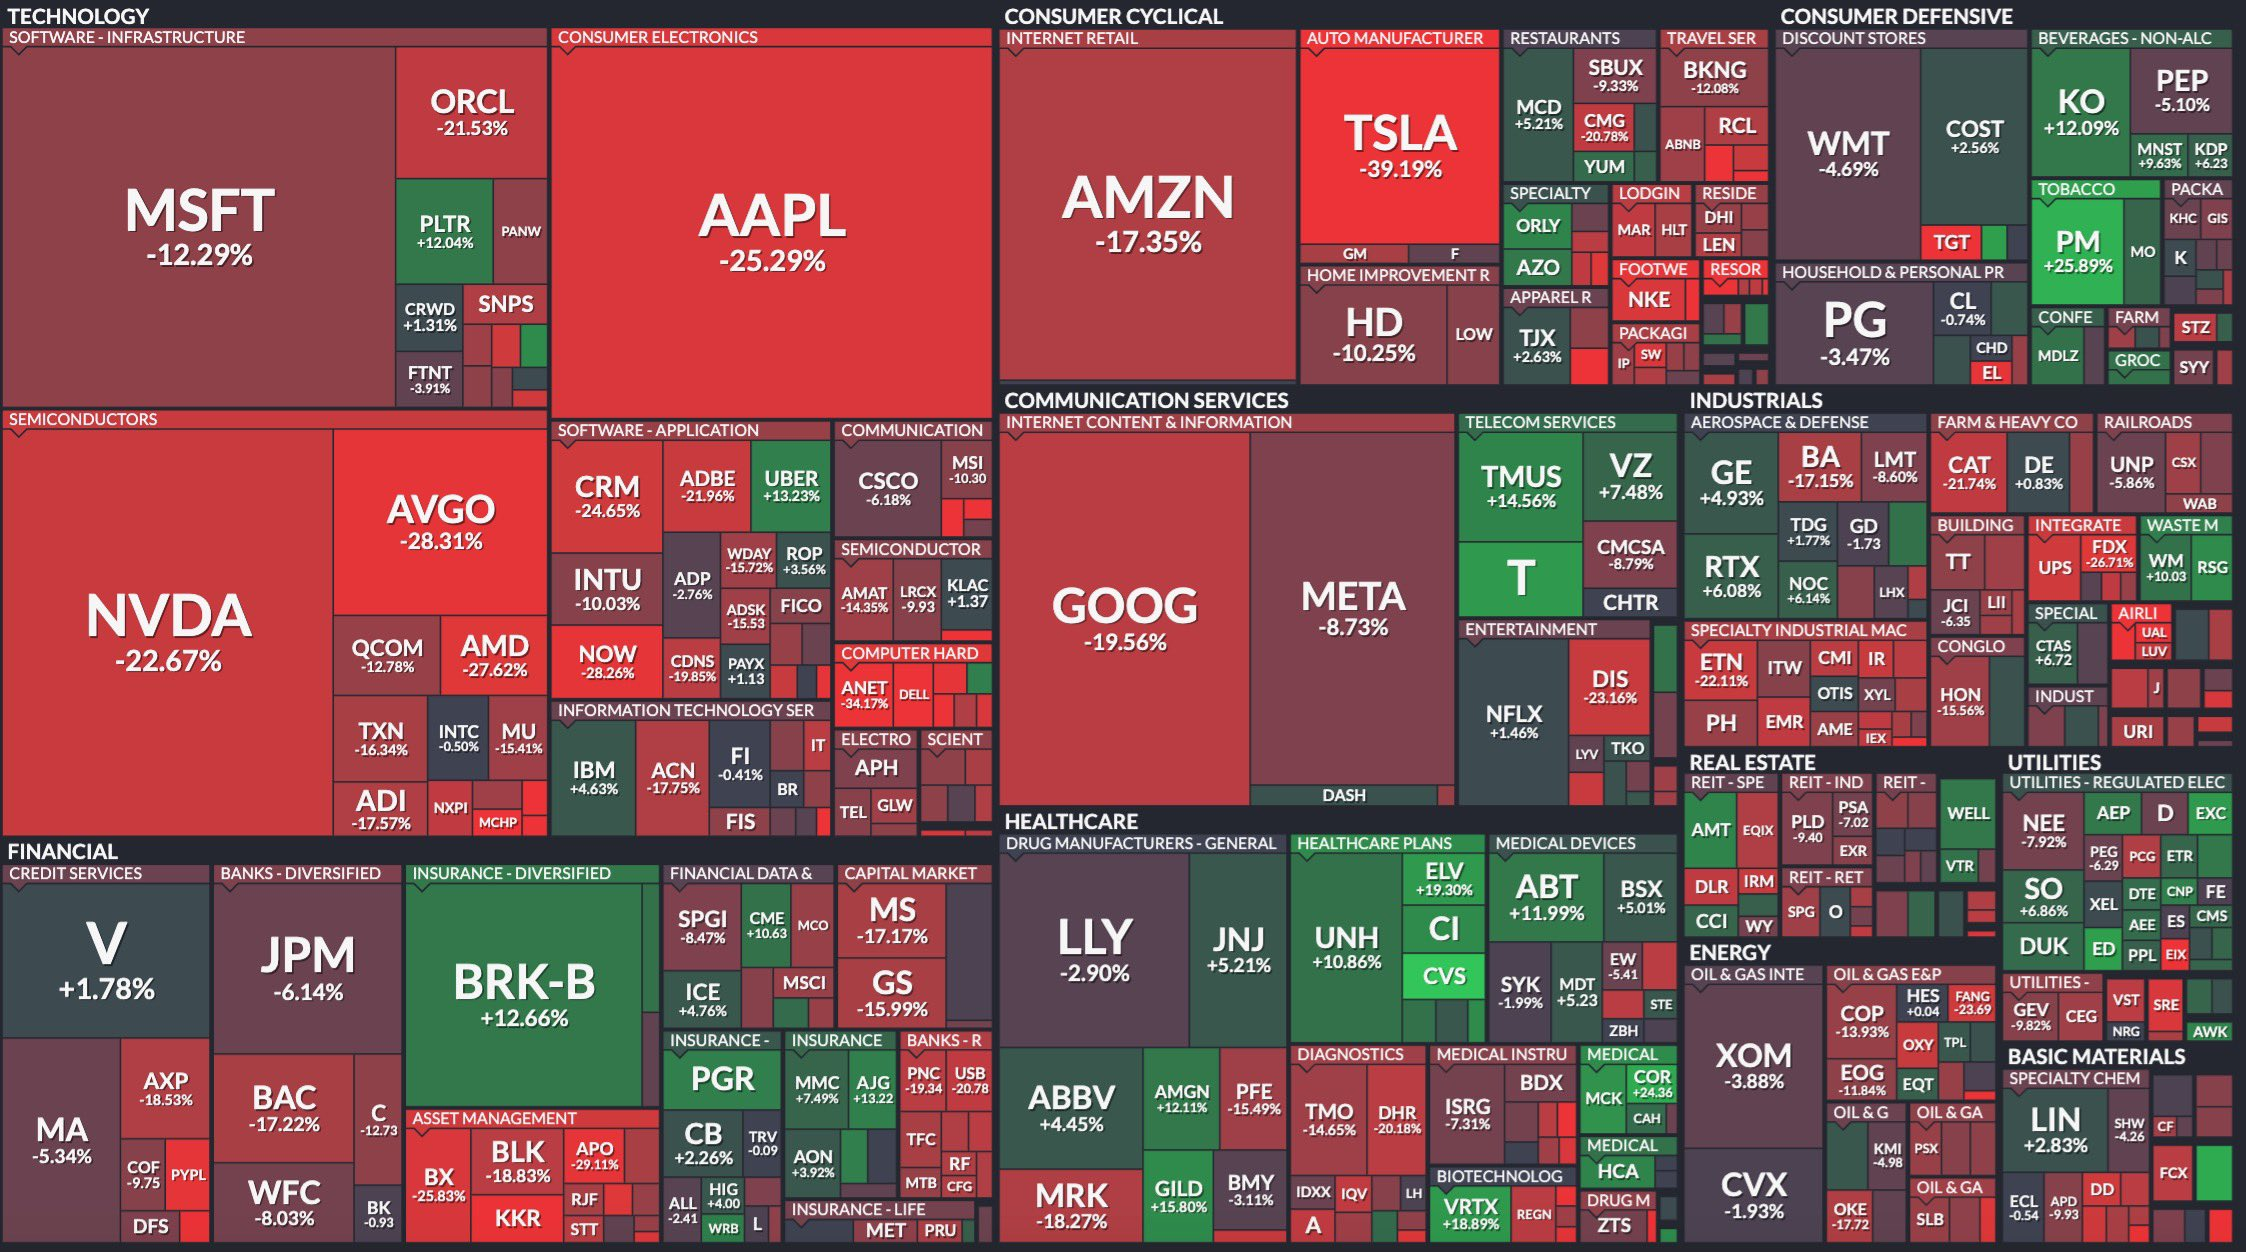
Today, the Dow Jones Industrial Average surged 1,285 points, or 3.4%, while the S&P 500 and Nasdaq Composite both jumped 3.4% and 3.3%, respectively. Nonetheless, hundreds of stocks have fallen 20% or more.
Meanwhile, Bitcoin has a few advantages that can protect it from tariff volatility. For example, a recent report from Binance Research claims that the least risky cryptoassets are the most insulated from drops.
This includes RWAs and centralized exchanges, but Bitcoin is a close third.
Furthermore, the markets are very optimistic about a deal to avoid the tariffs. Yesterday, rumors of a pause triggered a trillion-dollar rally, highlighting traders’ desperation for good news.
Despite the retaliatory tariffs, China is similarly eager to avoid a full-blown trade war with the US. Trump claimed that he is making progress with China and South Korea, fueling optimism.
Nonetheless, it’s important not to overstate Bitcoin’s chances of success under tariffs. Despite the hopes on both sides of the Pacific, China confirmed that it’s prepared to fight a trade war if Trump forces its hand.
This might explain Bitcoin’s price drops despite its strong performance since yesterday. Ultimately, all we can do is wait and hope.
Disclaimer
In adherence to the Trust Project guidelines, BeInCrypto is committed to unbiased, transparent reporting. This news article aims to provide accurate, timely information. However, readers are advised to verify facts independently and consult with a professional before making any decisions based on this content. Please note that our Terms and Conditions, Privacy Policy, and Disclaimers have been updated.
Reason to trust
![]()
Strict editorial policy that focuses on accuracy, relevance, and impartiality
Created by industry experts and meticulously reviewed
The highest standards in reporting and publishing
Strict editorial policy that focuses on accuracy, relevance, and impartiality
Morbi pretium leo et nisl aliquam mollis. Quisque arcu lorem, ultricies quis pellentesque nec, ullamcorper eu odio.
Ripple Labs has announced a major acquisition to shock the market out of an otherwise dreadful week. Taking to X (formerly Twitter), the crypto firm announced that it has acquired Hidden Road, a brokerage, clearing, and financing firm as it moves forward in its mission to become the leader for institutional investors moving into the digital assets space.
Ripple Acquires Hidden Road For $1.25 Billion
The Tuesday announcement by Ripple has further solidified the mission that the crypto firm has long put forward, and that is to provide instant and quick transfer of value for traditional and institutional investors coming into the digital assets space.
Related Reading
As CEO Brad Garlinghouse explained in a separate X post, the decision to acquire Hidden Road for $1.25 billion comes after a long-standing customer relationship with the company. Garlinghouse revealed that Ripple understands the breadth of Hidden Road’s expertise, making it a prime candidate for the acquisition.
The integration of the XRP Ledger by Hidden Road will allow for cheap and fast movement of value to the brokerage’s customers, which moves over $3 trillion annually. A portion of this massive value is expected to move through the ledger, as well as using the RLUSD stablecoin as collateral for brokerage services.
Additionally, Hidden Road will be able to expand its capacity for value transfer, allowing Ripple to process even more volume. “With this deal and the backing of Ripple’s significant balance sheet, Hidden Road will exponentially expand its capacity to service its pipeline and become the largest non-bank prime broker globally,” Garlinghouse’s post read.
This acquisition comes after Ripple acquired Standard Custody back in February 2024. Standard Custody provided an online platform offering clients digital asset custody solutions, enabling Ripple to move into the custody market as well.
XRP Price Responds
Despite the Ripple announcement, the XRP price has remained muted as it continues to struggle below $2, which has since turned to resistance. At the time of writing, XRP is still holding at $1.96, despite its almost 10% in the last 24 hours.
Related Reading
According to data from Coinmarketcap, the XRP daily trading volume has seen a notable decline, dropping approximately 24% in the last day. This suggests a decline in participation from investors, due to the bearish headwinds that continue to blow through the crypto market.
A recovery from here is highly dependent on Bitcoin, which continues to dominate the market and lead the charge.
Chart from Tradingview.com

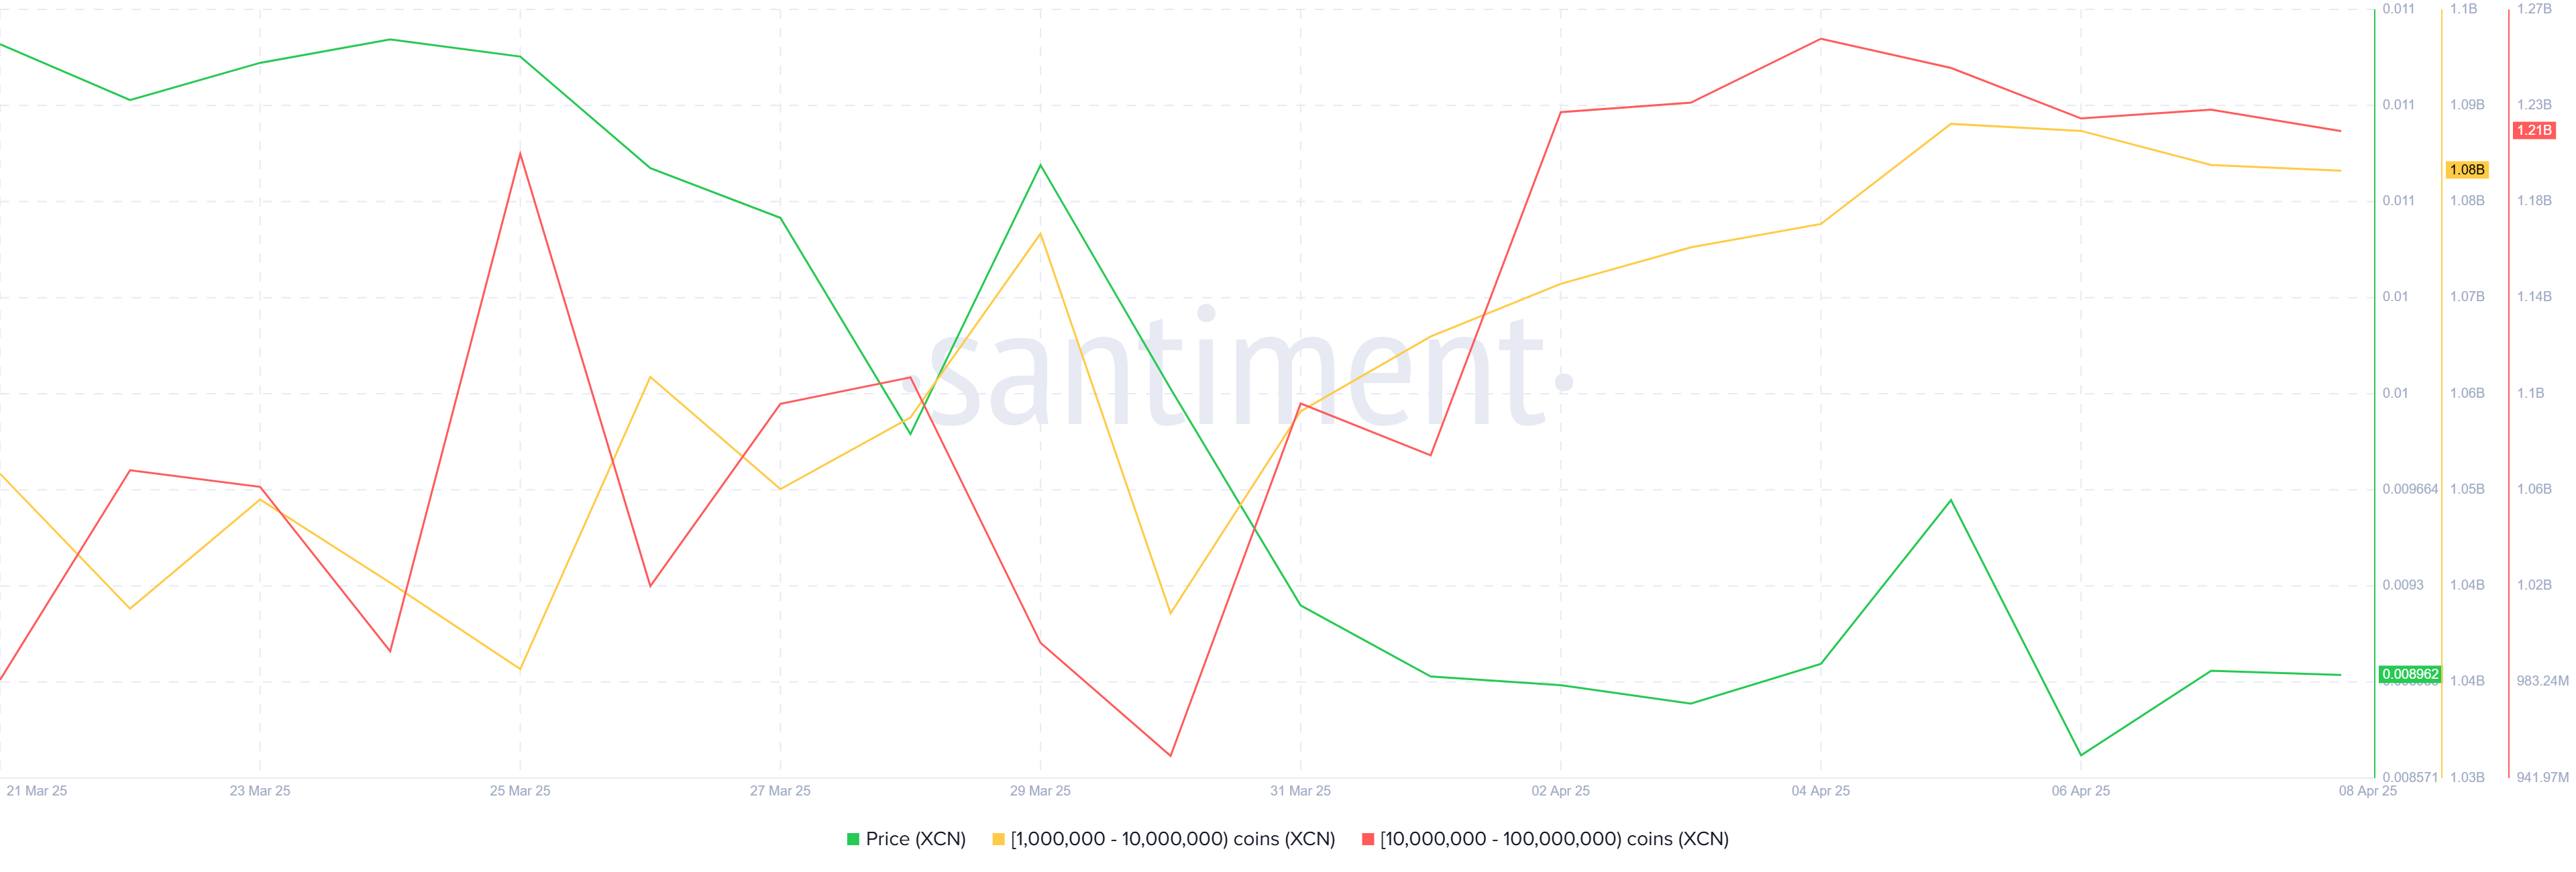
Onyxcoin (XCN) has experienced a month-long consolidation with little upward momentum, leaving the price largely stagnant. The altcoin has struggled to make significant gains, but this has not deterred key investors.
Whale addresses have continued to hold their positions, signaling optimism despite the market’s sluggishness.
Onyxcoin Whales Are Optimistic
Whale addresses, or holders with significant XCN holdings, have shown resilience amid the price decline. Over the past week, even with no growth in the altcoin’s value, these investors have refrained from selling sharply. This ongoing HODLing behavior suggests that they maintain a long-term bullish outlook for Onyxcoin, possibly expecting future gains once market conditions improve.
This conviction among large holders reflects a belief in Onyxcoin’s potential for recovery. Despite a lack of short-term gains, these investors appear focused on holding until the price begins to rise again. Their reluctance to sell even in a stagnant market is a positive indicator of potential upside when the market conditions shift.
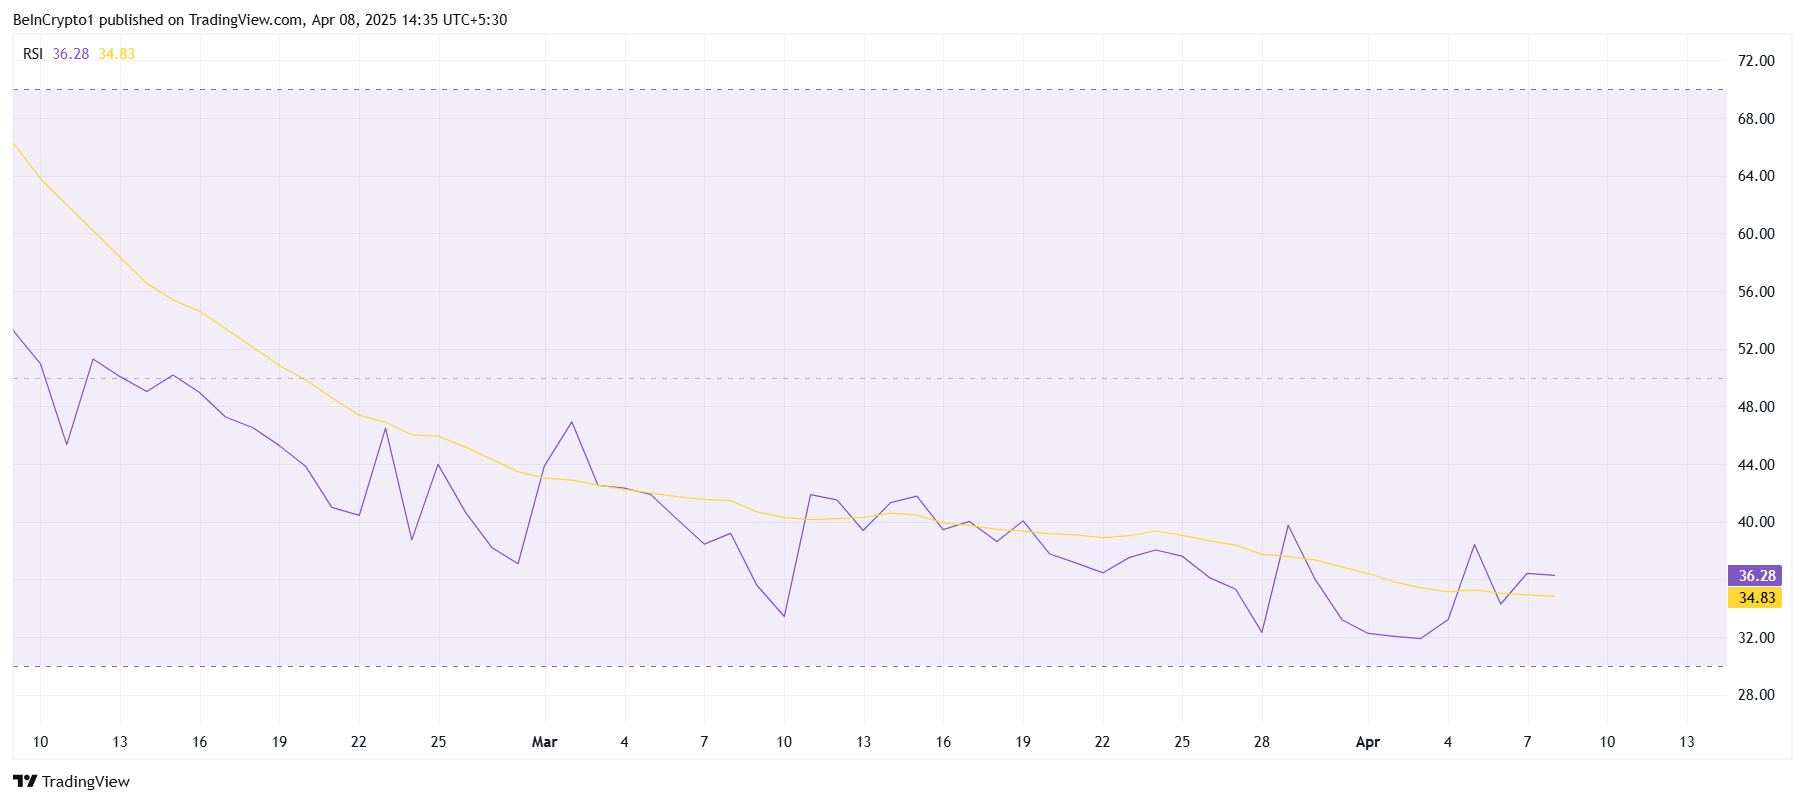
On the broader scale, technical indicators like the RSI have been showing a bearish trend for over a month, remaining stuck below the neutral line. The RSI’s positioning below 50.0 suggests that selling pressure still outweighs buying momentum, keeping the price suppressed. The indicator’s prolonged decline points to a sustained bearish market environment.
While this presents challenges for Onyxcoin in the short term, it also implies that the bearish momentum could eventually reach a saturation point. If the market shifts and buying pressure increases, XCN may experience a recovery rally, provided other macroeconomic factors align.
XCN Price Is Looking To Rise
XCN is currently trading at $0.0089, staying within a narrow range between $0.0100 and $0.0083 for the past week. This consolidation is likely to continue unless market conditions improve. The altcoin’s price action has been largely dictated by the lack of positive market momentum, limiting any immediate breakthroughs.
If the broader crypto market sees improvement, XCN could break through the $0.0100 resistance and begin moving toward the $0.0120 level. This would mark a recovery of a portion of the recent losses, potentially restoring investor confidence and signaling a shift toward a more bullish trend.
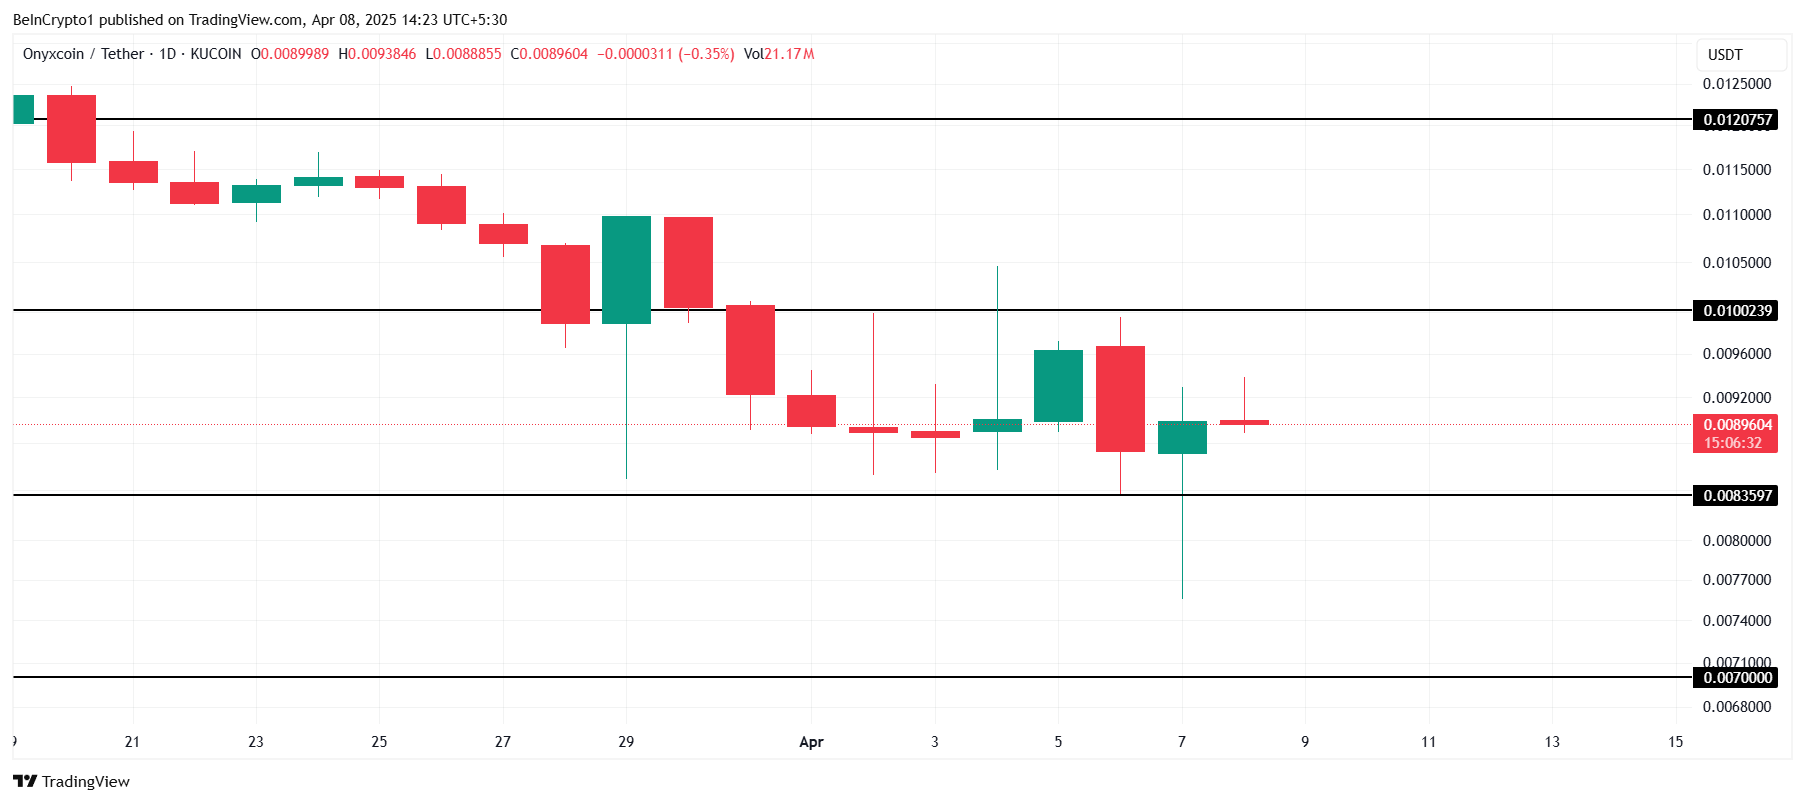
However, if XCN fails to hold above $0.0083, the altcoin could face a further decline, potentially reaching $0.0070. This would invalidate the bullish outlook and deepen the losses, reinforcing the need for caution among investors awaiting market stabilization.
Disclaimer
In line with the Trust Project guidelines, this price analysis article is for informational purposes only and should not be considered financial or investment advice. BeInCrypto is committed to accurate, unbiased reporting, but market conditions are subject to change without notice. Always conduct your own research and consult with a professional before making any financial decisions. Please note that our Terms and Conditions, Privacy Policy, and Disclaimers have been updated.

Bitcoin Briefly Recovers 5% Due To US-China Tariff Deal Optimism
Developer Advocates For Pi Network Community To Launch Liquidity Pool To Stablilize Pi Coin Price

Ripple Announces $1.25B Acquisition Of Hidden Road To Set Major Milestone

XCN Price’s Month-Long Bearishness Meets Whale Conviction
XRP Price, Traders Retreat Despite The US ETF Buzz

Bitcoin Whale Activity Peaks Amid Market Uncertainty

2.52 Million Altcoins Are Ruining Crypto’s Future

Animoca Brands Valuation Tanks 75% In Two Years, Here’s Why

Crypto exchange BingX hacked for $43 million

Are The Big Players Losing Interest?

Hong Kong’s Securities Association Tips Authorities On Crypto Self-Regulation

Coinbase cbBTC Set to go Live on Solana
2.52 Million Altcoins Are Ruining Crypto’s Future
Animoca Brands Valuation Tanks 75% In Two Years, Here’s Why
Crypto exchange BingX hacked for $43 million
Are The Big Players Losing Interest?
Hong Kong’s Securities Association Tips Authorities On Crypto Self-Regulation
Coinbase cbBTC Set to go Live on Solana
-

 Market23 hours ago
MANTRA Launches $108 Million RWA Fund As OM Price Surges
-

 Market22 hours ago
Crypto Whales Are Buying These Altcoins Post Market Crash
-

 Ethereum24 hours ago
Ethereum Capitulation May Be Nearing End – Will A Fed Pivot Spark A Recovery?
-

 Market20 hours ago
XRP Targets Rebound After Hitting Oversold Territory
-

 Ethereum23 hours ago
Ethereum Bears Loses Steam On Binance As Selling Pressure Weakens, Bulls Eyeing A Recovery?
-

 Market21 hours ago
Can the Fed Rescue Crypto Markets With Interest Rate Cuts?
-

 Market24 hours ago
AAVE Buybacks & Key Events This Week
-

 Market19 hours ago
3 Altcoins to Watch in the Second Week of April 2025