Altcoin
Veteran Trader Finds Ethereum Price Chart “Intriguing,” Rally Ahead?

Veteran trader Peter Brandt has once again captured the attention of the cryptocurrency community with his analysis of Ethereum’s chart, deeming it “very intriguing.” Brandt, renowned for his insightful analysis and decades of experience in financial markets, shared his perspective on Ethereum’s price action, sparking discussions among traders and investors.
Uncertainty Surrounds Ethereum Price Move
Brandt’s analysis of Ethereum’s chart comes at a crucial time as the cryptocurrency market navigates through volatility and uncertainty. Ethereum, the second-largest cryptocurrency by market value, recently experienced a series of price declines, mirroring Bitcoin’s downward trend. Ethereum price fell for three consecutive days to a low of $2,937 on May 8 and is currently trading at $3,000, up by 0.61% at the time of writing.
In his assessment, Brandt considered two chart patterns to gauge Ethereum’s potential trajectory. While he initially viewed the pattern as resembling a flag—a continuation pattern often observed during brief pauses in trends—Brandt later suggested it might align more with a channel due to its length. A channel forms when price action is controlled by two parallel, sloping lines, and the price has tested each line at least twice. Despite the uncertainty in labeling the pattern, Brandt emphasized the potential for a breakout in either direction.
ETH $ETH is becoming a very intriguing chart to me
The pattern is too long to be considered a flag, but a channel is the most likely labeling
I could go either way with this chart pic.twitter.com/EeSa7SyAmA— Peter Brandt (@PeterLBrandt) May 9, 2024
Brandt’s analysis underscores the need for careful consideration and analysis of Ethereum’s chart amidst the uncertainty surrounding its next price movements. Whether a flag or a channel, both patterns present possibilities of a breakout in either direction—up or down. Brandt expressed his neutrality towards the chart, stating, “I could go either way with this chart.”
Ethereum’s Market Sees Subtle Shifts Amid Open Interest Rise
In the 24-hour price analysis, Ethereum’s market exhibited subtle movements, indicated by key technical indicators such as the Relative Strength Index (RSI) and Stoch RSI. The RSI, positioned at 41.12, suggests Ethereum is neither significantly overbought nor oversold, signaling a potential phase of equilibrium or indecision within the market. This neutral positioning may lead to stability or slight price fluctuations in the short term.


Furthermore, the Stochastic RSI, a sensitive indicator signaling potential trend reversals, appears in the lower region. This indicates Ethereum might be approaching a condition where a short-term upward correction is possible following recent price declines.
Ethereum’s open interest (OI) has increased by over 2% in the last 24 hours, indicating growing interest and activity in the Ethereum market. This rise in OI may suggest a potential uptrend in the near future.
Read Also: Ripple & XRPL Labs Join Swirlds Labs & Algorand Foundation As Founding Members Of DeRec Alliance
The presented content may include the personal opinion of the author and is subject to market condition. Do your market research before investing in cryptocurrencies. The author or the publication does not hold any responsibility for your personal financial loss.
Altcoin
Pi Network Faces Community Backlash, Is Pi Coin Price Heading to Zero?

Pi Network seems to be losing ground as Pi Coin price continues to face strong selling pressure, dropping another 4% and slipping under $0.70. Furthermore, the PI trading activity in the ecosystem is also dropping, showing that the investors’ euphoria is fading away quickly. Also, the PI token unlocks happening over the past week and so have led to a negative sentiment.
Pi Network Faces Backlash Despite PiFest Announcement
Earlier today, the Pi Core team announced that the inaugural PiFest on the Open Network saw record participation, with over 125,000 registered sellers—including more than 58,000 active sellers—and 1.8 million Pioneers utilizing Map of Pi, while highlighting Pi’s real-world utility worldwide.
However, the community doesn’t seem to be pleased by this. Commenting on the reality of the PiFest, Dr. Altcoin noted: “Since the PiFest started, Pi trading activity in the Eco-system has been at its lowest. The only trade was selling Pi for Cash”. While slamming the core team further, Dr. Altcoin stated that the Pi co-founders “seem out of touch with the realities of the everyday Pi Community”.
Other community members have slammed Pi Core Team’s communication approach, stating that it has remained unchanged since the enclosed mainnet phase. Critics like Dao world argue that the monthly updates are too predictable and insufficient for sustaining a large and engaged community.
Community members are now advocating for a more transparent communication strategy, with calls for a new leadership figure who has a deep understanding of cryptocurrency.
Pi Network Reduces Base Mining Rate by 1.18% This Month
The Pi Network’s base mining rate has dropped by 1.18% this month, now standing at 0.0029030 π per hour. This adjustment continues the network’s trend of gradual mining rate reductions. Some community members speculate that the declining interest in mining may be linked to Pi’s current low trading value on exchanges.
Despite talks of the Pi Network listing on top crypto exchanges like Binance and Coinbase, it hasn’t fructified so far. However, the BTCC exchange stated that it has added the cryptocurrency for spot trading, but it failed to add any upward momentum to the Pi coin price.
Where’s Pi Coin Price Heading Next?
Over the past seven days, the Pi coin price has tanked by 20%, with the next crucial support levels at $0.60. Furthermore, the correction under $0.70 comes with heavy selling pressure as daily trading volumes tanked 52% to $148 million.
Pi Network is currently forming a classic falling wedge pattern, testing the lower boundary near $0.687. A confirmed breakout with volume above the $0.71–$0.72 range could signal a bullish move, potentially pushing the price toward $0.75–$0.78, where key resistance levels lie.


Some market analysts still have the hope that PI cryptocurrency could reverse the trajectory to hitting highs of $3 and above.
Disclaimer: The presented content may include the personal opinion of the author and is subject to market condition. Do your market research before investing in cryptocurrencies. The author or the publication does not hold any responsibility for your personal financial loss.
Altcoin
PENDLE Price Jumps 8% Today Amid Huge Whale Accumulation

PENDLE price has led the broader market gains this Wednesday, pumping nearly 8% amid bullish developments. Recent whale metrics indicated that large-scale investors bought roughly $8 million of the token, whereas a crypto exchange behemoth also listed it previously. In an upshot, traders and investors are eyeing more gains in the asset’s price due to recent advancements that underscore rising demand for the crypto.
PENDLE Price Jumps 8% Amid Bullish Whale Transactions
As of press time, PENDLE price witnessed an 8% uptick in value and exchanged hands at $3.05. The crypto’s 24-hour low and high were registered as $2.84 and $3.07, respectively.
On a keynote, the rising price action aligns with the heightened buying pressure bought by whales in recent days. The latest data from tracker Lookonchain showed that whales bought roughly $8 million worth of coins in the past 5 days. Per the data, five newly created wallets collectively accumulated the aforementioned amount.
Here Are The PENDLE Whale Addresses Captured:
-0x21fBA58b20f62397c015b1f5a15f742ad430dFA
-0x2EB48c60F4ea75fa0a0Ff5BB017EBD9f5981b8F5
-0x11DFEDf01B3FA824BbCB138159B2e6AFE43692a3
-0x981D8856f572Fb076626265114EAD67697dA5501
-0x6478C8681ADC3E7a0C17Aa1E1F0Ff16d1A61a8f6
Why Are Whales Accumulating?
Meanwhile, the rising whale accumulations and PENDLE price upswing fall in line with another bullish development. Crypto exchange behemoth Coinbase unveiled a listing for the token at the end of March last month.
As a result, large-scale investors are hoarding massive amounts of the token, aiming to capitalize on emerging market opportunities.
Historically, listings on top crypto exchanges usually usher a bullish price action as they substantially increase an asset’s market exposure, thereby welcoming more funds from investors. CoinGape previously reported another similar chronicle, wherein cryptos BROCCOLI and TUT price rallied with their listings on Binance. Similarly, the Coinbase listing appears to be a vital catalyst for driving the whale frenzy and recent price upswing.
Can Bullish Developments Fuel Bull Run Ahead?
Usual market sentiments continue to tilt in favor of bulls, given the Coinbase listing and rising whale accumulations. Further, a renowned crypto market trader has poured additional optimism surrounding the coin’s future price action with his bullish prediction.
Analyst AMCrypto recently took to X, revealing that PENDLE price is forming an “inverse head and shoulder pattern.” This pattern formation suggests that a potential trend reversal from bearish to bullish is brewing amid bullish advancements.


In light of this dynamic, the analyst predicts that a break above $3 paves the way for a massive rally ahead. As mentioned above, the coin is currently trading above this price level. As a result, market watchers continue to weigh further bullishness on the asset’s long-term price prospects.
Disclaimer: The presented content may include the personal opinion of the author and is subject to market condition. Do your market research before investing in cryptocurrencies. The author or the publication does not hold any responsibility for your personal financial loss.
Altcoin
Will BNB Price Rally to ATH After VanEck BNB ETF Filing?

Asset manager VanEck has registered for a proposed BNB exchange-traded fund (ETF), the latest among the list of its new crypto ETF filings. As a result, the trading volume for BNB Coin has shot up by 42% to more than $2.12 billion, as analysts are now closely watching for a BNB price rally to all-time highs.
In BNB Price Ready for A Mega Rally?
BNB Coin has performed relatively well over the past month compared to Bitcoin and other altcoins. While BTC and top altcoins like ETH, SOL, XRP saw double-digit losses in March, BNB Coin is down just 1% on the monthly chart. After a strong consolidation of around $610 levels, the BNB price could be eyeing a strong breakout to new all-time highs.
BNB Burn and Pascal Hardfork Offer Support
BNB Coin features a real-time burn mechanism that permanently removes a portion of gas fees from circulation. Over the past seven days, 951.85 BNB worth $571,747.74 was burned, contributing to a total burn value of nearly $160 million, as per data from BNBBurn.
BNB’s price recently gained momentum following the implementation of the Pascal hard fork, which enhanced its compatibility with Ethereum. The network is preparing for additional hard forks this month and in June, aimed at further improving transaction speeds.
Additionally, BNB Chain is gaining a lot of popularity among meme coins, adding support for Mubarak meme coin, CZ’s Dog BROCOLLI meme coin, and others.
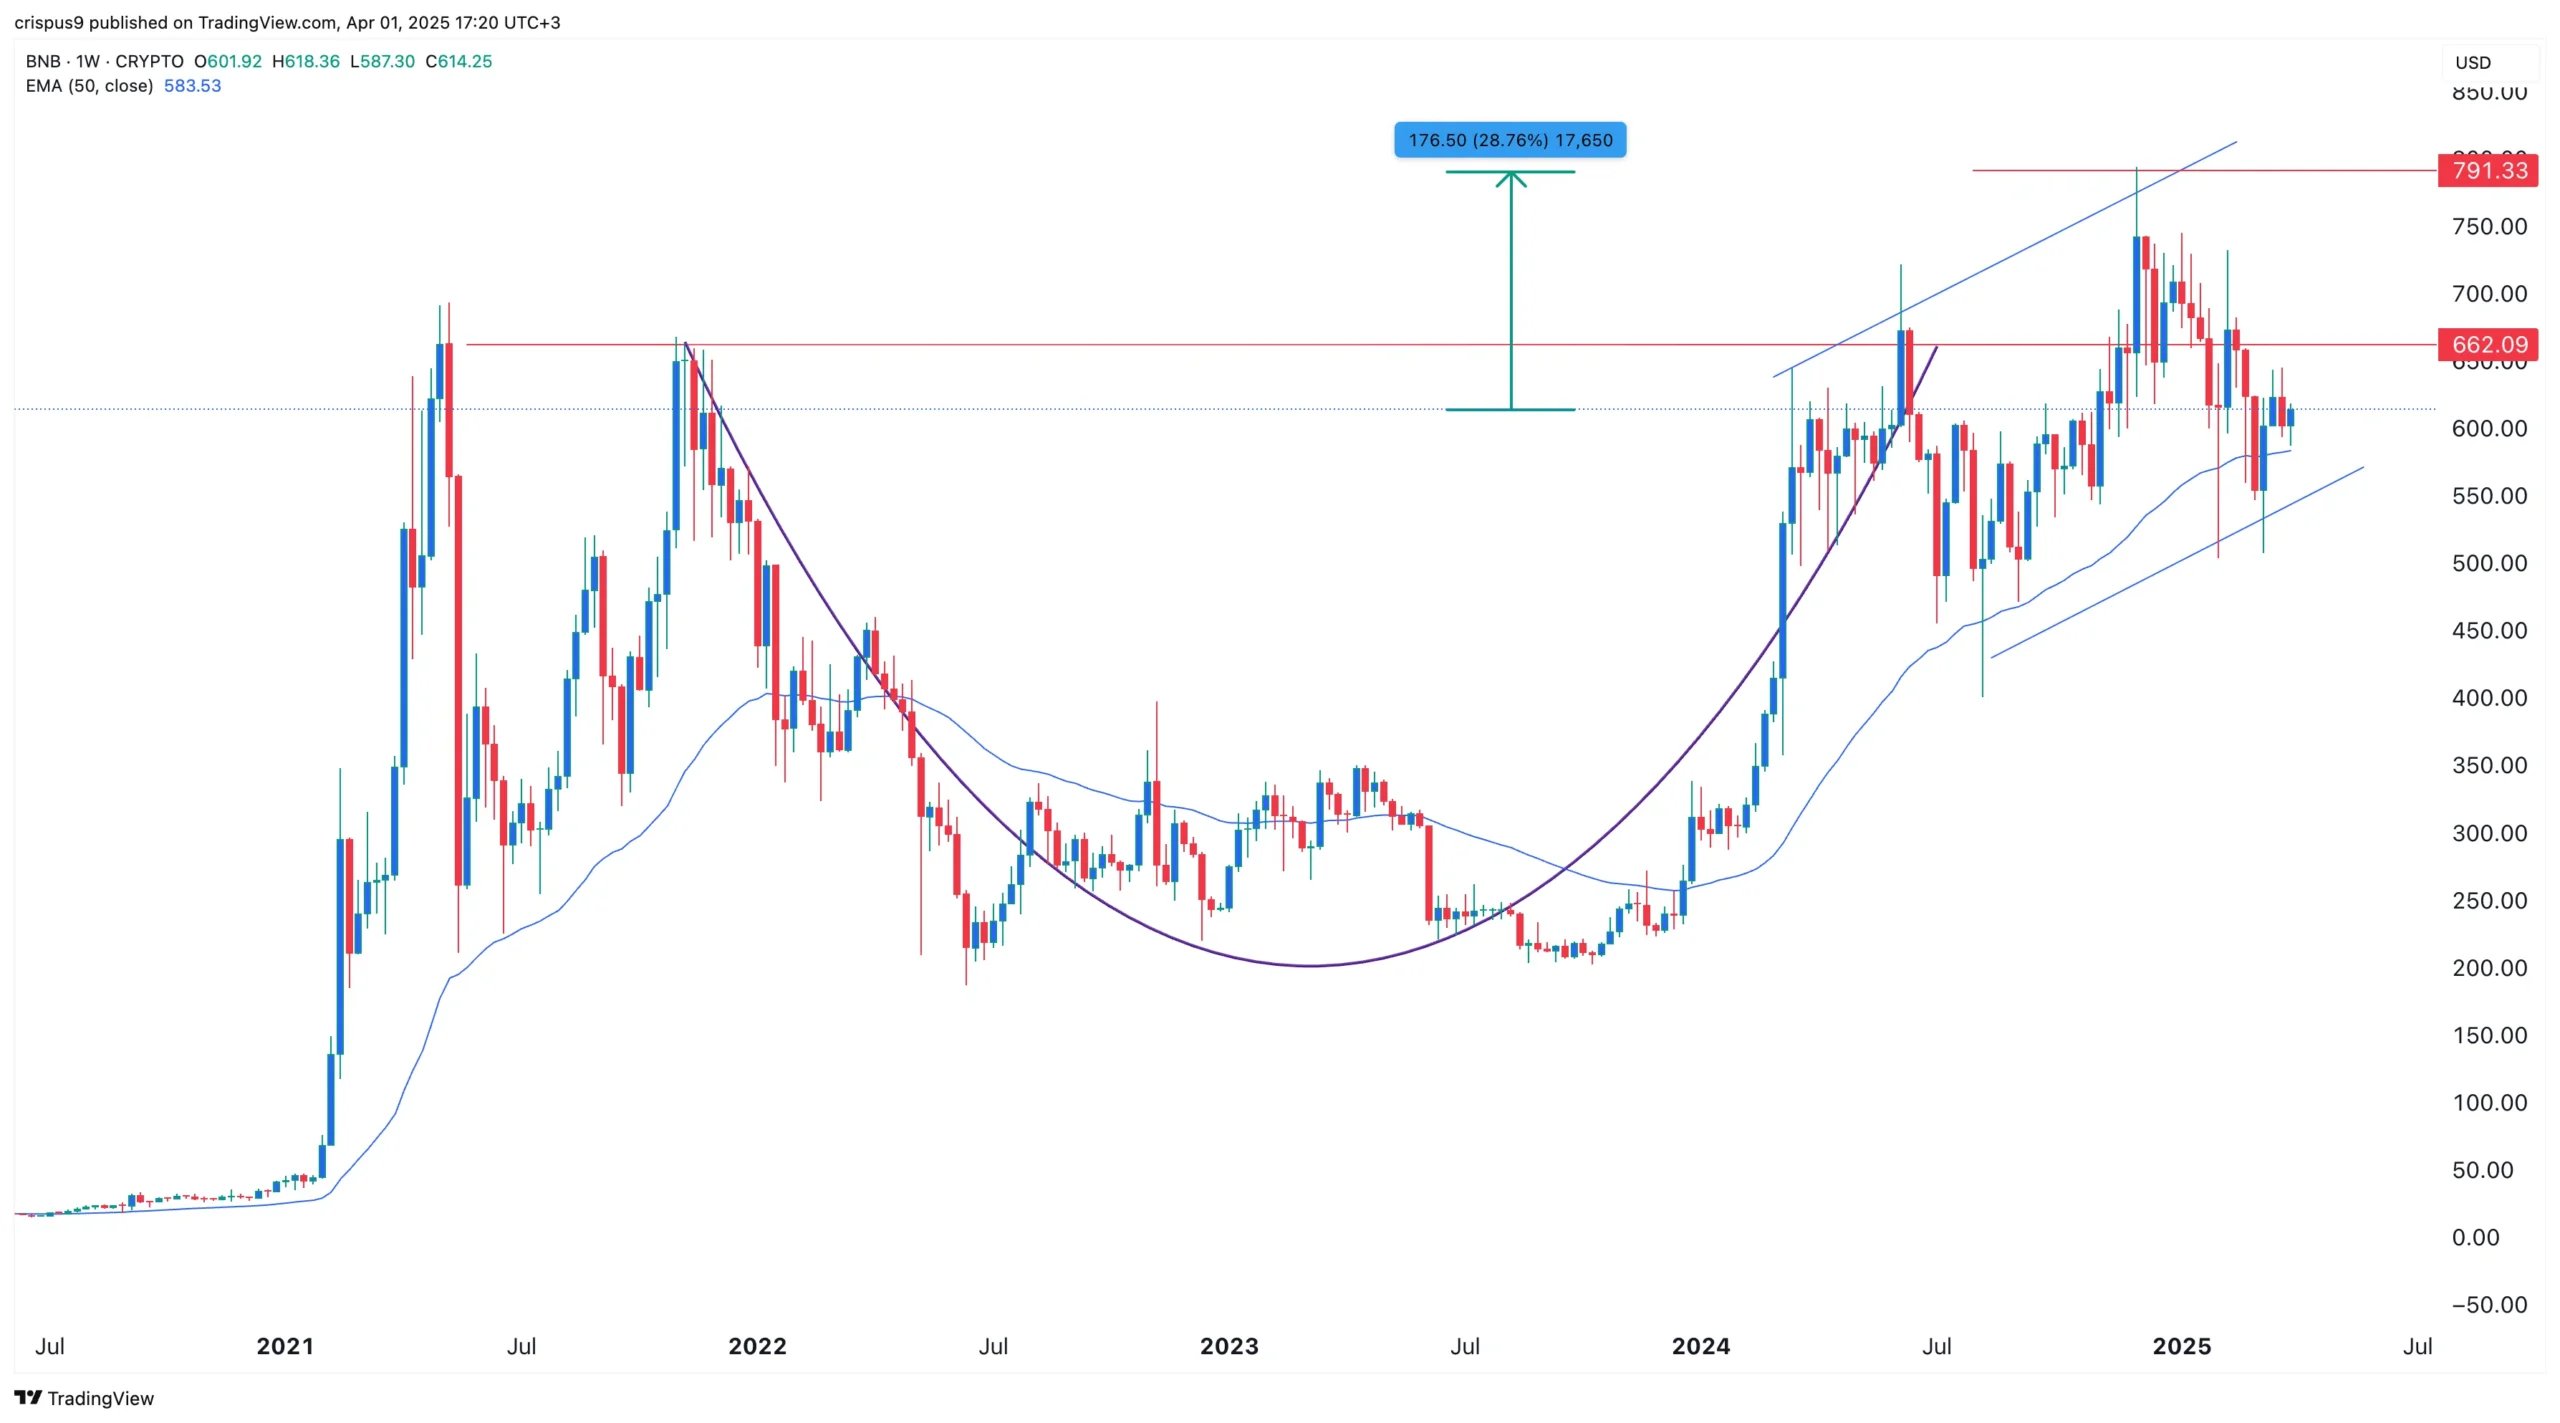
Looking at the technical setup, the BNB price chart shows that the altcoin is forming a cup-and-handle pattern, along with an ascending channel pattern formation, as shown in the image below.


On the other hand, BNB price is trading above the 50-day moving average, which is a positive indicator. But for the altcoin to kickstart a rally to its all-time high of $790, it must first complete the handle formation at $662, and give a breakout above that level.
As of press time, BNB Coin is trading at $603 levels with its daily trading volume up by 42%, surging past $2.12 billion. Furthermore, the Coinglass data shows that the BNB options trading volume is also up by 46%.
VanEck Files for Spot BNB ETF
$115 billion asset manager VanEck filed for the spot BNB ETF in Delaware on Tuesday, April 1, which could serve as a major catalyst for the BNB Coin rally ahead. The proposed BNB ETF would follow the price of BNB, the fifth-largest cryptocurrency by market capitalization.
Apart from BNB, VanEck has already submitted crypto ETF applications for Bitcoin, Ether, Solana, and Avalanche. VanEck filed for SEC approval last month to launch the first AVAX ETF, building on its success with spot Bitcoin and Ethereum ETFs.
Disclaimer: The presented content may include the personal opinion of the author and is subject to market condition. Do your market research before investing in cryptocurrencies. The author or the publication does not hold any responsibility for your personal financial loss.
-

 Market23 hours ago
Bitcoin Price Battles Key Hurdles—Is a Breakout Still Possible?
-

 Bitcoin20 hours ago
$500 Trillion Bitcoin? Saylor’s Bold Prediction Shakes the Market!
-

 Bitcoin21 hours ago
Big Bitcoin Buy Coming? Saylor Drops a Hint as Strategy Shifts
-

 Market20 hours ago
Coinbase Stock Plunges 30% in Worst Quarter Since FTX Collapse
-

 Altcoin19 hours ago
Will XRP, SOL, ADA Make the List?
-

 Altcoin18 hours ago
BTC, ETH, XRP, DOGE Fall Following Weak PMI, JOLTS Data
-

 Altcoin17 hours ago
Binance Update Sparks 50% Decline For Solana Meme Coin ACT: Details
-

 Market22 hours ago
XRP Price Struggles as Whale Selling Rises To $2.3 Billion


✓ Share: