Market
Can Solana’s (SOL) Price Reclaim This Key Support?

Solana’s (SOL) price is on the brink of breaking out of a bullish reversal pattern that could send the altcoin into a recovery rally.
This is only possible if the broader market cues keep volatility at a low and investors respond to SOL’s current value.
Solana Could See Growth
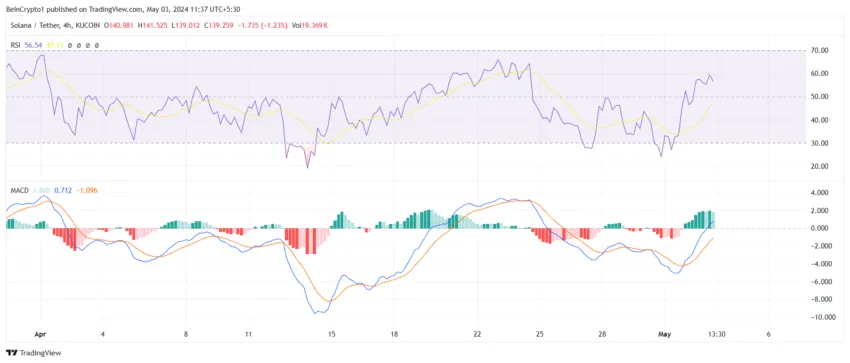
Solana’s price, currently trading at $139, forms a descending wedge that may soon break. This observation finds support in the Relative Strength Index (RSI), which gauges the speed and change of price movements.
Along with the RSI, the Moving Average Convergence Divergence (MACD), which indicates trend strength and potential reversals in an asset’s price, also notes bullishness.
Both the indicators are hinting at a rise with the RSI in the bullish zone above the neutral line at 50.0. MACD, at the same time, is observing a persisting bullish crossover, which could help SOL break the wedge.
Read More: How to Buy Solana (SOL) and Everything You Need To Know
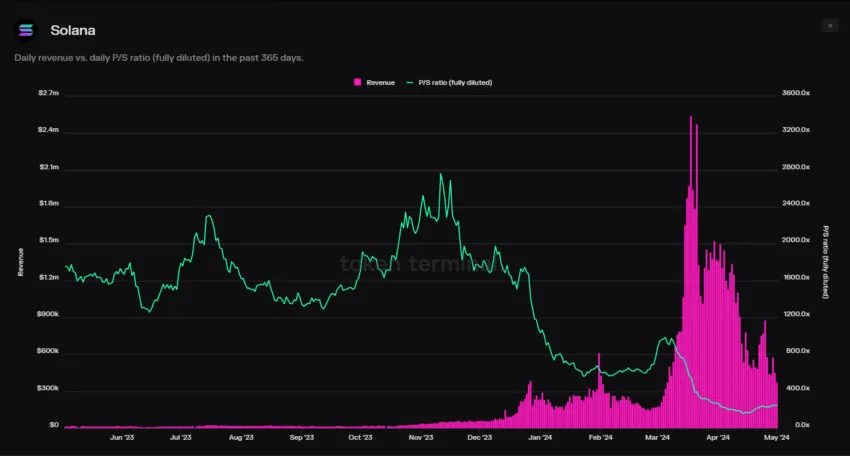
This could translate to a rally since the altcoin is highly undervalued at the moment. This is derived from the P/S ratio against the revenue noted by the asset.
The Price to Sales (P/S) ratio establishes the value of an asset, with a low ratio implying undervaluation of the stock. Conversely, a ratio exceeding the average could suggest overvaluation of the stock.
Solana’s revenue has grown considerably in the past few months, with peaks registered in March. However, at the same time, the P/S ratio has been far lower than it was during low revenue periods in Q4 2023.
This is an indication that Solana has room to grow ahead of it.
SOL Price Prediction: Awaiting a Breakout
For the past three weeks, Solana’s price has been stuck within a falling wedge. In this duration, this bullish pattern had been validated during the recent correction and recovery.
Characterized by converging trendlines sloping downward, a falling wedge forms a bullish chart pattern, which signals a potential reversal from a downtrend. It typically suggests decreasing selling pressure and potential price breakouts to the upside.
Considering the above-mentioned factors and SOL trading right under the upper trend line of the wedge, it is likely that the altcoin could break out soon. This would enable Solana to breach through the $142 resistance and reclaim $150 as a support floor.
Read More: How to Buy Solana (SOL) and Everything You Need To Know
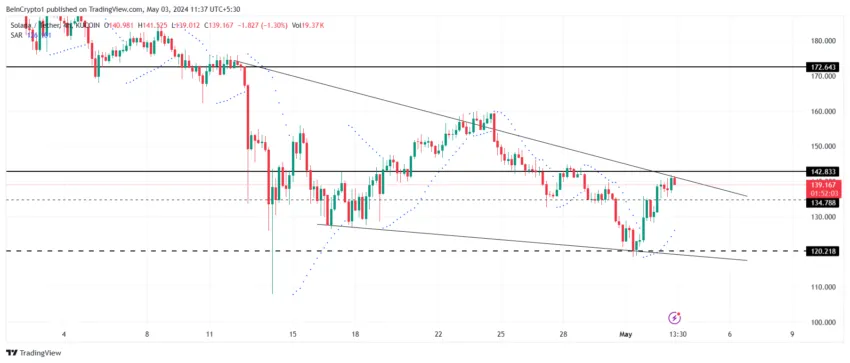
This crucial psychological level has been tested as resistance multiple times. A breakout above this level has resulted in a rally. Going forward, investors can anticipate the same this time around as well.
However, if the breach fails and SOL falls back down through $134, it could note a decline to $120. Losing this support would result in an invalidation of the bullish thesis, extending the correction to $110.
Disclaimer
In line with the Trust Project guidelines, this price analysis article is for informational purposes only and should not be considered financial or investment advice. BeInCrypto is committed to accurate, unbiased reporting, but market conditions are subject to change without notice. Always conduct your own research and consult with a professional before making any financial decisions. Please note that our Terms and Conditions, Privacy Policy, and Disclaimers have been updated.
Market
Ethereum Struggles to Break Out as Bear Trend Fades

Ethereum (ETH) enters the week with mixed signals as traders brace for tomorrow’s “Liberation Day” tariff announcement, a potential macro catalyst that could impact risk assets. While the BBTrend indicator remains deeply negative, it’s beginning to ease, hinting at a possible slowdown in bearish momentum.
On-chain data shows a slight uptick in whale accumulation, suggesting cautious optimism from large holders. Meanwhile, Ethereum’s EMA setup shows early signs of a trend reversal, but the price still needs to break key resistance levels to confirm a shift in direction.
ETH BBTrend Is Easing, But Still Very Negative
Ethereum’s BBTrend indicator is currently reading -11.66, slightly improved from -12.54 the day before, but still in negative territory for the second consecutive day.
The Bollinger Band Trend (BBTrend) measures the strength and direction of a trend based on how price interacts with the upper and lower Bollinger Bands.
A positive BBTrend suggests bullish momentum, with the price expanding toward the upper band, while a negative BBTrend indicates bearish momentum, with the price leaning toward the lower band. Typically, a value beyond 10 is considered a strong trend signal, making the current -11.66 reading a sign of continued downside pressure.

The persistent negative BBTrend suggests that Ethereum remains in a short-term bearish phase, with sellers still dominating the price action.
While yesterday’s slight uptick hints at a potential slowing of downward momentum, the indicator remains well below the neutral zone, meaning any reversal is still unconfirmed, despite Ethereum flipping Solana in DEX trading volume for the first time in 6 months.
Traders may interpret this as a warning to stay cautious, especially if ETH continues hugging the lower Bollinger Band. For now, price action remains fragile, and any bounce will need to be supported by a decisive shift in volume and sentiment to signal a meaningful reversal.
Ethereum Whales Are Accumulating Again
The number of Ethereum whales—wallets holding between 1,000 and 10,000 ETH—has ticked up slightly, rising from 5,322 to 5,330 in the past 24 hours.
While this is a modest increase, whale activity remains one of the most closely watched on-chain metrics, as these large holders often influence market direction. Whales’ accumulation can signal growing confidence in Ethereum’s medium—to long-term prospects, especially during periods of price uncertainty or consolidation.
Conversely, a decline in whale addresses typically suggests weakening conviction or profit-taking.
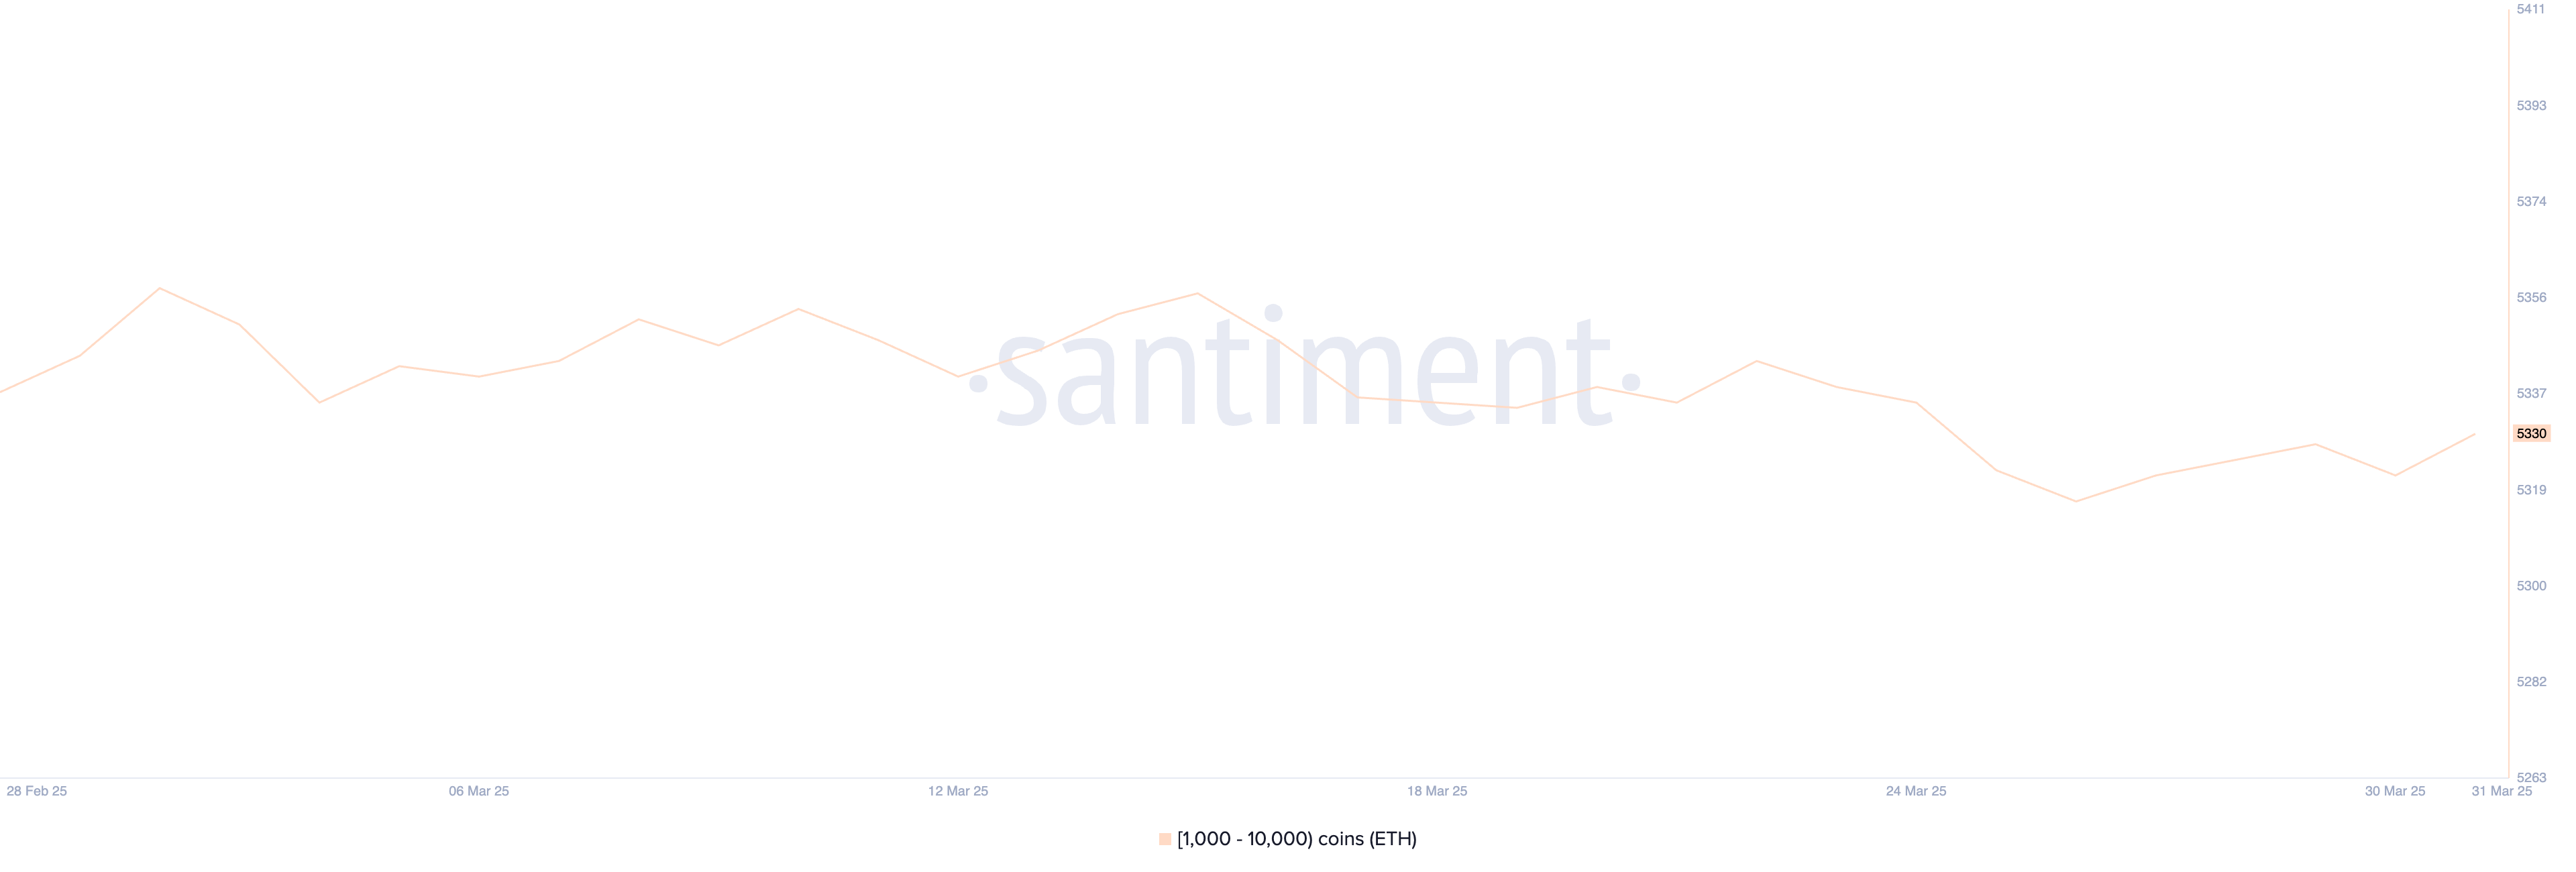
Although the recent uptick is a positive sign, it’s important to note that the current number of Ethereum whales is still below the levels observed in prior weeks.
This means that while some large holders may be re-entering the market, the broader whale cohort has yet to fully commit to an accumulation phase.
If the upward trend in whale numbers continues, it could support a bullish shift in sentiment and price. However, for now, the data points to cautious optimism rather than a decisive reversal.
Will Ethereum Break Above $2,100 Soon?
Ethereum’s EMA lines are showing early signs of a potential trend reversal, with price action attempting to break above key short-term averages.
If Ethereum price can push through the resistance at $1,938, it may signal the start of a broader recovery, potentially targeting the next resistance levels at $2,104, and if momentum builds—especially with supportive macro catalysts—increasing toward $2,320 and even $2,546.
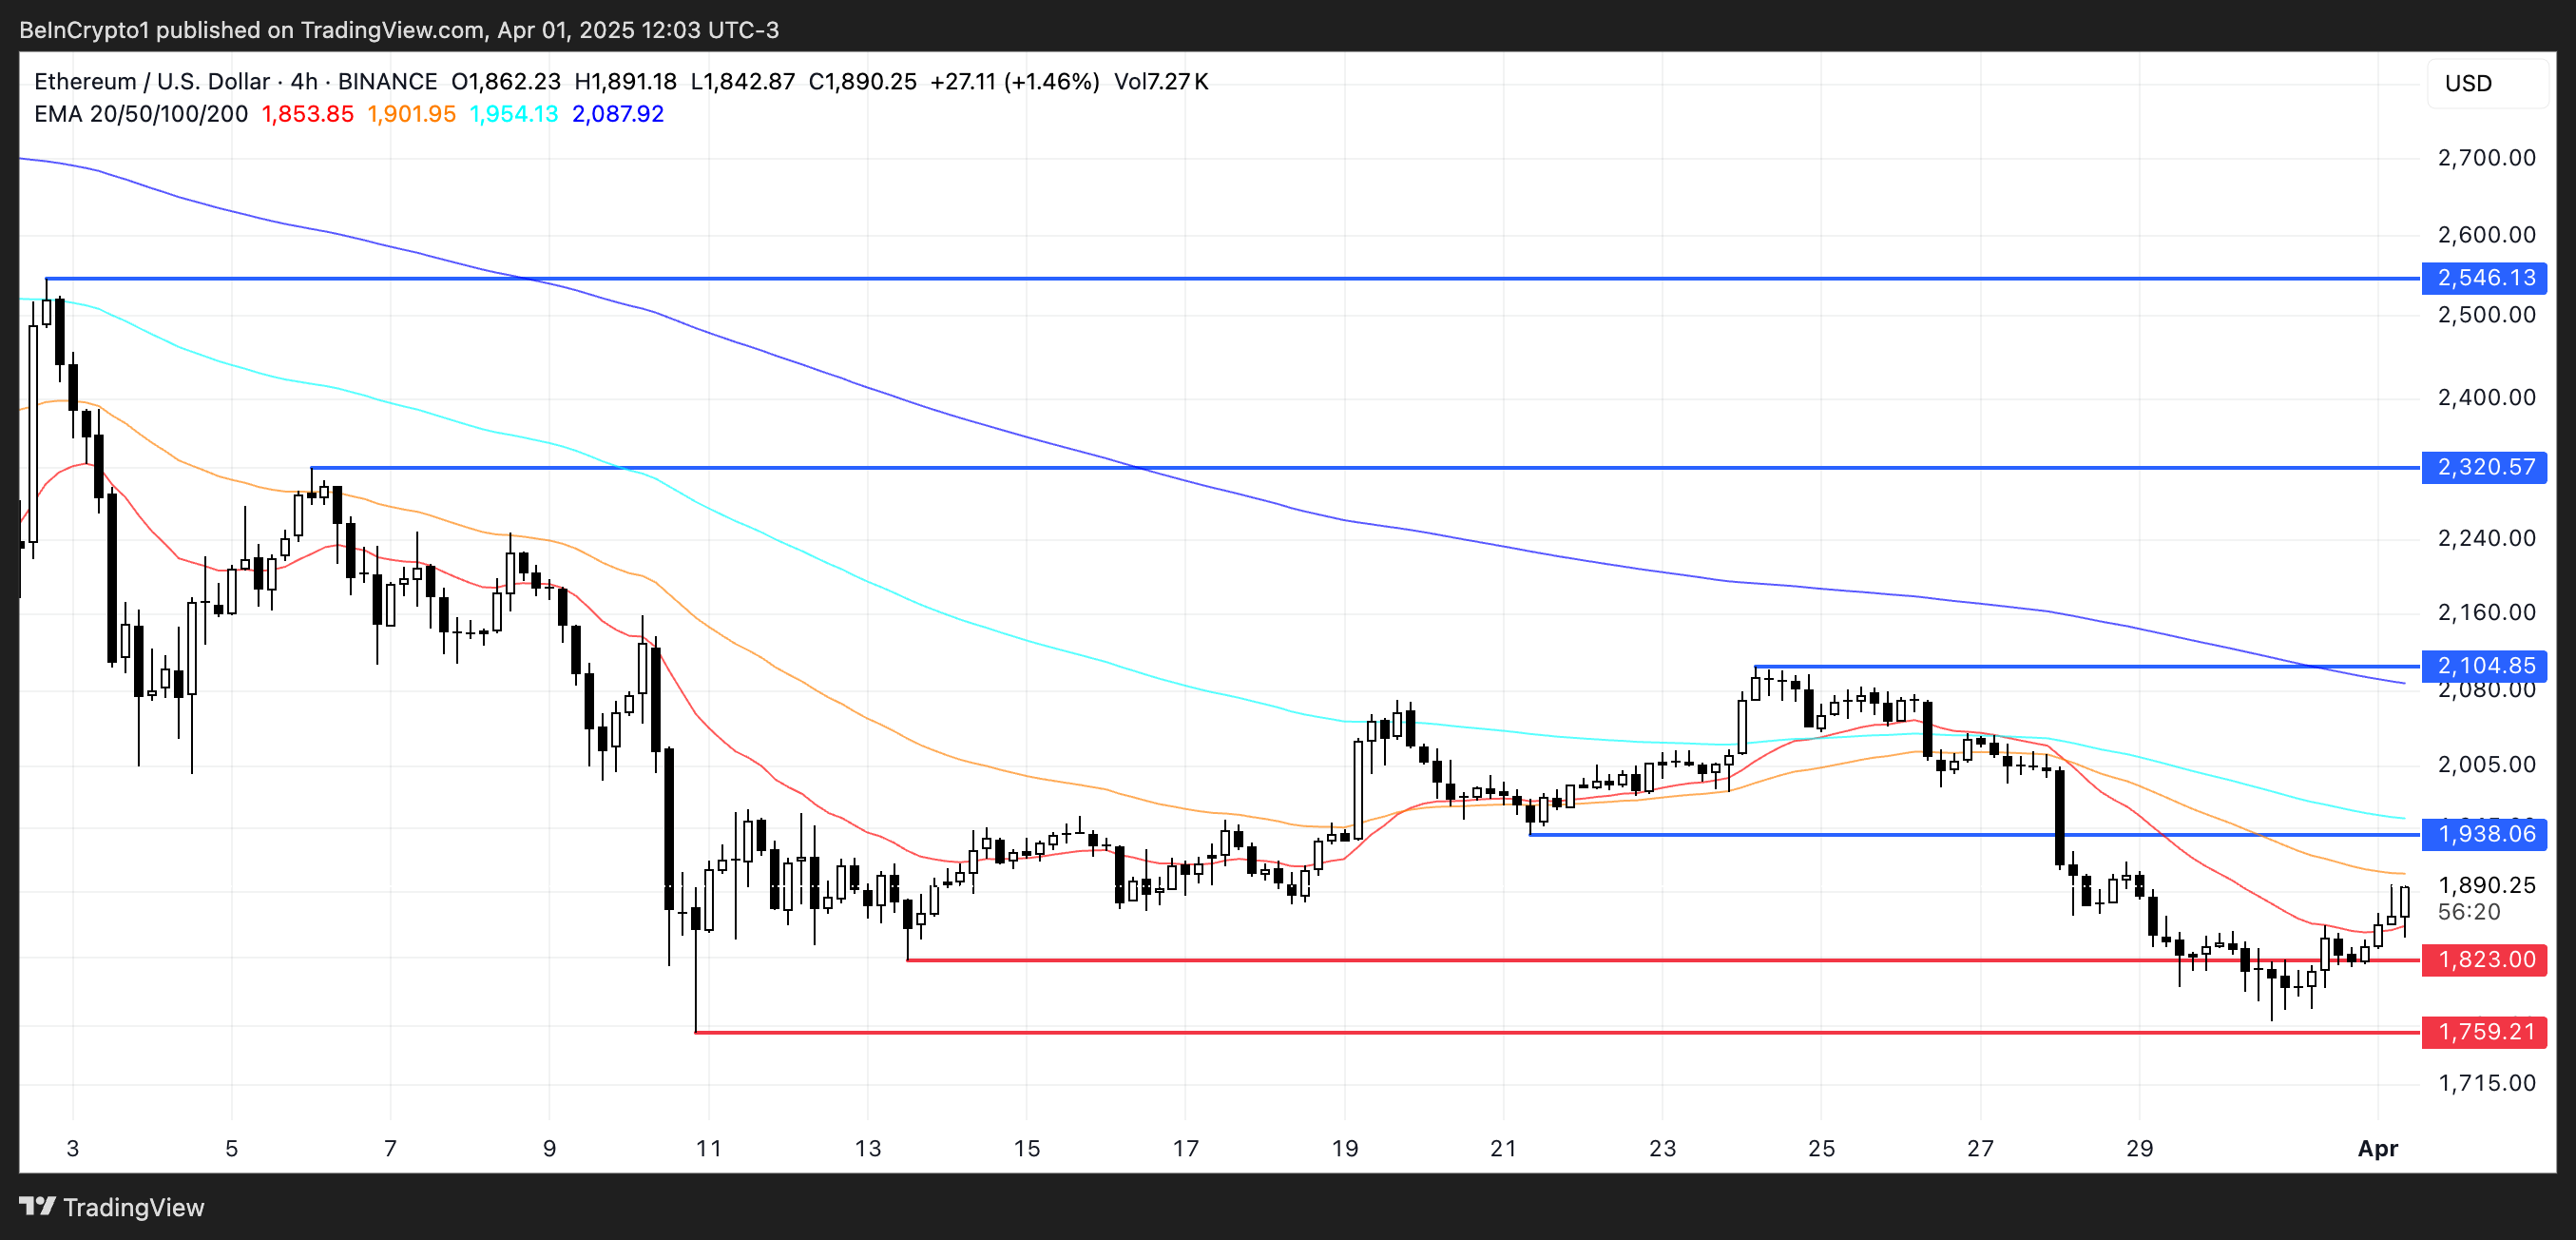
On the flip side, if Ethereum fails to maintain its upward push and bearish momentum resumes, the focus will shift back to downside levels.
The first key support sits at $1,823; a break below that could expose Ethereum to further losses toward $1,759.
Disclaimer
In line with the Trust Project guidelines, this price analysis article is for informational purposes only and should not be considered financial or investment advice. BeInCrypto is committed to accurate, unbiased reporting, but market conditions are subject to change without notice. Always conduct your own research and consult with a professional before making any financial decisions. Please note that our Terms and Conditions, Privacy Policy, and Disclaimers have been updated.
Market
Binance Megadrop Launches KernelDAO

Binance Megadrop has announced its fourth project – KernelDAO (KERNEL), a restaking protocol supporting three key tokens Kernel, Kelp, and Gain.
Introduced in 2024, Binance Megadrop is a token launch platform that provides users with early access to promising crypto projects before their official listing.
KernelDAO and Binance Megadrop: Overview
KernelDAO is a restaking protocol that allows users to repurpose staked assets (such as ETH or BNB) to participate in other protocols, maximizing yield. The protocol launched its mainnet in December 2024.
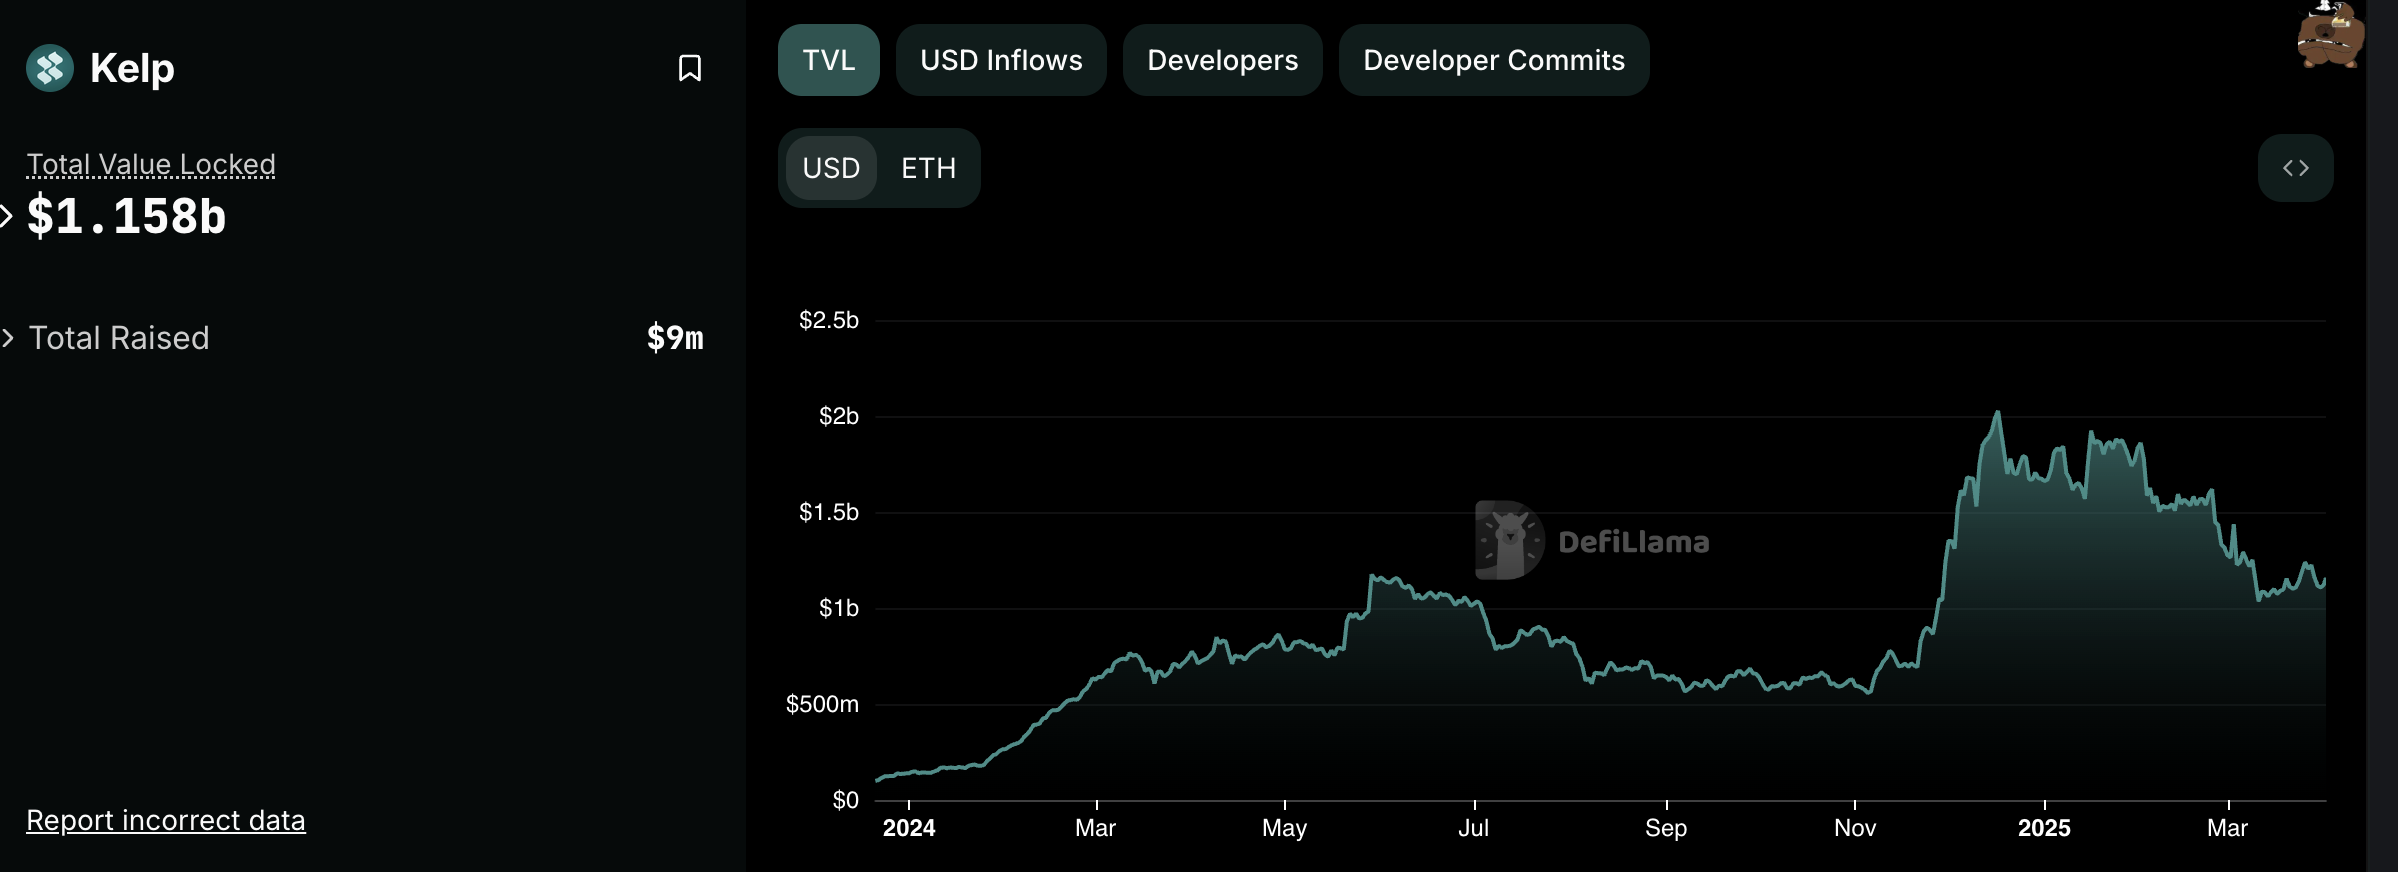
The KernelDAO Megadrop event kicks off on April 1, 2025, and lasts for 20 days, rewarding participants with KERNEL tokens. Kelp, a KernelDAO component, manages over $1.15 billion in Total Value Locked (TVL) across 10 blockchains, including Ethereum and BNB Chain.
KernelDAO has a maximum supply of 10 billion KERNEL tokens. Binance has allocated 40 million KERNEL (4% of the total supply) for participants. Upon listing on Binance, the initial circulating supply will be 162,317,496 KERNEL (16.23% of the total supply).
After the Megadrop event, KERNEL will be listed on Binance Spot with trading pairs such as KERNEL/BTC, KERNEL/USDT, and KERNEL/BNB.
KernelDAO is the fourth project on Binance Megadrop, following Lista (LISTA) and Xai (XAI). Previously, Binance Labs invested in Kernel to build recovery infrastructure on the BNB Chain.
Binance’s inclusion of KernelDAO could contribute to the growth of the restaking sector. According to DeFiLlama, the total TVL of restaking protocols surpassed $15 billion in early 2025, with EigenLayer and Kelp leading the market.
With 40 million KERNEL tokens distributed through Megadrop, many participants may sell immediately after receiving their tokens, potentially creating downward price pressure. Additionally, increasing competition from protocols like EigenLayer could pose challenges for KernelDAO.
Additionally, not all projects listed on Binance have performed impressively. In 2024, Binance-listed tokens all fell, with 29 out of 30 tokens posting significant losses.
Disclaimer
In adherence to the Trust Project guidelines, BeInCrypto is committed to unbiased, transparent reporting. This news article aims to provide accurate, timely information. However, readers are advised to verify facts independently and consult with a professional before making any decisions based on this content. Please note that our Terms and Conditions, Privacy Policy, and Disclaimers have been updated.
Market
Wintermute Sells ACT Tokens Due To Binance Limit Changes

Market maker Wintermute sold off huge quantities of ACT and other BNB meme coins on April 1, tanking their prices by as much as 50%. Wintermute CEO denied intentionally selling these assets and started re-buying them.
Community sleuths believe that Binance is to blame, quietly lowering the leverage position limit for ACT and other tokens. This incident may cause further mistrust and uncertainty in a shaky meme coin market.
Why Did Wintermute Sell ACT?
A chaotic incident is currently unfolding in the meme coin sector. At the center of the story is Wintermute, a market maker that recently made headlines by interacting with World Liberty’s USD1 stablecoin before the official announcement.
Today, Wintermute has sold off large quantities of BNB meme coins, especially ACT.
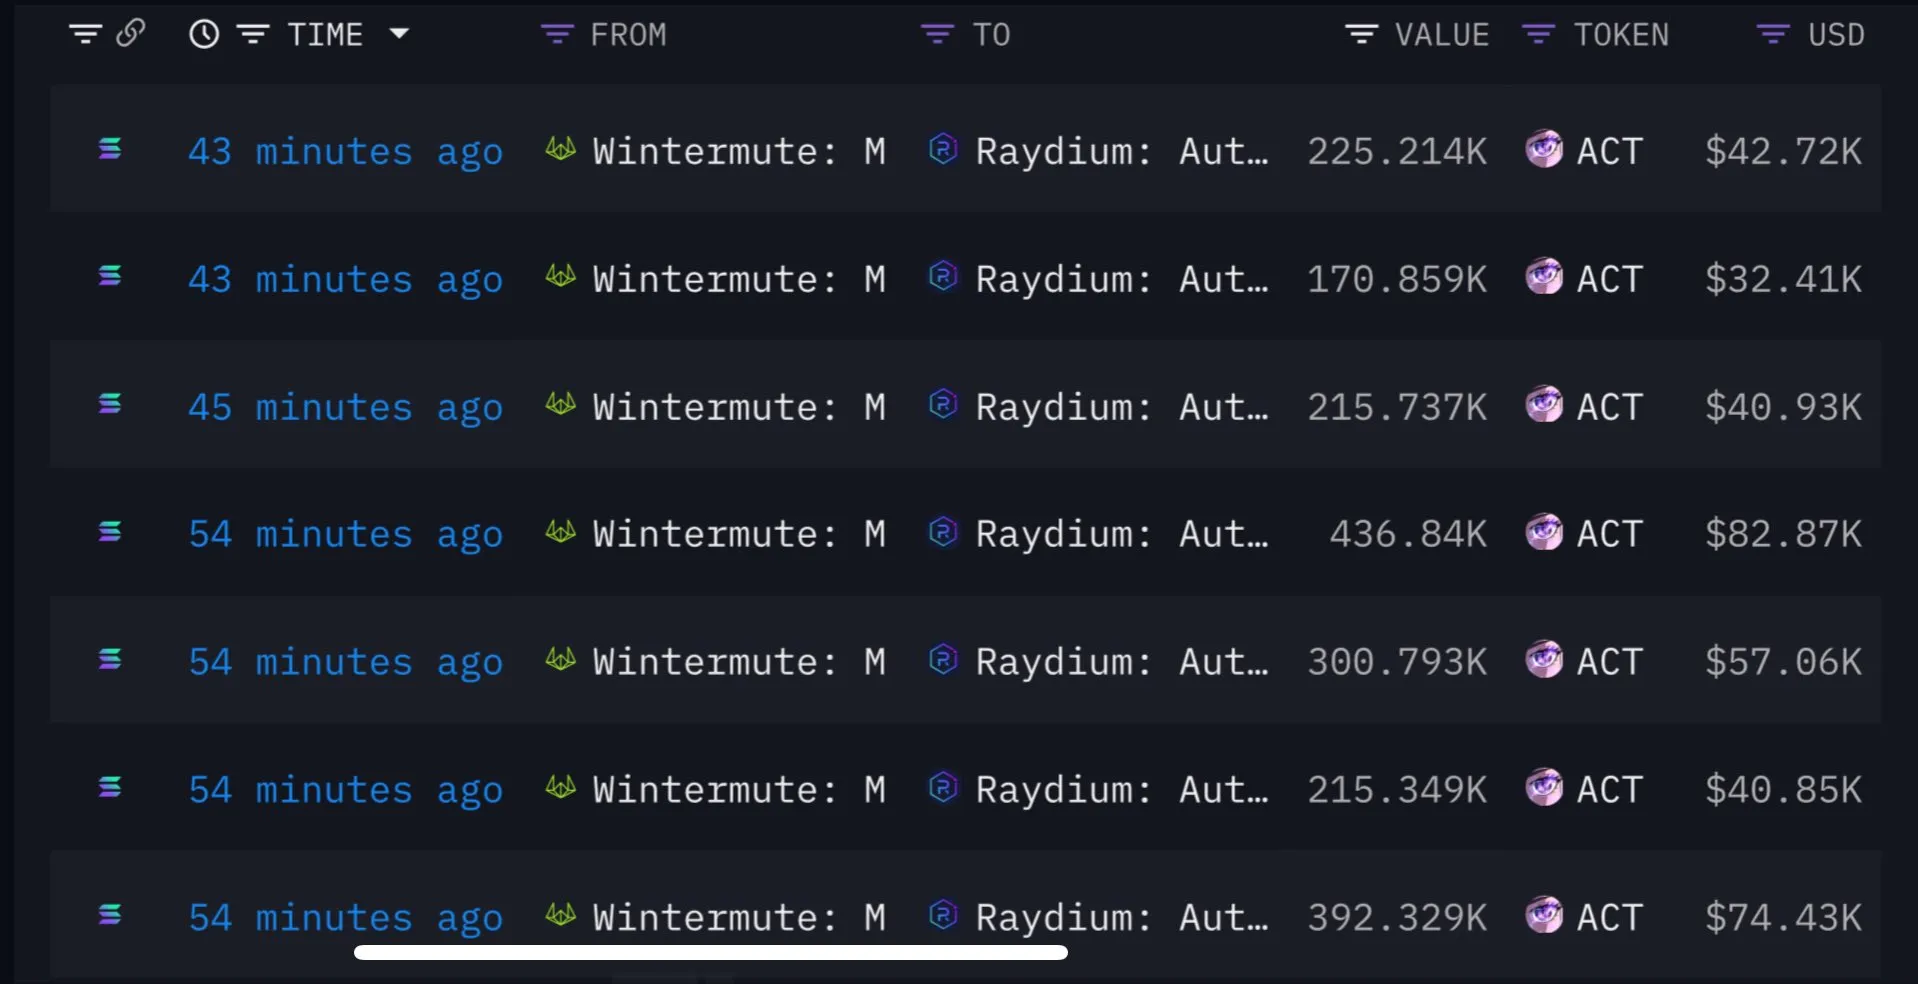
After Wintermute’s massive sell-off, the price of ACT subsequently fell 50%. This caused a stampede in other BNB meme coins, erasing millions of dollars and generating a lot of market chaos.
However, in a strange development, Wintermute’s CEO Evgeny Gaevoy denied deliberately causing the sale.
“Not us, for what it’s worth! [I’m] also curious about that postmortem. If I were to guess, we reacted post move, arbitraged the Automated Market Maker (AMM) Pool,” Gaevoy claimed in a social media thread.
This raised more questions than it answered. If Wintermute didn’t intend to sell off these ACT tokens and other meme coins, what triggered them? The firm even began buying ACT again after the sale. Subsequently, crypto sleuths started suspecting a quiet rule change from Binance, the world’s largest crypto exchange.
Both data from Lookonchain and analysis from 0xwizard, an important community leader for ACT, alleged that Binance was involved in the Wintermute debacle. Specifically, they claimed that the exchange quietly lowered the leverage position limit for ACT. This meant that market makers who held more positions than this limit were automatically liquidated at market price.
Naturally, these allegations caused a lot of outrage. Yi He, co-founder of Binance, responded, claiming that the relevant team is “collecting details and preparing a reply.” She further said that there might be another player involved but didn’t elaborate on this. This is not her first time responding to major criticism about Binance’s meme coin policies.
Ultimately, the dust is far from settled on this issue. Most of the impacted tokens are still substantially down from their positions yesterday, which is unfortunate in this fearful market. Between HyperLiquid’s short squeeze last week and this incident with Wintermute and ACT, overreach from crypto exchanges could damage market confidence.
Disclaimer
In adherence to the Trust Project guidelines, BeInCrypto is committed to unbiased, transparent reporting. This news article aims to provide accurate, timely information. However, readers are advised to verify facts independently and consult with a professional before making any decisions based on this content. Please note that our Terms and Conditions, Privacy Policy, and Disclaimers have been updated.
-

 Market21 hours ago
Coinbase Tries to Resume Lawsuit Against the FDIC
-

 Altcoin21 hours ago
Charles Hoskinson Reveals How Cardano Will Boost Bitcoin’s Adoption
-

 Market20 hours ago
Hedera (HBAR) Bears Dominate, HBAR Eyes Key $0.15 Level
-

 Ethereum23 hours ago
Ethereum May Have To Undo This Death Cross For Bull’s Return
-

 Market22 hours ago
BlackRock’s Larry Fink Thinks Crypto Could Harm The Dollar
-

 Market19 hours ago
This is Why PumpSwap Brings Pump.fun To the Next Level
-

 Market18 hours ago
Cardano (ADA) Whales Hit 2-Year Low as Key Support Retested
-
 Market23 hours ago
XRP Bears Lead, But Bulls Protect Key Price Zone


