
Bitcoin
First Outflows Hit BlackRock’s Bitcoin ETF: What It Means
BlackRock’s iShares Bitcoin Trust (IBIT) experienced its first-ever outflow day, with $36.9 million leaving the fund on May 1.
This notable outflow broke a 77-day streak of stable or positive net flows, raising eyebrows among investors and analysts alike.
Spot Bitcoin ETFs Experience Record Outflows
This shift comes at a time when the broader US spot Bitcoin exchange-traded funds (ETFs) have also witnessed record net outflows. The outflows sum up to $563.7 million across various funds on May 1.
Among these, the Fidelity Wise Origin Bitcoin Fund (FBTC) reported the largest single-day loss with $191.1 million, followed closely by the Grayscale Bitcoin Trust (GBTC), which saw $167.4 million exit its coffers.
Read more: How To Trade a Bitcoin ETF: A Step-by-Step Approach
| Date | IBIT | FBTC | BITB | ARKB | BTCO | EZBC | BRRR | HODL | BTCW | GBTC | DEFI | Total |
|---|---|---|---|---|---|---|---|---|---|---|---|---|
| April 24, 2024 | 0.0 | 5.6 | 0.0 | 4.2 | 0.0 | 0.0 | 0.0 | 0.0 | 0.0 | -130.4 | 0.0 | -120.6 |
| April 25, 2024 | 0.0 | -22.6 | -6.0 | -31.3 | 0.0 | 1.9 | -20.2 | 0.0 | 0.0 | -139.4 | 0.0 | -217.6 |
| April 26, 2024 | 0.0 | -2.8 | -3.8 | 5.4 | 0.0 | 0.0 | 0.0 | 0.0 | 0.0 | -82.4 | 0.0 | -83.6 |
| April 29, 2024 | 0.0 | -6.9 | 6.8 | -31.3 | 0.0 | 1.8 | 2.7 | 0.0 | 0.0 | -24.7 | 0.0 | -51.6 |
| April 30, 2024 | 0.0 | -35.3 | -34.3 | 3.6 | -2.4 | 0.0 | 0.0 | 0.0 | 0.0 | -93.2 | 0.0 | -161.6 |
| 01 May 2024 | -36.9 | -191.1 | -29.0 | -98.1 | -5.4 | -13.4 | -9.7 | -6.5 | -6.2 | -167.4 | 0.0 | -563.7 |
Despite these significant movements, experts like James Seyffart, a Bloomberg ETF analyst, reassure investors.
“These ETFs are operating smoothly across the board. Inflows and outflows are part of the norm in the life of an ETF,” Seyffart said.
Additionally, cryptocurrency enthusiasts continue to debate the impact of ETF flows on Bitcoin’s price. Coosh Alemzadeh, a noted Bitcoin investor, argues that the influence of Bitcoin ETFs on market trends is overstated.
“Bitcoin ETFs are more of a narrative IMO and have less impact on trend than people think.Solana has had “zero” ETF flows and yet has outperformed Bitcoin,” Alemzadeh wrote.
The outflows from ETFs coincided with a dip in Bitcoin’s price, which fell below $57,000 for the first time since February. BeInCrypto reported that this downturn is due to a decrease in demand among crypto whales and spot Bitcoin ETFs.
The current price of Bitcoin is situated below the short-term holders’ realized price, which lies around $63,000. Traders use this metric to gauge the cost basis of short-term holders’ purchases.
On-chain analysis platform CryptoQuant suggests that Bitcoin’s price might soon find a floor.
“The $55,000 to $57,000 level is 10% below the current realized price of short-term holders, which has historically acted as the ultimate support during bull markets,” the firm explained.
Read more: Bitcoin Price Prediction 2024/2025/2030
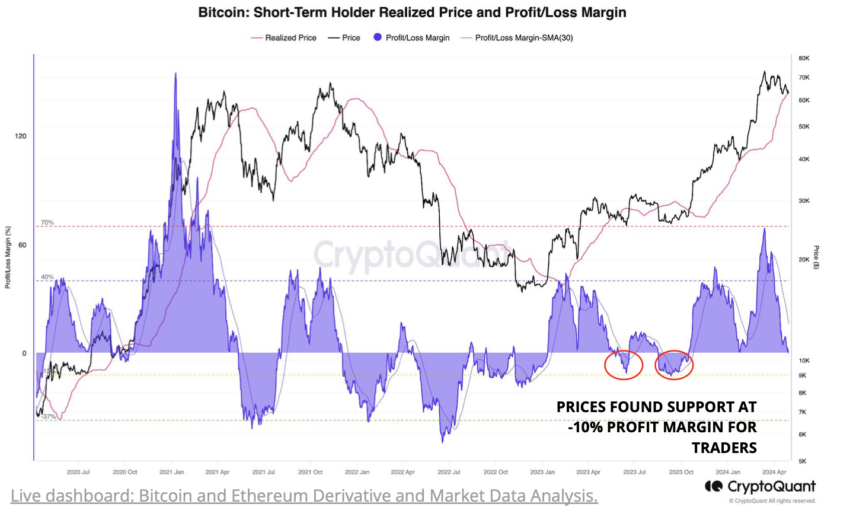
This insight indicates that the price might rebound in the short term unless the market shifts into an extensive downtrend.
Disclaimer
In adherence to the Trust Project guidelines, BeInCrypto is committed to unbiased, transparent reporting. This news article aims to provide accurate, timely information. However, readers are advised to verify facts independently and consult with a professional before making any decisions based on this content. Please note that our Terms and Conditions, Privacy Policy, and Disclaimers have been updated.


Amid mounting economic challenges and a growing pile of confiscated cryptocurrencies, local governments in China are increasingly liquidating seized digital assets to bolster strained public finances.
The practice raises legal and regulatory questions, especially concerning China’s blanket ban on crypto trading.
China Selling Seized Crypto To Bolster Treasury
China reportedly held around 15,000 Bitcoin (BTC) worth $1.4 billion by the end of 2024. According to River, a Bitcoin investment firm, this places the country among the top 15 global holders of the asset.
However, reports suggest China’s local governments are offloading digital currencies through private firms despite the national crypto ban.
Cas Abbe, a Web3 growth manager, and Binance exchange affiliate, noted on X that the dump in crypto prices may partly stem from these offloading activities.
“Local governments in China are selling seized crypto to top up their treasury. Despite the crypto trading ban in China, local governments are using private companies to offload their holdings. This explains pretty much the dump even before tariff news hit the market,” Abbe noted.
The surge in liquidations comes as authorities grapple with inconsistent policies for handling crypto seized from criminal investigations, which spiked sharply in 2023.
Over $59 billion was tied to crypto-related crimes in China that year. Blockchain security firm SAFEIS reported that more than 3,000 people were prosecuted for offenses ranging from internet fraud to illegal gambling.
Despite Beijing’s ban, local governments have reportedly turned to private firms to offload confiscated tokens. Specifically, they are converting them into cash to fund their treasuries.
Jiafenxiang, a Shenzhen-based technology firm, has sold more than 3 billion yuan ($414 million) worth of digital assets in offshore markets since 2018. Documents reviewed by Reuters link the company to liquidation deals with local authorities in Xuzhou, Hua’an, and Taizhou.
Though practical for cash-strapped regions, the process is legal gray territory. Such practices risk undermining the country’s crypto enforcement regime without clear regulatory frameworks.
“This raises so many questions about transparency. How are they even doing this legally?” noted one analyst in a post.
Experts are now calling for urgent regulatory reforms. These include judicial recognition of crypto as assets and the creation of standardized disposal mechanisms.
Some are even floating the idea of building a centralized national crypto reserve. This mirrors Trump’s administration’s proposals to manage seized assets more strategically.
Disclaimer
In adherence to the Trust Project guidelines, BeInCrypto is committed to unbiased, transparent reporting. This news article aims to provide accurate, timely information. However, readers are advised to verify facts independently and consult with a professional before making any decisions based on this content. Please note that our Terms and Conditions, Privacy Policy, and Disclaimers have been updated.
Matthew Sigel, Head of Digital Assets Research at VanEck, has proposed a new financial instrument, “BitBonds,” to help manage the US government’s looming $14 trillion refinancing debt requirement.
The 10-year financial instrument combines traditional US Treasury bonds with Bitcoin (BTC) exposure. This offers a potential solution to the nation’s fiscal concerns.
Can Bitcoin-Backed Bonds Help Solve the US Debt Crisis?
According to Sigel’s proposal, BitBonds’ investment structure allocates 90% of the funds to low-risk US Treasury securities and 10% to Bitcoin, combining stability with the potential for higher returns. Additionally, the government would purchase Bitcoin with proceeds from the bond sale.
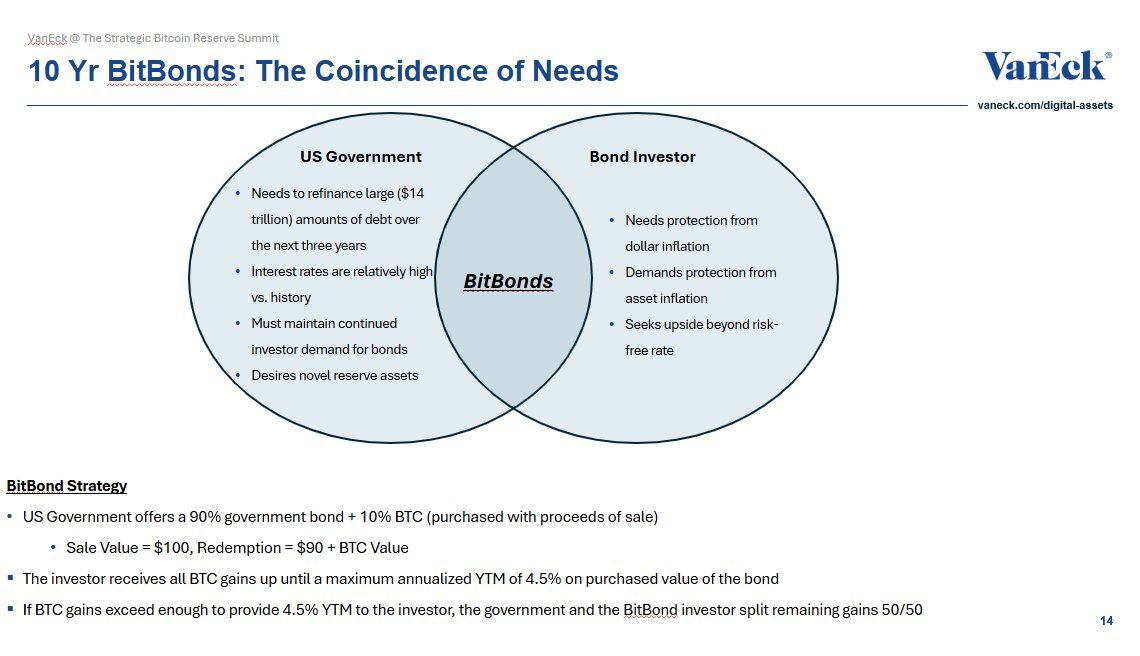
Investors would receive all Bitcoin gains up to a maximum annualized yield-to-maturity of 4.5%. Furthermore, the investor and the government would split any additional gains equally.
“An aligned solution for mismatched incentives,” Sigel remarked.
From an investor perspective, Sigel highlighted that the bond offers a breakeven Bitcoin compound annual growth rate (CAGR) between 8% and 17%, depending on the coupon rate. Additionally, investors’ returns could skyrocket if Bitcoin grows at a 30%–50% CAGR.
“A convex bet—if you believe in Bitcoin,” he added.
However, the structure is not without risks: investors bear Bitcoin’s downside while only partially participating in its upside. Lower-coupon bonds may lose appeal if Bitcoin underperforms.
Meanwhile, the Treasury’s downside is limited. Even a complete collapse of Bitcoin’s value would still result in cost savings compared to traditional bond issuance. Yet, this is contingent on the coupon remaining below the breakeven threshold.
“BTC upside just sweetens the deal. Worst case: cheap funding. Best case: long-vol exposure to the hardest asset on Earth,” Sigel stated.
Sigel claimed that this hybrid approach aligns the interests of the government and investors over a 10-year period. The government faces high interest rates and significant debt refinancing needs. Meanwhile, investors seek protection from inflation and asset debasement.
The proposal comes amid growing concerns over the US debt crisis, exacerbated by the recent increase in the debt ceiling to $36.2 trillion, as reported by BeInCrypto. Notably, the Bitcoin Policy Institute (BPI) has also endorsed the concept.
“Building on President Donald J. Trump’s March 6, 2025, Executive Order establishing the Strategic Bitcoin Reserve, this white paper proposes that the United States adopt Bitcoin-Enhanced US Treasury Bonds (“₿ Bonds” or “BitBonds”) as an innovative fiscal tool to address multiple critical objectives,” the brief read.
In the paper, co-authors Andrew Hohns and Matthew Pines suggested that issuing $2 trillion in BitBonds at a 1% interest rate could cover 20% of the Treasury’s 2025 refinancing needs.
“Over a ten-year period, this represents nominal savings of $700 billion and a present value of $554.4 billion,” the authors wrote.
BPI estimates that if Bitcoin achieves a CAGR of 36.6%, the upside could potentially defease up to $50.8 trillion of federal debt by 2045.
These recommendations are part of broader conversations regarding Bitcoin’s potential impact on national finance. Previously, Senator Cynthia Lummis argued that a US Strategic Bitcoin Reserve could halve the national debt. In fact, VanEck’s analysis indicated that such a reserve could help reduce $21 trillion of debt by 2049.
Disclaimer
In adherence to the Trust Project guidelines, BeInCrypto is committed to unbiased, transparent reporting. This news article aims to provide accurate, timely information. However, readers are advised to verify facts independently and consult with a professional before making any decisions based on this content. Please note that our Terms and Conditions, Privacy Policy, and Disclaimers have been updated.

Public companies have added nearly 100,000 Bitcoin to their balance sheets during the first quarter of 2025, pushing total corporate Bitcoin holdings to a staggering 688,000 BTC worth $56.7 billion. According to data from crypto fund issuer Bitwise, this represents a 16% increase in total crypto holdings by publicly traded companies.
12 New Corporate Buyers Enter The Market
The Bitcoin buying spree wasn’t limited to existing crypto investors. Twelve public companies purchased Bitcoin for the first time during Q1, bringing the total number of Bitcoin-holding public firms to 79.
Hong Kong construction firm Ming Shing led new buyers, with its subsidiary Lead Benefit acquiring 833 BTC through two separate purchases – an initial 500 BTC buy in January followed by 333 BTC in February.
Video platform Rumble ranked as the second-largest new buyer, adding 188 BTC to its treasury in mid-March. In a move that stunned market watchers, Hong Kong investment firm HK Asia Holdings Limited purchased just one Bitcoin in February – a modest investment that still caused its share price to almost double in a single day of trading.
Companies are buying bitcoin, Q1 2025 edition. pic.twitter.com/qZc62N8vu5
— Bitwise (@BitwiseInvest) April 14, 2025
Japanese Firm Acquires At A Discount
While new entrants made headlines, existing Bitcoin holders also strengthened their positions. Japanese investment firm Metaplanet announced on April 14 that it had purchased an additional 319 BTC at an average price of 11.8 million yen (about $82,770) per coin.
This latest purchase brings Metaplanet’s total Bitcoin holdings to 4,525 BTC, currently valued at approximately $383.2 million. The company has spent nearly $406 million (58.145 billion yen) building its crypto stack.
Based on current holdings, Metaplanet now ranks as the 10th largest public company crypto holder worldwide, sitting behind Jack Dorsey’s Block, Inc., which holds 8,480 BTC.
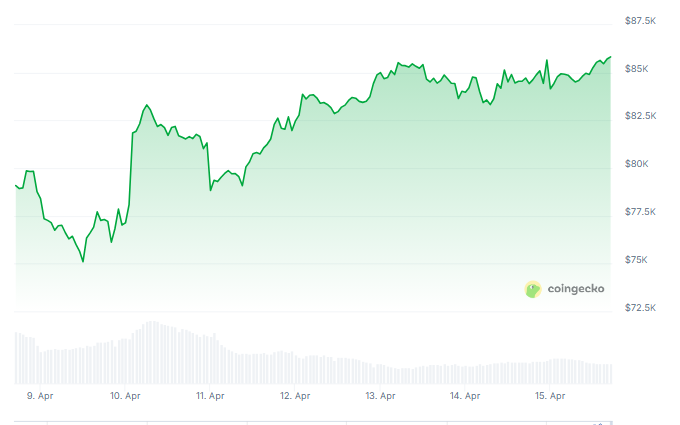
BTC reclaiming the green zone in the last week. Source: Coingecko
Bitcoin Price Recovers After Brief Slump
Bitcoin trades at around $85,787 as of April 15, showing a decent performance over the past 24 hours according to CoinGecko data. The cryptocurrency has gained roughly 2.5% since the end of Q1 on March 31.
The price has bounced back from a brief drop below $75,000 on April 7. That temporary decline came after a broader market selloff triggered by a new round of global tariffs announced by US President Donald Trump.
The growing corporate interest in the top crypto comes as more companies look to diversify their treasury holdings. The combined value of public companies’ Bitcoin rose about 2.3% during the first quarter, reaching nearly $57 billion with BTC priced at $82,400 by quarter’s end.
Featured image from Crews Bank, chart from TradingView
Editorial Process for bitcoinist is centered on delivering thoroughly researched, accurate, and unbiased content. We uphold strict sourcing standards, and each page undergoes diligent review by our team of top technology experts and seasoned editors. This process ensures the integrity, relevance, and value of our content for our readers.

Did Ethereum Survive The Storm? Analyst Eyes Breakout Next
Bitcoin & Others Slip As Trump Imposes Up To 245% Tariff On China

Semler Doubles Down on Bitcoin Investments Despite Losses

China Liquidates Seized Crypto to Boost Struggling Treasury
Expert Reveals Current Status Of 9 Ripple ETFs

Cardano (ADA) Pressure Mounts—More Downside on the Horizon?

2.52 Million Altcoins Are Ruining Crypto’s Future

Animoca Brands Valuation Tanks 75% In Two Years, Here’s Why

Crypto exchange BingX hacked for $43 million

Are The Big Players Losing Interest?

Hong Kong’s Securities Association Tips Authorities On Crypto Self-Regulation

Coinbase cbBTC Set to go Live on Solana
2.52 Million Altcoins Are Ruining Crypto’s Future
Animoca Brands Valuation Tanks 75% In Two Years, Here’s Why
Crypto exchange BingX hacked for $43 million
Are The Big Players Losing Interest?
Hong Kong’s Securities Association Tips Authorities On Crypto Self-Regulation
Coinbase cbBTC Set to go Live on Solana
-

 Market23 hours ago
Can Pi Network Avoid a Similar Fate?
-

 Altcoin18 hours ago
Whispers Of Insider Selling As Mantra DAO Relocates Nearly $27 Million In OM To Binance
-

 Market17 hours ago
Trump Family Plans Crypto Game Inspired by Monopoly
-
 Altcoin23 hours ago
Binance Delists This Crypto Causing 40% Price Crash, Here’s All
-

 Market22 hours ago
Ethereum Price Consolidation Hints at Strength—Is a Move Higher Coming?
-

 Bitcoin23 hours ago
Bolivia Reverses Crypto-for-Fuel Plan Amid Energy Crisis
-

 Market21 hours ago
Pi Network Price Rise To $1 is Now In The Hands Of Bitcoin
-

 Market18 hours ago
Forget XRP At $3, Analyst Reveals How High Price Will Be In A Few Months
