
Market
MANTRA’s OM Token Crashes 90% Amid Insider Dump Allegations

The MANTRA (OM) token suffered a catastrophic price collapse on April 13, plummeting over 90% in under an hour and wiping out more than $5.5 billion in market capitalization.
The sudden crash, which took OM from a high of $6.33 to below $0.50, has drawn comparisons to the infamous Terra LUNA meltdown, with thousands of holders reportedly losing millions.
Why did MANTRA (OM) Crash?
Multiple reports suggest that the trigger is a large token deposit linked to a wallet allegedly associated with the MANTRA team. Onchain data shows a deposit of 3.9 million OM tokens to OKX, sparking concerns about a possible incoming sell-off.
Given that the MANTRA team reportedly controls close to 90% of the token’s total supply, the move raised immediate red flags about potential insider activity and price manipulation.

The OM community has long expressed concerns around transparency. Allegations have surfaced over the past year suggesting the team manipulated the token’s price through market makers, changed tokenomics, and repeatedly delayed a community airdrop.
When the OKX deposit was spotted, fears that insiders might be preparing to offload were amplified.
Reports also indicate that MANTRA may have engaged in undisclosed over-the-counter (OTC) deals, selling tokens at steep discounts — in some cases at 50% below market value.
As OM’s price rapidly declined, these OTC investors were thrown into losses, which allegedly sparked a mass exodus as panic selling took hold. The chain reaction triggered stop-loss orders and forced liquidations on leveraged positions, compounding the collapse.
The MANTRA team has denied all allegations of a rug pull and maintains that its members did not initiate the sell-off.
In a public statement, co-founder John Patrick Mullin said the team is investigating what went wrong and is committed to finding a resolution.
The project’s official Telegram channel was locked during the fallout, which added to community frustration and speculation.
“We have determined that the OM market movements were triggered by reckless forced closures initiated by centralized exchanges on OM account holders. The timing and depth of the crash suggest that a very sudden closure of account positions was initiated without sufficient warning or notice,” wrote MANTRA founder JP Mullin.
If OM fails to recover, this would mark one of the largest collapses in crypto history since the Terra LUNA crash in 2022.
Thousands of affected holders are now demanding transparency and accountability from the MANTRA team, while the broader crypto community watches closely for answers.
Disclaimer
In adherence to the Trust Project guidelines, BeInCrypto is committed to unbiased, transparent reporting. This news article aims to provide accurate, timely information. However, readers are advised to verify facts independently and consult with a professional before making any decisions based on this content. Please note that our Terms and Conditions, Privacy Policy, and Disclaimers have been updated.


Hedera (HBAR) is up more than 5% in the last 24 hours, showing signs of short-term relief after a rough start to April.
Despite the bounce, technical indicators still point to a weak overall trend, with bearish EMA alignment and a flat ADX reading. Momentum remains uncertain, but bulls have managed to defend key support levels so far.
Hedera Shows Early Signs of Bullish Shift, But Trend Still Weak
Hedera’s DMI indicator shows its ADX at 19.8—slightly up from 18.49 two days ago but down from a recent high of 21.94 earlier today.
The ADX (Average Directional Index) measures the strength of a trend, regardless of its direction. Values below 20 typically indicate a weak or consolidating market, while readings above 25 suggest a strong trend is developing.
HBAR’s current ADX near 20 suggests momentum is still relatively soft, with no clear directional strength in place.

Looking at the directional indicators, the +DI (Directional Indicator) has risen from 13.42 to 14.2, showing a slight increase in bullish pressure. Meanwhile, the -DI has declined from 19.89 to 17.15, indicating weakening bearish momentum.
This narrowing gap between +DI and -DI may signal a potential shift in favor of the bulls, but with ADX still under 25, the trend remains unconfirmed.
If +DI continues to climb and crosses above -DI, Hedera could attempt a short-term reversal—but for now, the market remains in a cautious, sideways phase.
HBAR Enters Cloud Zone as Trend Momentum Stalls
The Ichimoku Cloud chart for HBAR reflects a mostly neutral to slightly bearish trend.
The price is currently trading below the Kijun-sen (red line) and very close to the Tenkan-sen (blue line), indicating weak short-term momentum and a lack of clear direction.
Both lines are flat, which often signals consolidation and market indecision.

Looking ahead, the Kumo (cloud) is relatively thick and bearish, with the Senkou Span A below the Senkou Span B. However, price action has entered the cloud zone, suggesting possible trend exhaustion or transition.
The Chikou Span (lagging green line) is overlapping with recent price candles, reinforcing the sideways outlook.
Unless HBAR breaks cleanly above the cloud and reclaims the Kijun-sen, the market is likely to remain in a holding pattern.
Hedera Holds Key Supports, But Bearishness Still Lingers
Hedera’s EMA lines are currently showing a bearish structure, with short-term averages positioned below the long-term ones—typically a sign of ongoing downward momentum.
Despite this, HBAR price has recently tested and held support at both $0.156 and $0.153, signaling that buyers are still defending key levels. If the trend reverses from here, HBAR could begin a recovery move, first targeting resistance at $0.168.
A break above that level could open the path to $0.178, and if bullish momentum strengthens further, a move toward $0.201 could follow.

On the flip side, if selling pressure resumes, Hedera could retest the same support zones at $0.156 and $0.153.
Losing these levels would weaken the technical structure significantly and could trigger a deeper drop.
In that case, the next major support comes all the way down near $0.124, which would represent a substantial decline and reinforce the current bearish trend.
Disclaimer
In line with the Trust Project guidelines, this price analysis article is for informational purposes only and should not be considered financial or investment advice. BeInCrypto is committed to accurate, unbiased reporting, but market conditions are subject to change without notice. Always conduct your own research and consult with a professional before making any financial decisions. Please note that our Terms and Conditions, Privacy Policy, and Disclaimers have been updated.

The recent OM collapse at MANTRA has left the community confused. In a series of instant drops, $5.5 billion was erased. According to several analyses, the incident was caused by one trader manipulating two exchanges.
This whole incident highlights the fragility of many token projects. Despite an ostensibly huge market cap, a comparatively tiny amount of liquidity triggered a complete collapse.
Exploring the OM Crash
When MANTRA’s OM token collapsed earlier this week, it left a huge number of unanswered questions. It sparked allegations of foul play, and rumors of insider activity have dogged the company since.
According to a new analysis, the initial trigger of the OM crash was a single trader:
“This was due to an entity(s) on Binance perpetuals market. That’s what triggered the entire cascade. The initial drop below $5 was triggered by a ~1 million USD short position being market sold. This caused over 5% of slippage in literal microseconds. That was the trigger. This seems intentional to me. They knew what they were doing,” he stated.
After triggering this initial anomaly, this OM trader continued dumping short positions at five-second intervals, which powered the overall crash. As these continual dumps continued on Binance, the OKX spot market saw a discount of nearly 20%.

The Seller Finds Exit Liquidity
This strange behavior on OKX was caused by a massive whale. A limit sell order allows the seller to specify the minimum price they are willing to sell a crypto asset for. The order will only execute if the market price reaches or exceeds the limit price. Until then, the order remains open in the order book.
This person single-handedly kept the price fixed on OKX for over a minute, causing market makers and arbitrage bots to buy the assets despite panic selling in the broader market. By this method, the perpetrator was able to dump OM tokens while the crash was underway.
The issue, then, is not that OM fell because of a nefarious actor trying to engineer a crash. Instead, the problem is that a single entity could manipulate the markets so thoroughly.
For an attack like this to work, OM’s ostensible market cap had to be substantially more fragile than anticipated.
In other words, even though OM’s market cap was theoretically very high, it took a comparatively small investment to crash the RWA token like a house of cards. Some have even speculated that this trader wasn’t even trying to cause a crisis.
Rather, they may have been investors who were forced to sell due to loan terms or risk limits. Some slight manipulation could’ve led to a larger catastrophe.
Disclaimer
In adherence to the Trust Project guidelines, BeInCrypto is committed to unbiased, transparent reporting. This news article aims to provide accurate, timely information. However, readers are advised to verify facts independently and consult with a professional before making any decisions based on this content. Please note that our Terms and Conditions, Privacy Policy, and Disclaimers have been updated.

Despite regulatory hurdles and listing concerns, a new report from TokenInsight shows that Binance is comfortably leading the CEX market. Increasing competition from MEXC and Bitget saw Binance’s market share drop 1%, but it still dominates more than one-third of the CEX trades.
The firm dominates in every metric that the report examined, from market share to public notoriety. It leads both in spot and derivatives trading volume and maintains the most stable ratio between the two of any CEX.
Binance is Winning the CEX Race By a Mile
Binance suffered a few setbacks in this period, but it still comfortably leads the CEX market in a few key areas. Its token listings are not performing like they used to, prompting community backlash, and its potential ties with the Trump family are also raising concerns.
However, the exchange had a strong Q1 2025, as its trading volume continued to dominate one-third of the CEX market.
“Binance maintained its market-leading position in both quarters, with a trading volume of $9.95 trillion in Q4 2024. Due to market volatility, its trading volume in Q1 2025 was approximately $8.39 trillion. Binance continued to lead in market share, holding 36.5% in Q1 2025,” the report claimed.
In terms of total market share, Binance isn’t completely surpassing the CEX market. In fact, its control actually decreased by 1.38%.
No other exchange saw this level of decline, as Bybit only lost 0.89% after the infamous hack. Nonetheless, most of the biggest CEXs also declined slightly, and none of the growing exchanges managed to compete with its head start.
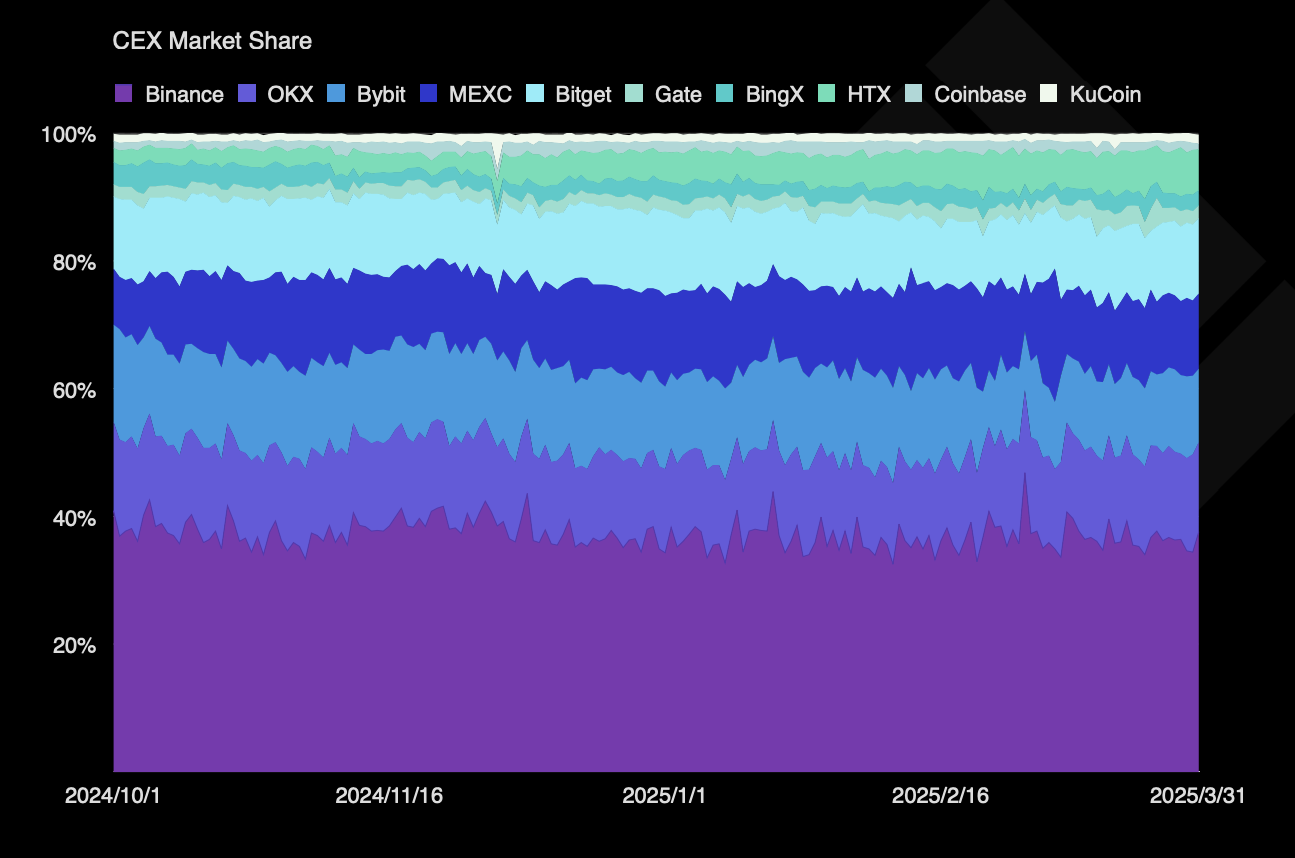
Binance accounts for nearly 36% of the CEX market share, but this isn’t its only advantage. It also leads in both spot trading and derivatives volumes, controlling 45% of the former and maintaining a 17% lead with the latter.
Additionally, TokenInsight determined that it had the most stable platform structure, keeping its ratio of spot to derivatives trading very consistent.
The firm also ranked number one in open interest market share, but this was its least comfortable lead. However, TokenInsight identified a few intangibles that significantly impacted Binance’s CEX performance.

In its list of noteworthy industry events for Q1 2025, Binance was mentioned more than any other exchange. In one such mention, Forbes listed it as one of the world’s most trusted crypto exchanges.
Overall, despite ongoing regulatory scrutiny in several different regions, the exchange seemingly holds a firm grip on the market.
Disclaimer
In adherence to the Trust Project guidelines, BeInCrypto is committed to unbiased, transparent reporting. This news article aims to provide accurate, timely information. However, readers are advised to verify facts independently and consult with a professional before making any decisions based on this content. Please note that our Terms and Conditions, Privacy Policy, and Disclaimers have been updated.

Dogecoin Price Breakout in view as Analyst Predicts $5.6 high

Hedera Struggles Under $0.17 Despite Strong Support

How One Trader Caused MANTRA OM’s $5.5 Billion Crash

Binance Leads One-Third of the CEX Market in Q1 2025

Crypto Ignores ECB Rate Cuts, Highlighting EU’s Fading Influence

Cardano (ADA) Price Flat as Bulls Stay on Sidelines

2.52 Million Altcoins Are Ruining Crypto’s Future

Animoca Brands Valuation Tanks 75% In Two Years, Here’s Why

Crypto exchange BingX hacked for $43 million

Are The Big Players Losing Interest?

Hong Kong’s Securities Association Tips Authorities On Crypto Self-Regulation

Coinbase cbBTC Set to go Live on Solana
2.52 Million Altcoins Are Ruining Crypto’s Future
Animoca Brands Valuation Tanks 75% In Two Years, Here’s Why
Crypto exchange BingX hacked for $43 million
Are The Big Players Losing Interest?
Hong Kong’s Securities Association Tips Authorities On Crypto Self-Regulation
Coinbase cbBTC Set to go Live on Solana
-

 Market24 hours ago
Crypto Market Lost $633 Billion in Q1 2025, CoinGecko Finds
-

 Market23 hours ago
PEPE Price To Bounce 796% To New All-Time Highs In 2025? Here’s What The Chart Says
-
 Market20 hours ago
No Rate Cut Soon, Crypto Banking Rules to Ease
-

 Altcoin22 hours ago
Expert Reveals Hurdles For Ripple And The SEC Ahead Of Final Resolution
-

 Market21 hours ago
XRP Dips To $1.97 – A Golden Opportunity Before The Next Rally?
-

 Market19 hours ago
Ethereum Price Struggles to Rebound—Key Hurdles In The Way
-

 Ethereum18 hours ago
77K Ethereum Moved to Derivatives—Is Another Price Crash Looming?
-
 Market17 hours ago
Bitcoin and Global M2 Money Supply: A Misleading Connection?
