Market
XRP Price To Hit $45? Here’s What Happens If It Mimics 2017 And 2021 Rallies

Reason to trust

Strict editorial policy that focuses on accuracy, relevance, and impartiality
Created by industry experts and meticulously reviewed
The highest standards in reporting and publishing
Strict editorial policy that focuses on accuracy, relevance, and impartiality
Morbi pretium leo et nisl aliquam mollis. Quisque arcu lorem, ultricies quis pellentesque nec, ullamcorper eu odio.
XRP has staged an impressive recovery to reclaim the $2 price level after plunging to a weekly low of $1.657 in a steep midweek correction. The rebound comes at a crucial time for the cryptocurrency, with analysts paying closer attention to historical price behaviors and bullish technical patterns. Among them is EGRAG CRYPTO, a popular XRP analyst on X, who believes that the cryptocurrency could be on the cusp of a monumental surge reminiscent of its previous bull cycles in 2017 and 2021.
The Power Of Time Cycles And Exponential Moving Averages
EGRAG’s technical analysis focuses on a recurring structure seen in XRP’s past cycles, using the 21-period Exponential Moving Average (EMA) and 33-period Moving Average (MA) on the biweekly timeframe. According to his analysis, which was revealed on social media platform X, both the 2017 and 2021 rallies were preceded by similar technical setups: a sustained bottoming process lasting around 770 days followed by a bullish reversal.
Related Reading
These phases were marked by what he described as “blow-off tops,” where XRP posted parabolic gains after bouncing off the 21 and 33 exponential moving averages. The current market structure, EGRAG noted, aligns closely with those previous cycles. After a prolonged bearish trend and a second recorded “bearish cross” in 2022, XRP has once again moved above both the 21 EMA and 33 MA.
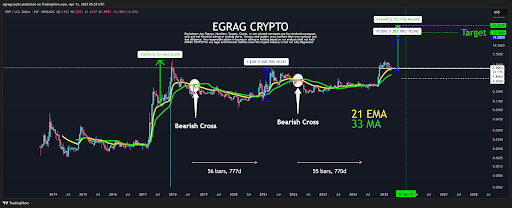
In his view, this sets the stage for a similar breakout scenario, one that could play out before the end of 2025. EGRAG uses this pattern to suggest a timeline of roughly 770 days from the last major crossover in early 2022, placing the projected breakout target around September 29, 2025.
XRP Can Surge To $45
Interestingly, EGRAG’s price prediction based on the premise of how a similar 2017 or 2021 movement can play out for XRP. In 2017, XRP posted a rally of approximately 2,700%, and in 2021, a slightly lower surge of about 1,050%. By mapping those gains onto the current price structure, EGRAG predicted two potential targets: a more conservative $19 level and a bold $45 level. Between these two targets is a mid-range target of $27 which he has previously favored.
Related Reading
However, the analyst warned that while chart patterns offer insight, they are not perfect predictors. In his own words, “Will it rhyme exactly? No, because if it were that easy, everyone would be a multimillionaire.” Still, the emotional patterns of market participants, human reactions and behaviors, tend to repeat to create opportunities where a previous price action might play out again, even if not 100%.
The analyst ended his analysis with a strategic note to long-term holders and short-term traders alike, consider a Dollar-Sell-Average (DSA) approach when the XRP price starts to climb.
At the time of writing, XRP is trading at $2.04, up by 2.6% in the past 24 hours.
Featured image from Adobe Stock, chart from Tradingview.com
Market
Strategy and Metaplanet Buy Bitcoin Despite Recession Fears

Despite recent chaos and fears of a recession, public companies Strategy and Metaplanet are doubling down on new Bitcoin purchases. Strategy purchased BTC worth $285 million, while Metaplanet spent $26.3 million.
Metaplanet’s activity is particularly noteworthy because Japan’s 30-year treasury yields are soaring. For public companies in Japan, conventional economic practice is to pull back from the dollar, but committing to Bitcoin is a bold strategy.
Strategy (formerly MicroStrategy) is one of the world’s largest Bitcoin holders, and it’s been going through a chaotic period. In recent weeks, it has alternated between massive BTC purchases and abrupt acquisition pauses, prompting a great deal of speculation.
Today, however, its Chair, Michael Saylor, announced a major new Bitcoin buy at $285 million:
“Strategy has acquired 3,459 BTC for ~$285.8 million at ~$82,618 per bitcoin and has achieved BTC Yield of 11.4% YTD 2025. As of 4/13/2025, Strategy holds 531,644 BTC acquired for ~$35.92 billion at ~$67,556 per bitcoin,” Saylor claimed via social media.
A lot of this chaos is due to fears of a US recession, which has made the price of Bitcoin swing wildly. When Bitcoin was down, it prompted speculation that MicroStrategy may have to dump its assets.
However, since BTC has started to recover, Michael Saylor’s firm is back on the market.

Critically, Strategy isn’t alone in its Bitcoin acquisitions. Metaplanet is a Japanese firm with substantial BTC holdings and ambitions to acquire even more.
Two days before Strategy made its own major purchase, Metaplanet CEO Simon Gerovich announced a similar investment:
“Metaplanet has acquired 319 BTC for ~$26.3 million at ~$82,549 per bitcoin and has achieved BTC Yield of 108.3% YTD 2025. As of 4/14/2025, we hold 4525 BTC acquired for ~$386.3 million at ~$85,366 per bitcoin,” Gerovich claimed.
Metaplanet’s commitment here is particularly noteworthy because it contradicts near-term macroeconomic headwinds. The global market is filled with risk-averse behavior right now, and Japan’s 30-year bond yields surged to the highest level in over two decades.
Despite this clear signal, the Japanese Metaplanet is continuing to make major Bitcoin investments. The latest purchases also had a positive impact on the company’s stock market. It’s currently up by 3% today, after suffering notable losses the past month.

In short, major corporate Bitcoin holders like Strategy and Metaplanet aren’t interested in tapering off yet. Despite the recent chaos, there is serious confidence that BTC will either gain in price or represent a stable store of value.
Either way, when public firms like this publicly take a bullish stance, it can shore up confidence across the entire market.
Disclaimer
In adherence to the Trust Project guidelines, BeInCrypto is committed to unbiased, transparent reporting. This news article aims to provide accurate, timely information. However, readers are advised to verify facts independently and consult with a professional before making any decisions based on this content. Please note that our Terms and Conditions, Privacy Policy, and Disclaimers have been updated.
Market
SEC Delays Decision on Grayscale Ethereum ETF Staking


The SEC has delayed its decision on whether to allow staking for Grayscale’s proposed Ethereum spot ETFs.
The ETFs in question—Grayscale Ethereum Trust and Grayscale Ethereum Mini Trust ETF—were filed by NYSE Arca on February 14, 2025. The filing included a rule change request to enable staking as part of their investment strategy.
SEC Pushes Back Grayscale Ethereum ETF Staking Deadline July
The SEC deadline for deciding on the original proposal was set to conclude on April 17. Under the Securities Exchange Act of 1934, the SEC is authorized to extend this review period for up to 90 days.
The agency has now exercised that option. This now allows the SEC to decide on this filing by July 2025.
Staking would allow the ETFs to earn rewards by participating in Ethereum’s proof-of-stake consensus mechanism, a feature not yet approved for any US spot crypto ETF.
Grayscale has proposed that staking be conducted exclusively by the sponsor without commingling funds. Also, Coinbase Custody would continue safeguarding the ETH assets.
The SEC’s delay is part of a broader pattern of cautious regulatory scrutiny over crypto ETF innovations, including similar filings from other asset managers.
Disclaimer
In adherence to the Trust Project guidelines, BeInCrypto is committed to unbiased, transparent reporting. This news article aims to provide accurate, timely information. However, readers are advised to verify facts independently and consult with a professional before making any decisions based on this content. Please note that our Terms and Conditions, Privacy Policy, and Disclaimers have been updated.
Market
Solana Futures Traders Eye $147 as SOL Recovers

Solana has surged by 40% since plummeting to a 12-month low of $95.23 on April 7, igniting renewed bullish sentiment in the derivatives market.
As of today, this price recovery has driven SOL’s long/short ratio to a 30-day high, signaling a significant uptick in demand for long positions among futures traders.
SOL Eyes Fresh Rally as Long/Short Ratio Surges
According to Coinglass, SOL’s long/short ratio currently sits at a 30-day high of 1.06, reflecting today’s surge in demand for long positions.

The long/short ratio measures the proportion of long positions (bets on price increases) to short positions (bets on price declines) in the market.
A ratio below 1 indicates more traders are betting on the asset’s price falling. Conversely, as with SOL, a ratio above 1 suggests a bullish sentiment, with the majority expecting further price gains.
The growing appetite for longs suggests SOL traders are increasingly confident in further upside potential. This is notable because following the sharp rebound from its 12-month low, SOL appears to have entered a consolidation phase, a typical cooling-off period that often precedes the next leg of a rally.
Hence, if the demand for long positions persists and buying pressure strengthens, SOL could break above this narrow range and initiate the next cycle of its rally.
On the technical side of things, the setup of the coin’s Moving Average Convergence Divergence (MACD) confirms this bullish outlook. At press time, SOL’s MACD line (blue) rests atop its signal line (orange).
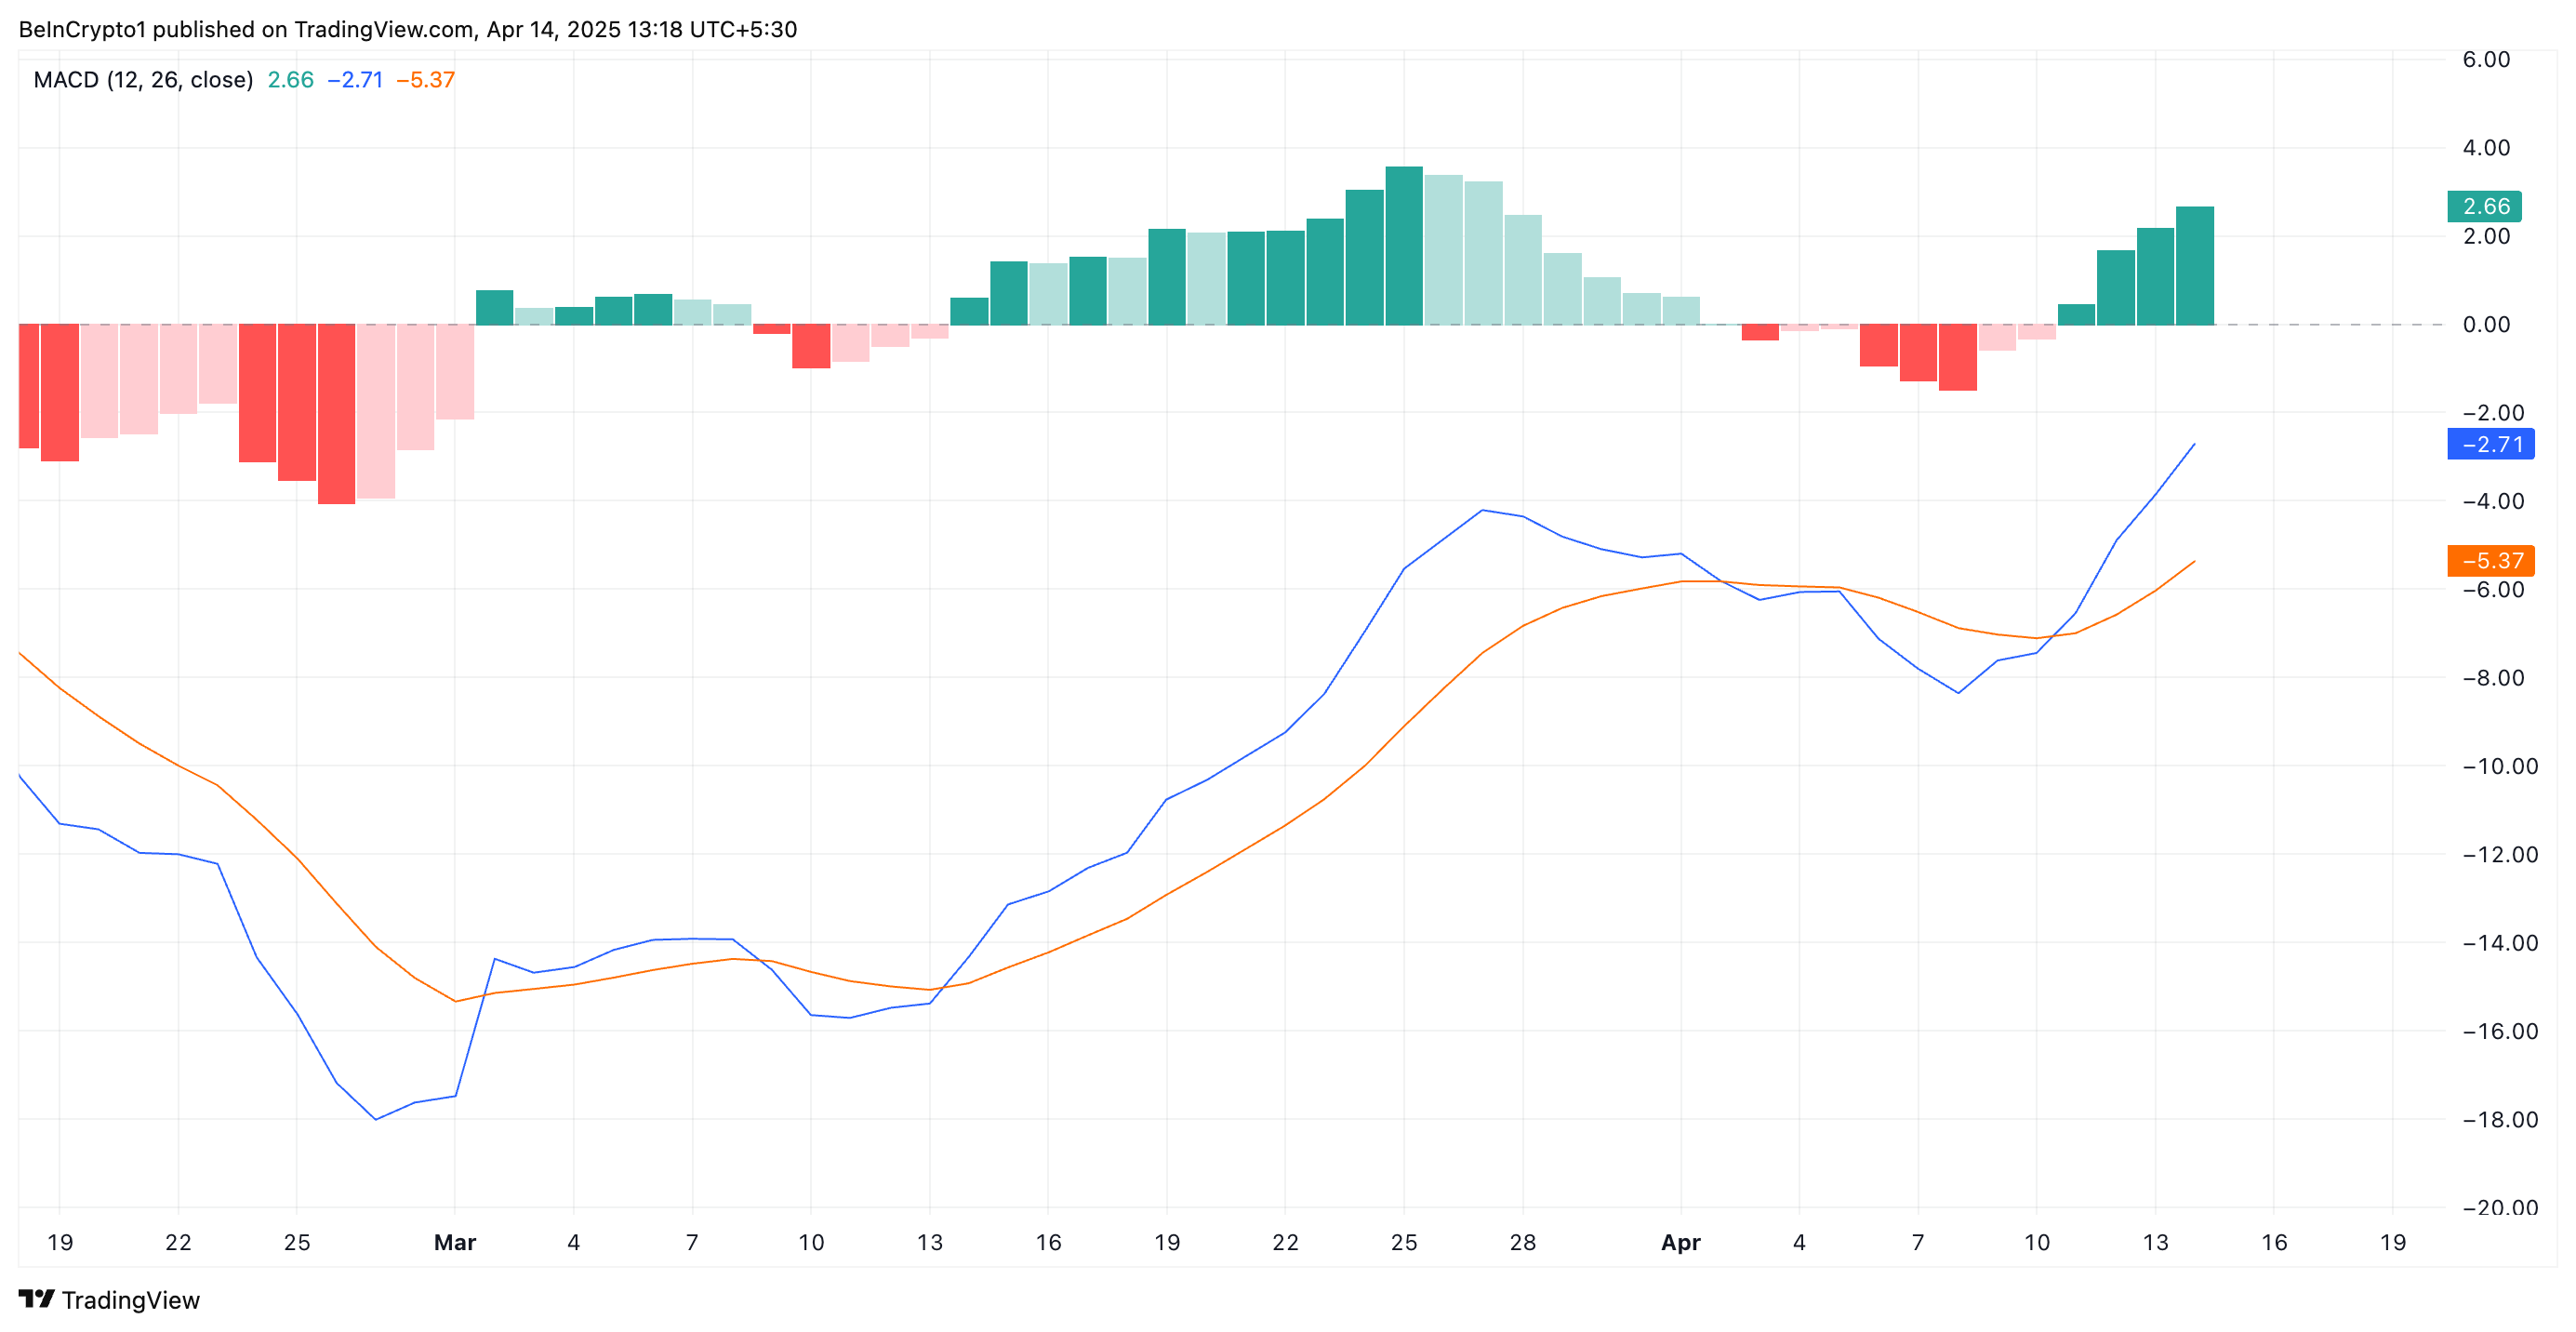
This trend indicates growing bulling momentum in the SOL spot markets. The crossover suggests that buying pressure is increasing and offers confirmation that the recent upward price movement could continue in the short term.
Solana Attempts to Stabilize above $130, with $147 in Sight
SOL currently trades at $131.66, attempting to stabilize above its new support floor formed at $130.17. If the demand for longs persists and bullish momentum remains strong, SOL could break out of its sideways movements and rally toward $147.59.
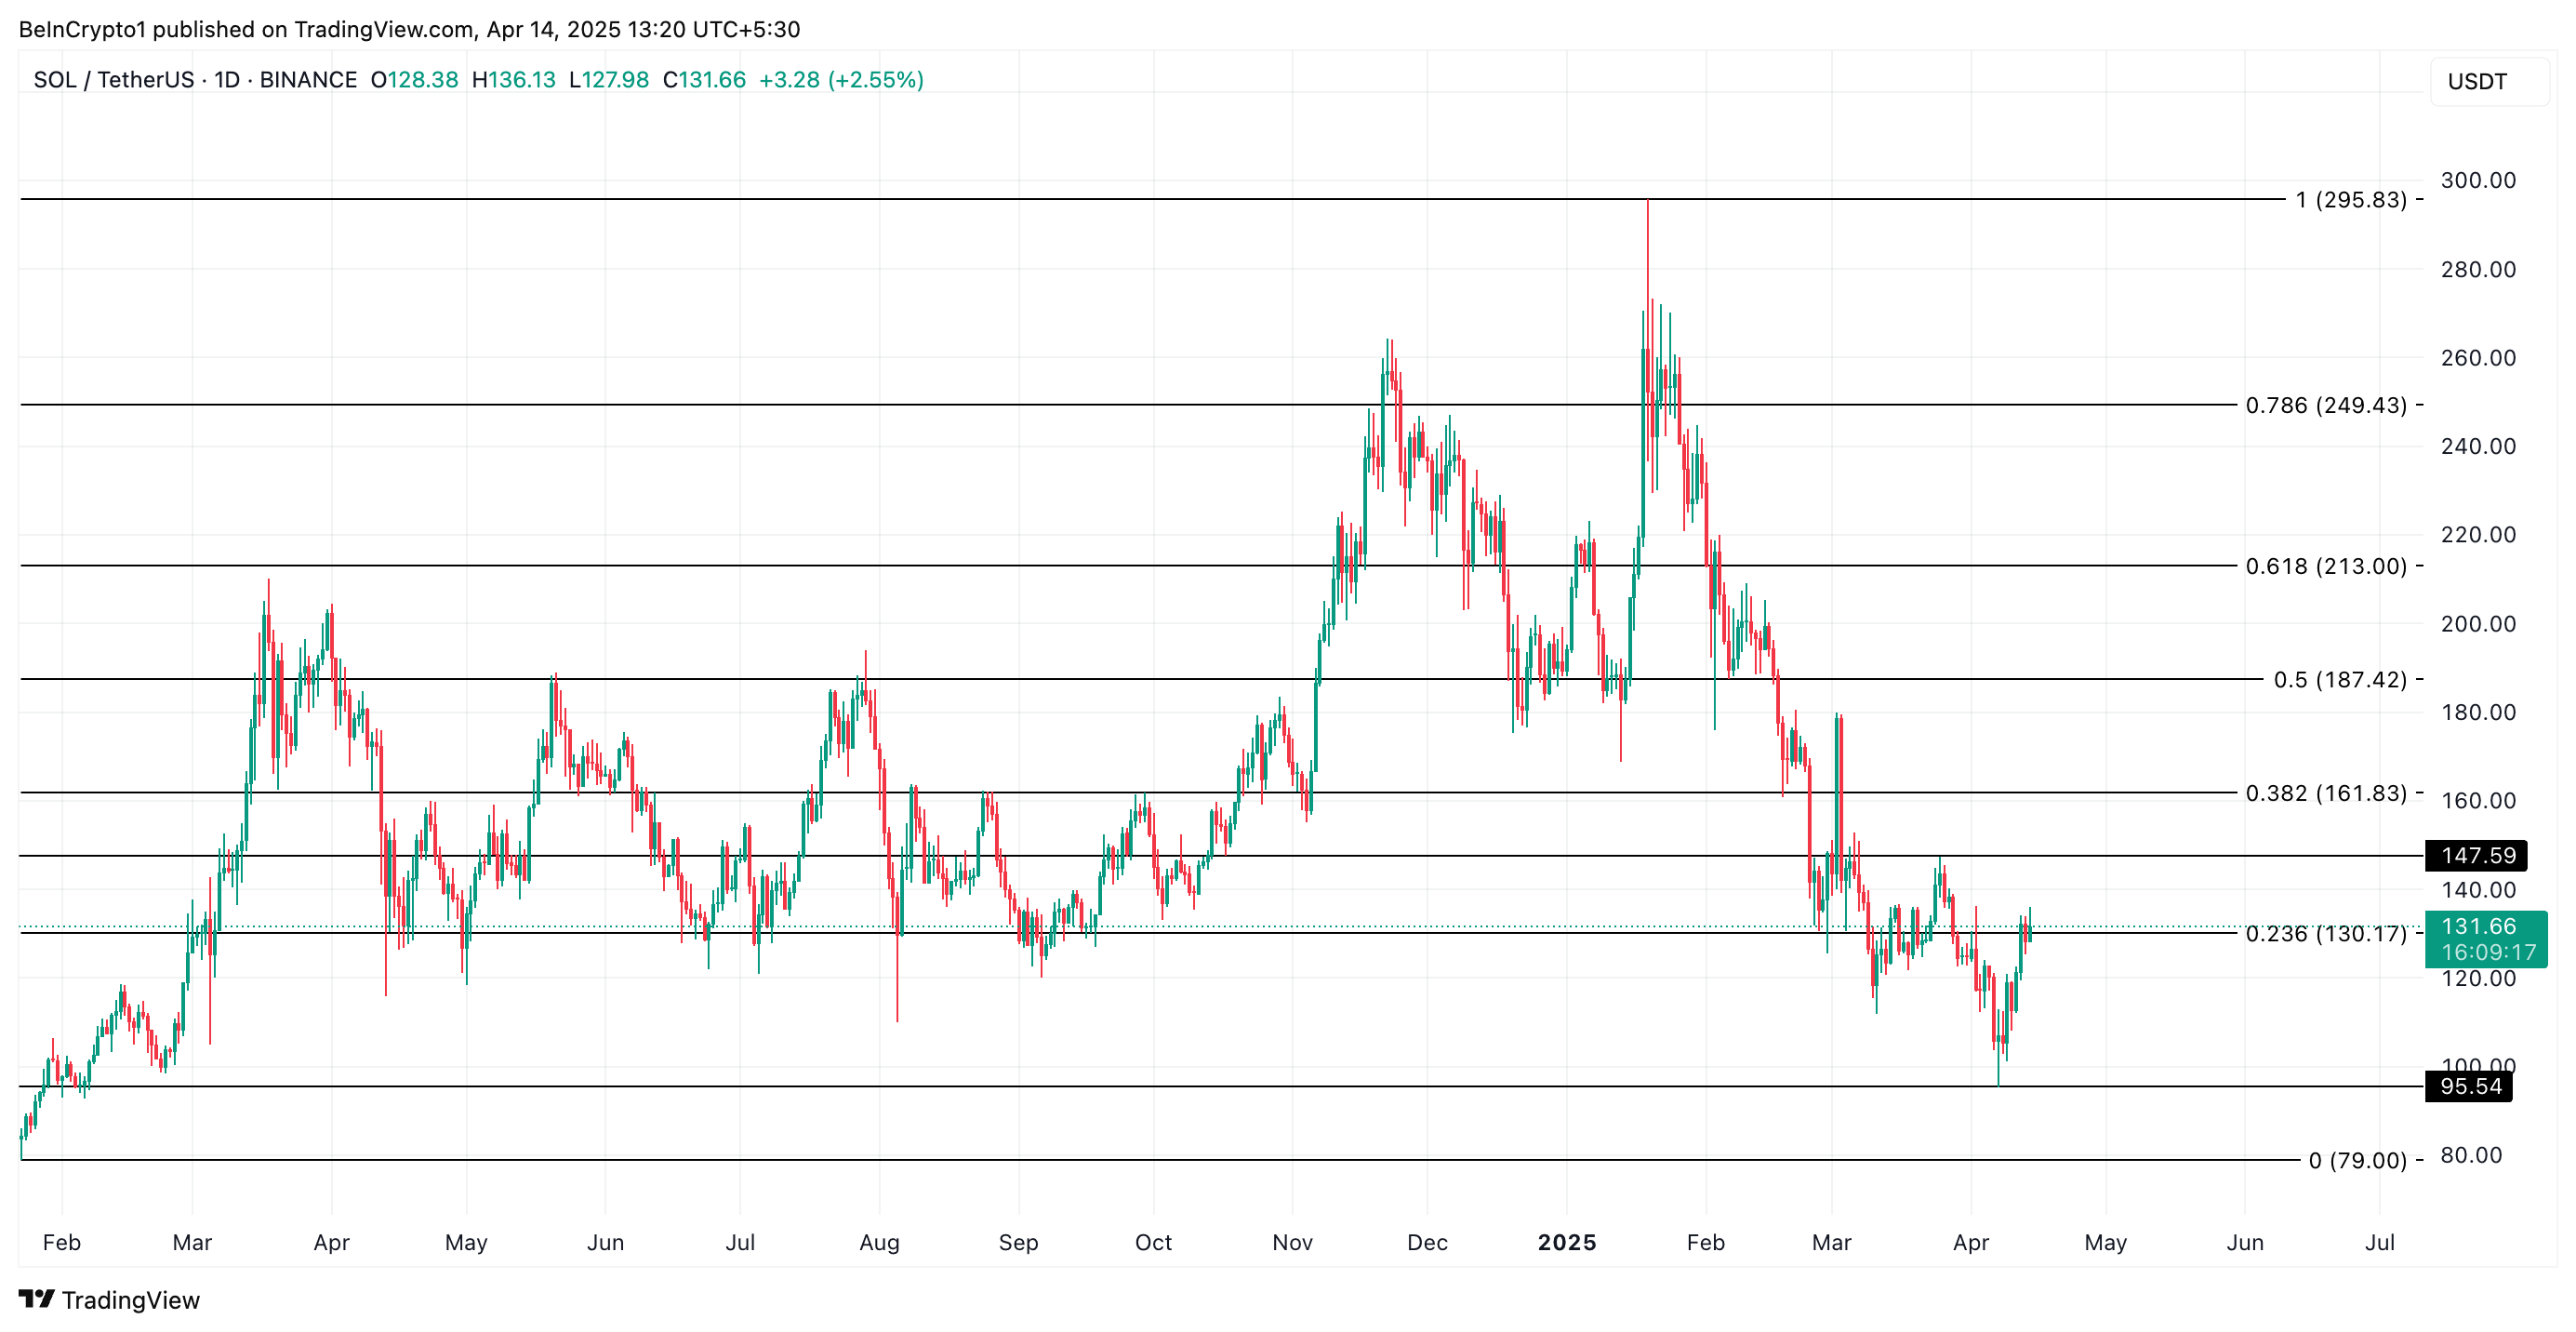
On the other hand, if bullish pressure weakens and profit-taking resumes, SOL could slip below $130.17 and fall to $95.54.
Disclaimer
In line with the Trust Project guidelines, this price analysis article is for informational purposes only and should not be considered financial or investment advice. BeInCrypto is committed to accurate, unbiased reporting, but market conditions are subject to change without notice. Always conduct your own research and consult with a professional before making any financial decisions. Please note that our Terms and Conditions, Privacy Policy, and Disclaimers have been updated.
-

 Altcoin17 hours ago
Mantra Team Responds As The OM Token Price Crashes Over 80% In 24 Hours
-

 Market21 hours ago
3 Token Unlocks for This Week: TRUMP, STRK, ZKJ
-

 Altcoin20 hours ago
Ethereum Price Eyes Rally To $4,800 After Breaking Key Resistance
-

 Bitcoin23 hours ago
Bitcoin STH MVRV Climbs To 0.90, Is A Price Rebound On?
-

 Market22 hours ago
Hackers are Targeting Atomic and Exodus Wallets
-

 Bitcoin24 hours ago
New Bill Pushes Bitcoin Miners to Invest in Clean Energy
-
 Altcoin4 hours ago
XRP Price Climbs Again, Will XRP Still Face a Death Cross?
-

 Market15 hours ago
MANTRA’s OM Token Crashes 90% Amid Insider Dump Allegations


