
Market
Ripple May Settle SEC’s $50 Million Fine Using XRP

Ripple’s long-running legal clash with the US Securities and Exchange Commission (SEC) appears to be nearing its final chapter.
However, a surprising detail has emerged from the ongoing settlement talks, which could see Ripple pay its reduced $50 million penalty using its native token, XRP.
Ripple Could Use XRP Token to Pay SEC Fine
On April 11, Ripple CEO Brad Garlinghouse appeared on FOX Business. At the interview, he revealed that the idea of paying the penalty in XRP was floated during settlement discussions.
“The SEC is going to end up with $50 million and the US government gets $50 million and we talked about making that available in XRP,” Garlinghouse stated.
The ongoing negotiations follow Ripple’s and the SEC’s decision to drop their appeals, bringing the multi-year legal battle closer to closure.
“We’re moving past the SEC’s war on crypto and entering the next phase of the market – true institutional flows integrating with decentralized finance,” Garlinghouse added in a post on X.
Judge Analisa Torres originally set the fine at $125 million in 2024, linking it to Ripple’s unregistered XRP sales to institutional investors. Ripple complied by placing the funds in an interest-bearing account, but the appeals process delayed any further action.
With those appeals now abandoned, Ripple is expected to pay a reduced fine of $50 million.
A recent joint court filing confirms that both sides have reached a preliminary agreement. They are now seeking final approval from the SEC’s commissioners.
Once internal reviews are complete, the parties plan to request a formal ruling from the district court.
“There is good cause for the parties’ joint request that this Court put these appeals in abeyance. The parties have reached an agreement-in-principle, subject to Commission approval, to resolve the underlying case, the Commission’s appeal, and Ripple’s cross-appeal. The parties require additional time to obtain Commission approval for this agreement-in-principle, and if approved by the Commission, to seek an indicative ruling from the district court,” the filing stated.
If the commission votes in favor, this case could conclude one of the most closely watched regulatory battles in crypto history. More importantly, the use of XRP for the settlement could mark a significant shift in the SEC’s approach to digital assets.
This turnaround would represent a major regulatory shift and could trigger further bullish momentum for the token.
Since Donald Trump’s election victory in November 2024, investor confidence in XRP has grown sharply, pushing the token’s value up by more than 300%.
At the same time, institutional interest continues to rise, as seen in the wave of spot exchange-traded fund applications tied to the token
Market analysts have linked this performance to the friendlier political climate. They also point to the potential reclassification of XRP as a commodity as a key factor driving the asset’s rise.
Disclaimer
In adherence to the Trust Project guidelines, BeInCrypto is committed to unbiased, transparent reporting. This news article aims to provide accurate, timely information. However, readers are advised to verify facts independently and consult with a professional before making any decisions based on this content. Please note that our Terms and Conditions, Privacy Policy, and Disclaimers have been updated.


Dogecoin holders have been withdrawing their funds from spot markets in April, with the leading meme coin facing mounting selling pressure.
The lack of new capital flowing into DOGE reflects a decline in investor confidence and adds downward pressure on the altcoin.
Sell-Off Worsens for DOGE as Outflows Outpace Inflows
Since the beginning of April, DOGE has seen a consistent stream of net outflows from its spot market, totaling over $120 million. Net inflows during the same period have been negligible, amounting to less than $5 million per Coinglass.

When an asset records spot outflows, more of its coins or tokens are being sold or withdrawn from the spot market than are being bought or deposited.
This indicates that DOGE investors are losing confidence and opting to liquidate their holdings due to increasingly bearish market conditions.
The persistent outflows from the meme coin over the past two weeks reflect the lack of new demand for the altcoin. If this trend continues, DOGE’s price could remain range-bound or face another decline cycle.
On the technical front, DOGE’s Relative Strength Index (RSI) has continued to trend downward on the daily chart, further confirming the bearish outlook.
At press time, this key momentum indicator, which measures an asset’s oversold and overbought market conditions, is below the 50-neutral line at 47.61.

When an asset’s RSI falls below the center line, bearish momentum strengthens. This suggests that DOGE selling pressure is beginning to outweigh buying interest, signaling a potential dip in the asset’s price.
DOGE Risks Retesting Yearly Lows
With the crypto market’s volatility heightened by Donald Trump’s ongoing trade wars and DOGE’s current struggles to attract fresh investment, the meme coin may test new lows in the near term. If selling pressure strengthens, DOGE could revisit its year-to-date low of $0.12.
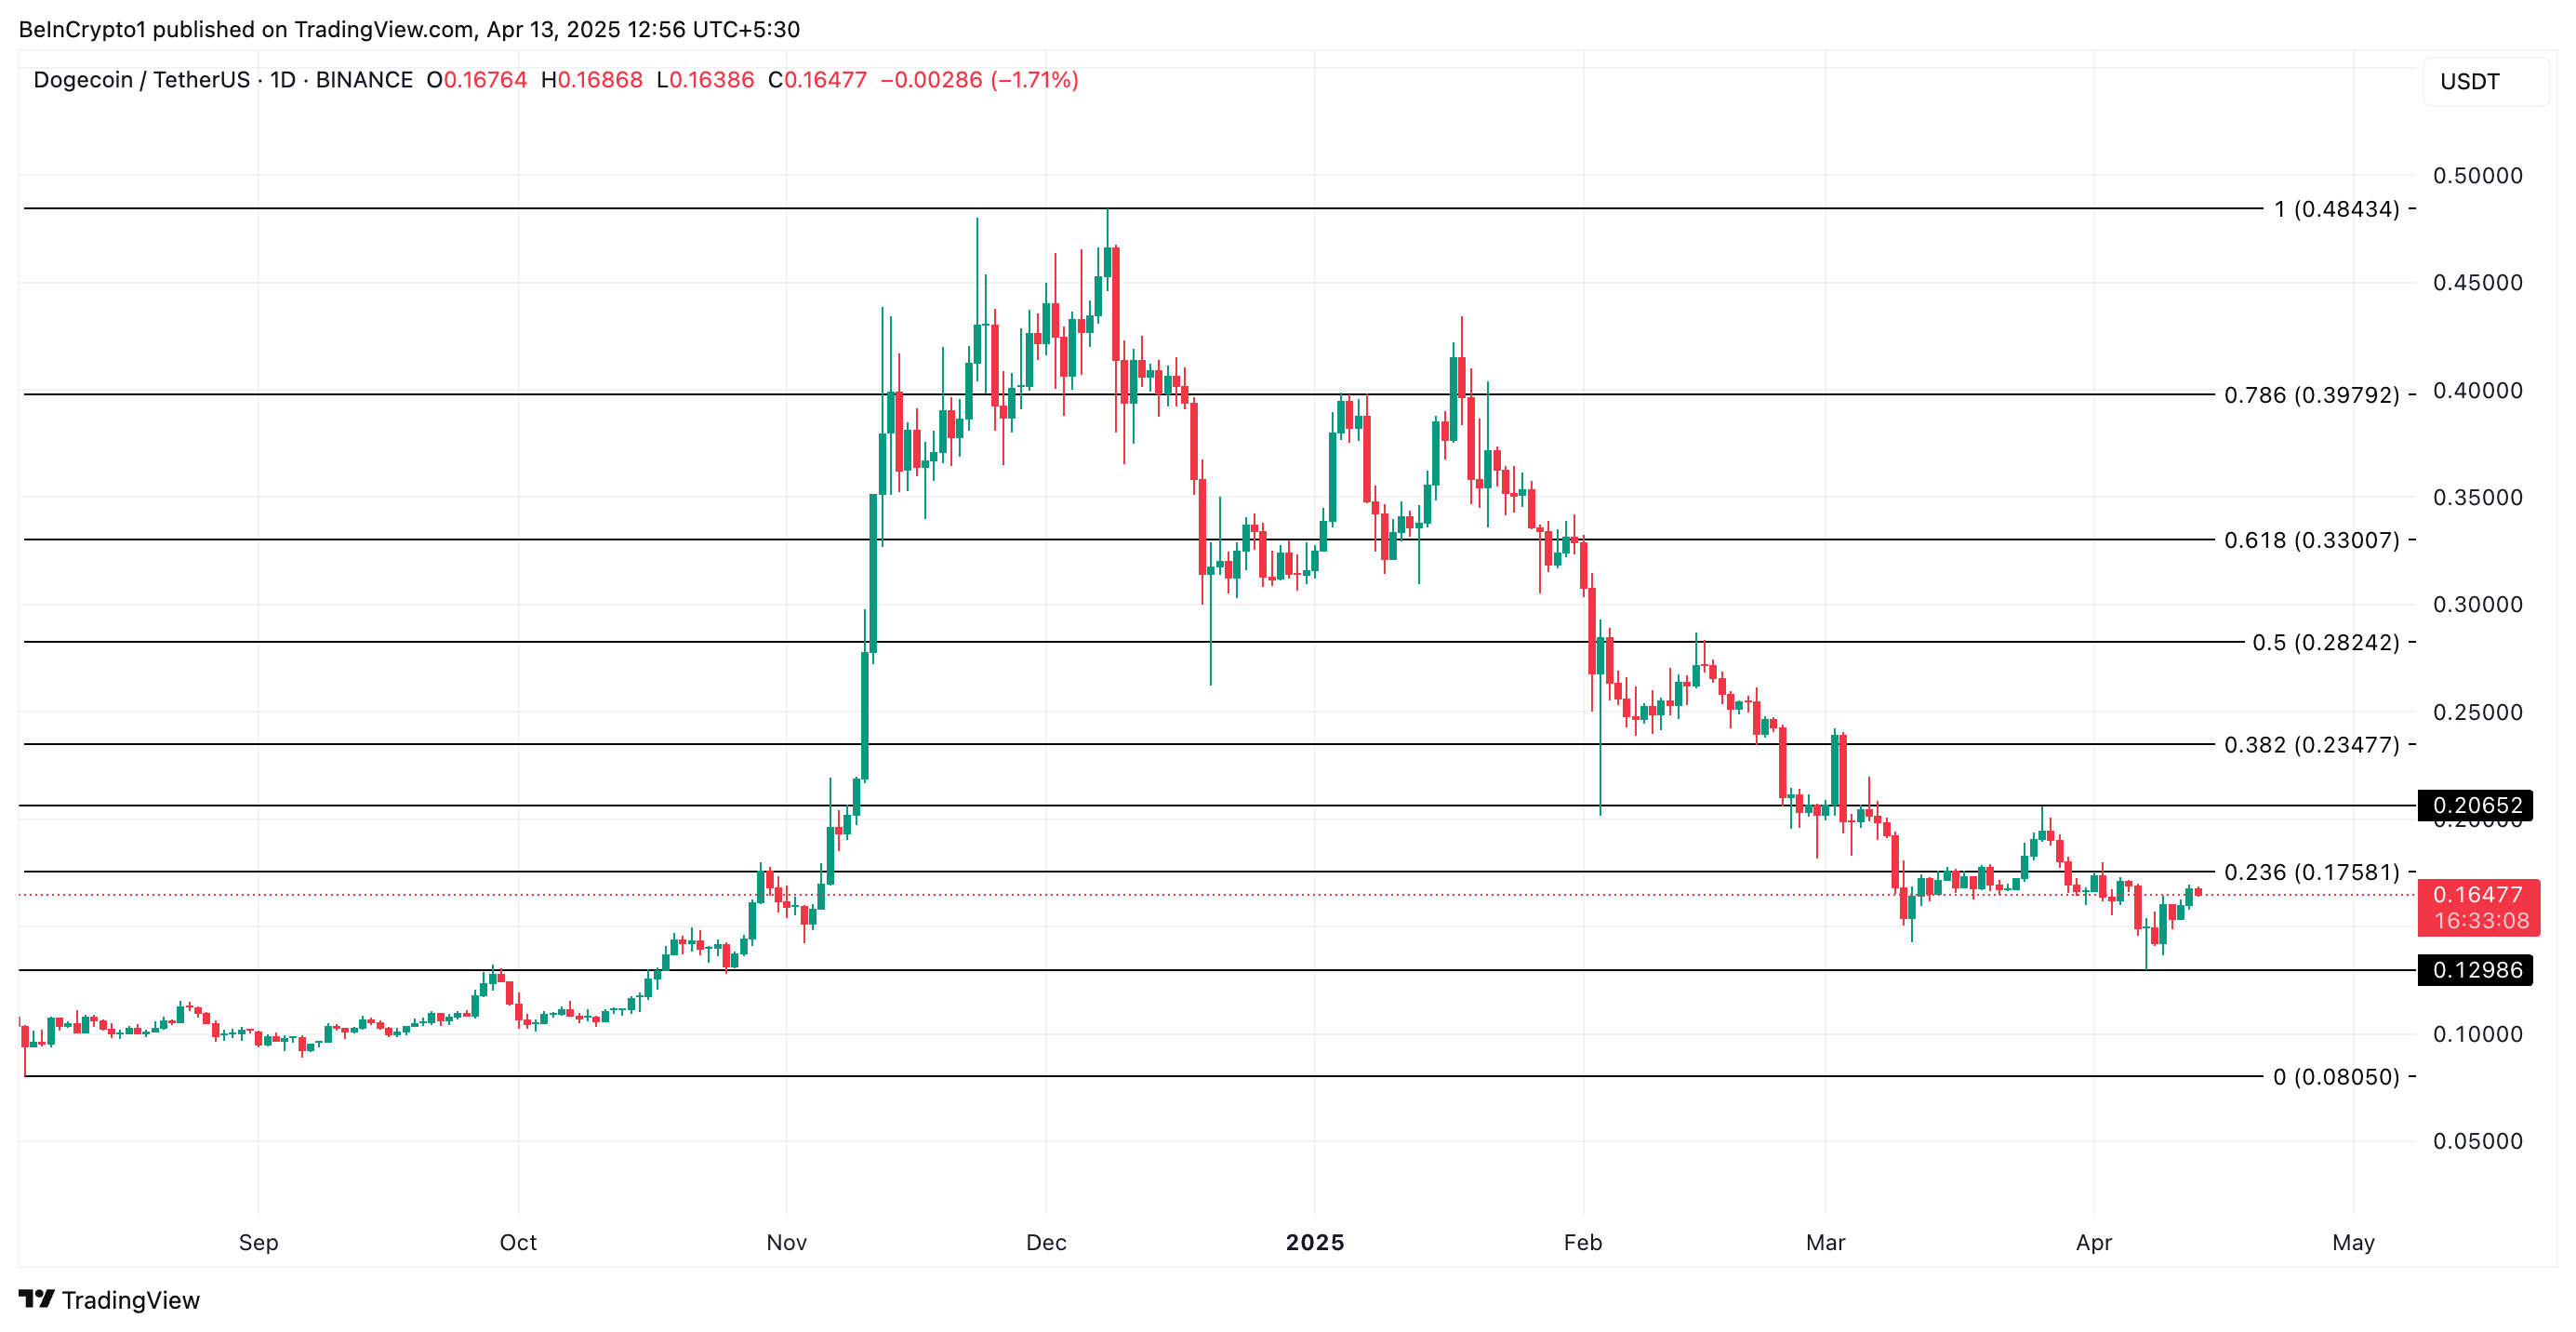
Conversely, a resurgence in new demand for the meme coin will invalidate this bearish outlook. In that scenario, DOGE’s price could break above $0.17 and climb to $0.20.
Disclaimer
In line with the Trust Project guidelines, this price analysis article is for informational purposes only and should not be considered financial or investment advice. BeInCrypto is committed to accurate, unbiased reporting, but market conditions are subject to change without notice. Always conduct your own research and consult with a professional before making any financial decisions. Please note that our Terms and Conditions, Privacy Policy, and Disclaimers have been updated.

PI has staged a remarkable comeback after plunging to an all-time low of $0.40 on April 5. Amid a broader market recovery over the past week, the altcoin has seen a resurgence in demand, driving its price up 84% from its recent bottom.
With the bulls attempting to strengthen market control, PI could extend its gains in the short term.
PI Recovers From Crash With Strong Bullish Setup
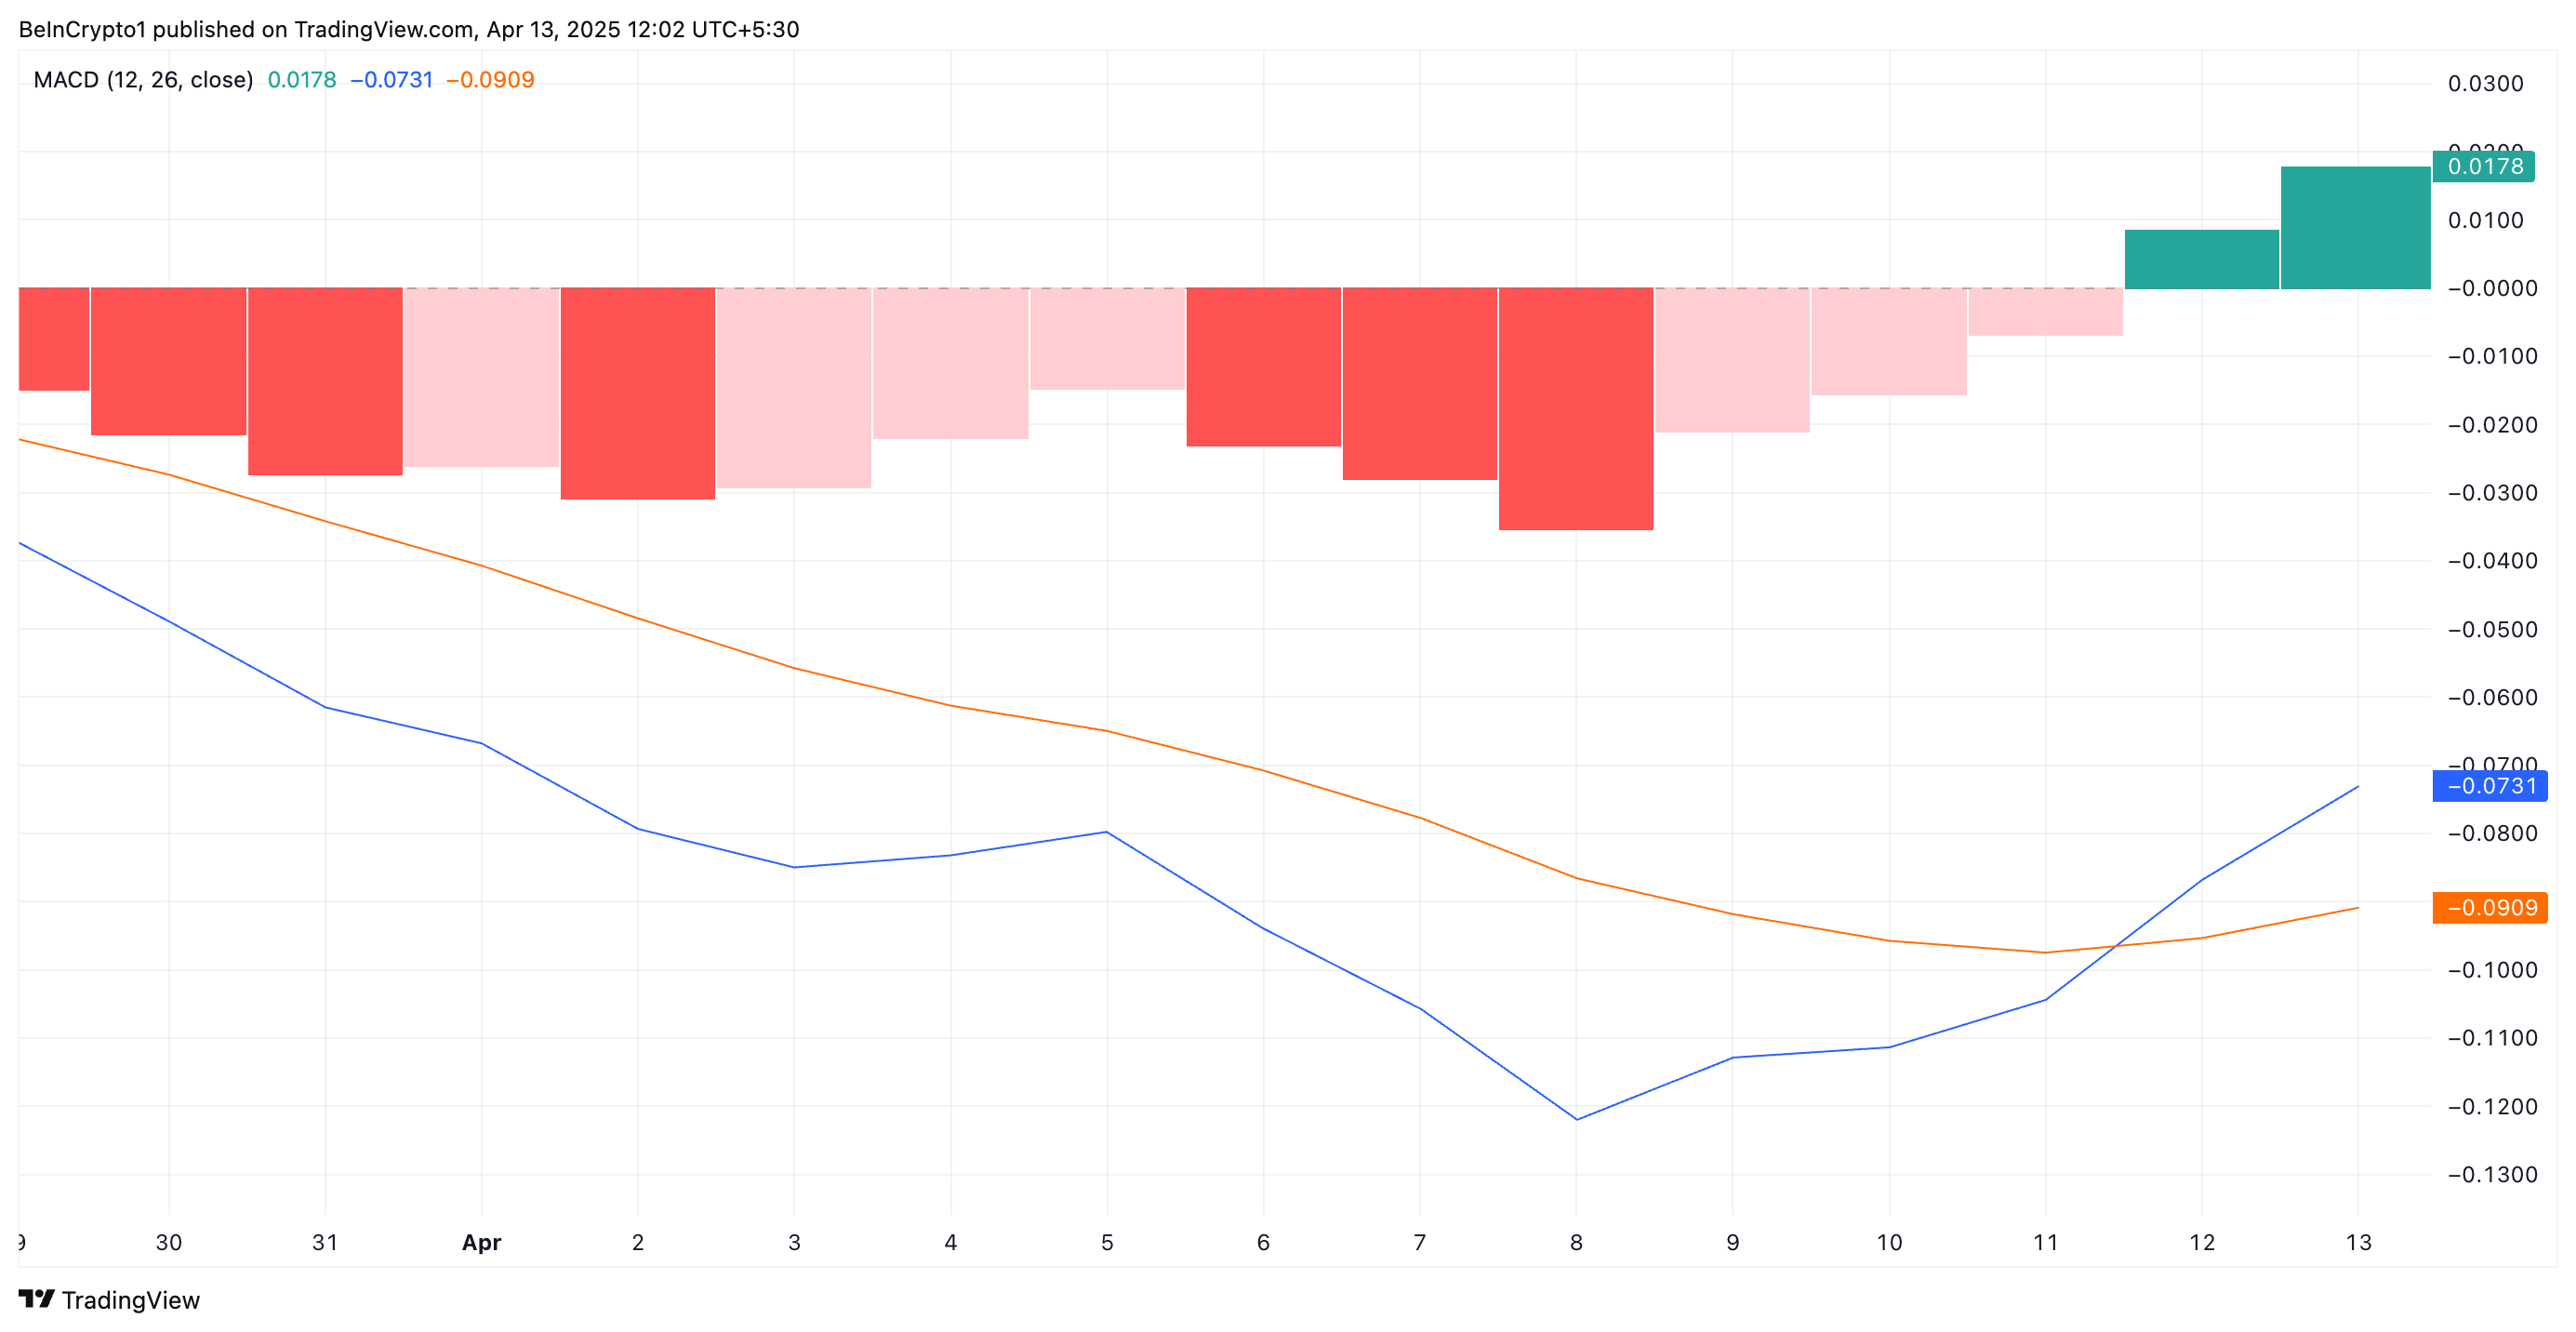
PI’s Moving Average Convergence Divergence (MACD) indicator has flashed a bullish signal. On the daily chart, the MACD line (blue) crossed above the signal line (orange) on April 5, indicating a positive shift in momentum right after it bottomed at $0.40.
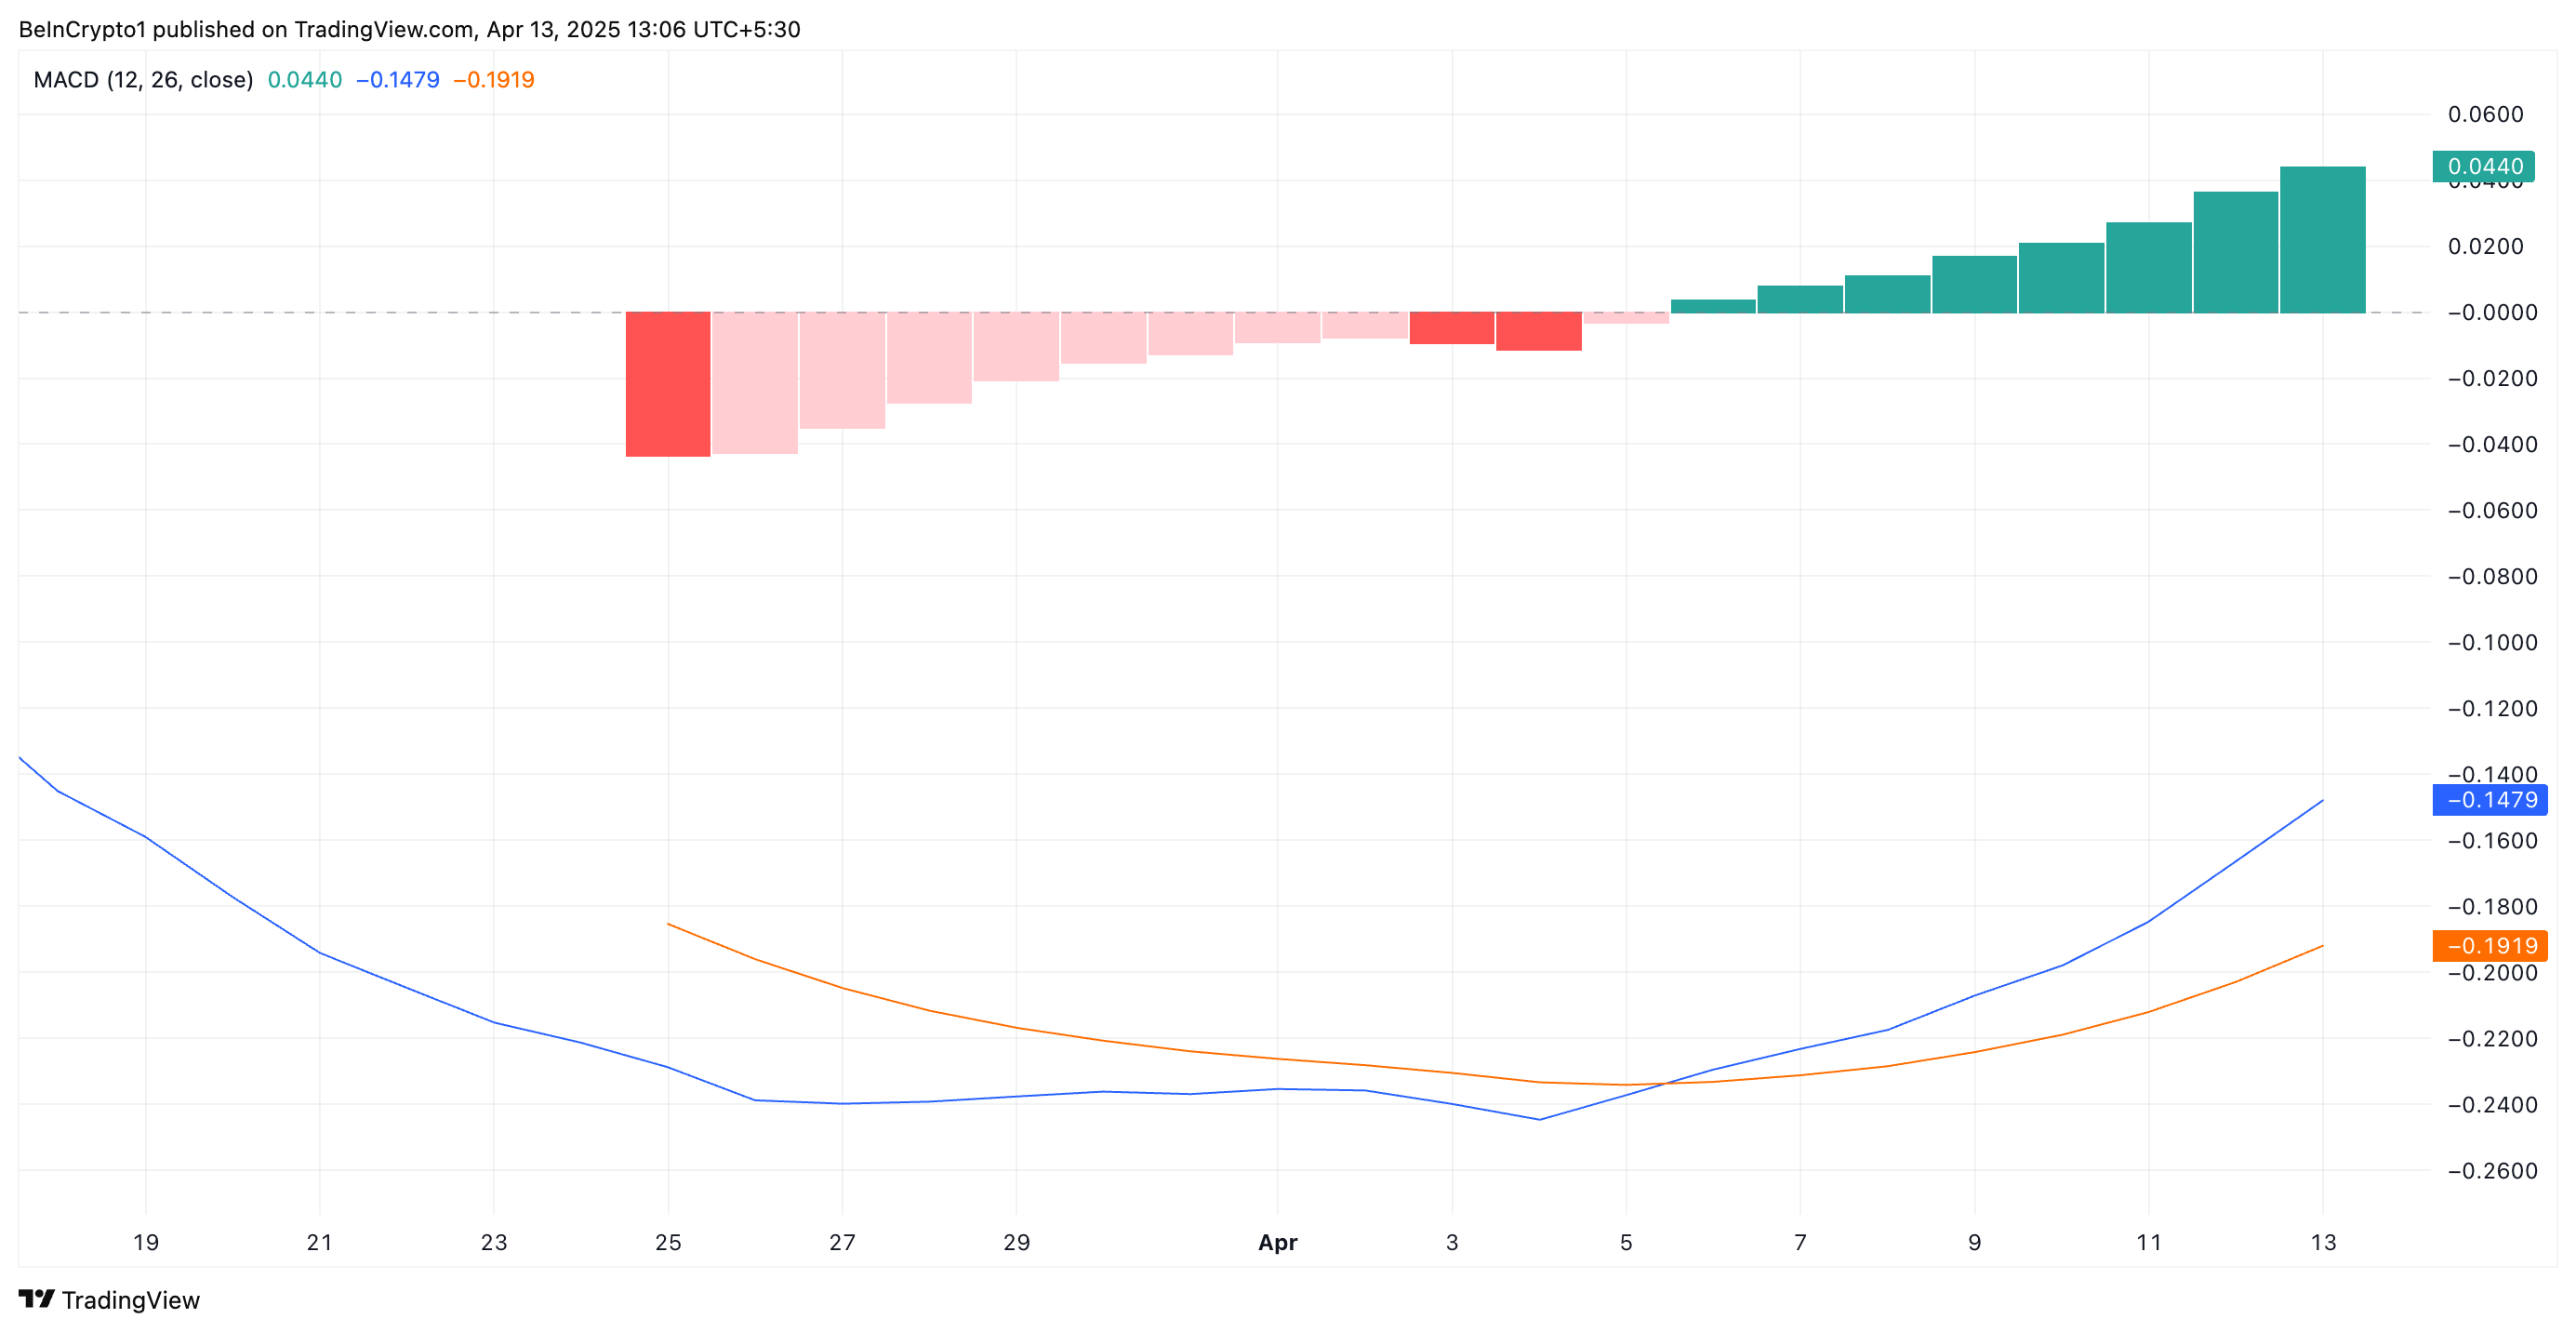
Additionally, the histogram bars, which reflect the strength of that momentum, have gradually increased in size over the past few days, highlighting the growing demand for the altcoin.
When an asset’s MACD is set up this way, upward momentum is building, and buyers are gaining control. PI’s MACD crossover is a bullish signal, suggesting the potential for continued price gains as buying pressure increases.
In addition, PI’s positive Balance of Power (BoP) reflects the growing demand for the altcoin. As of this writing, the indicator is at 0.52.
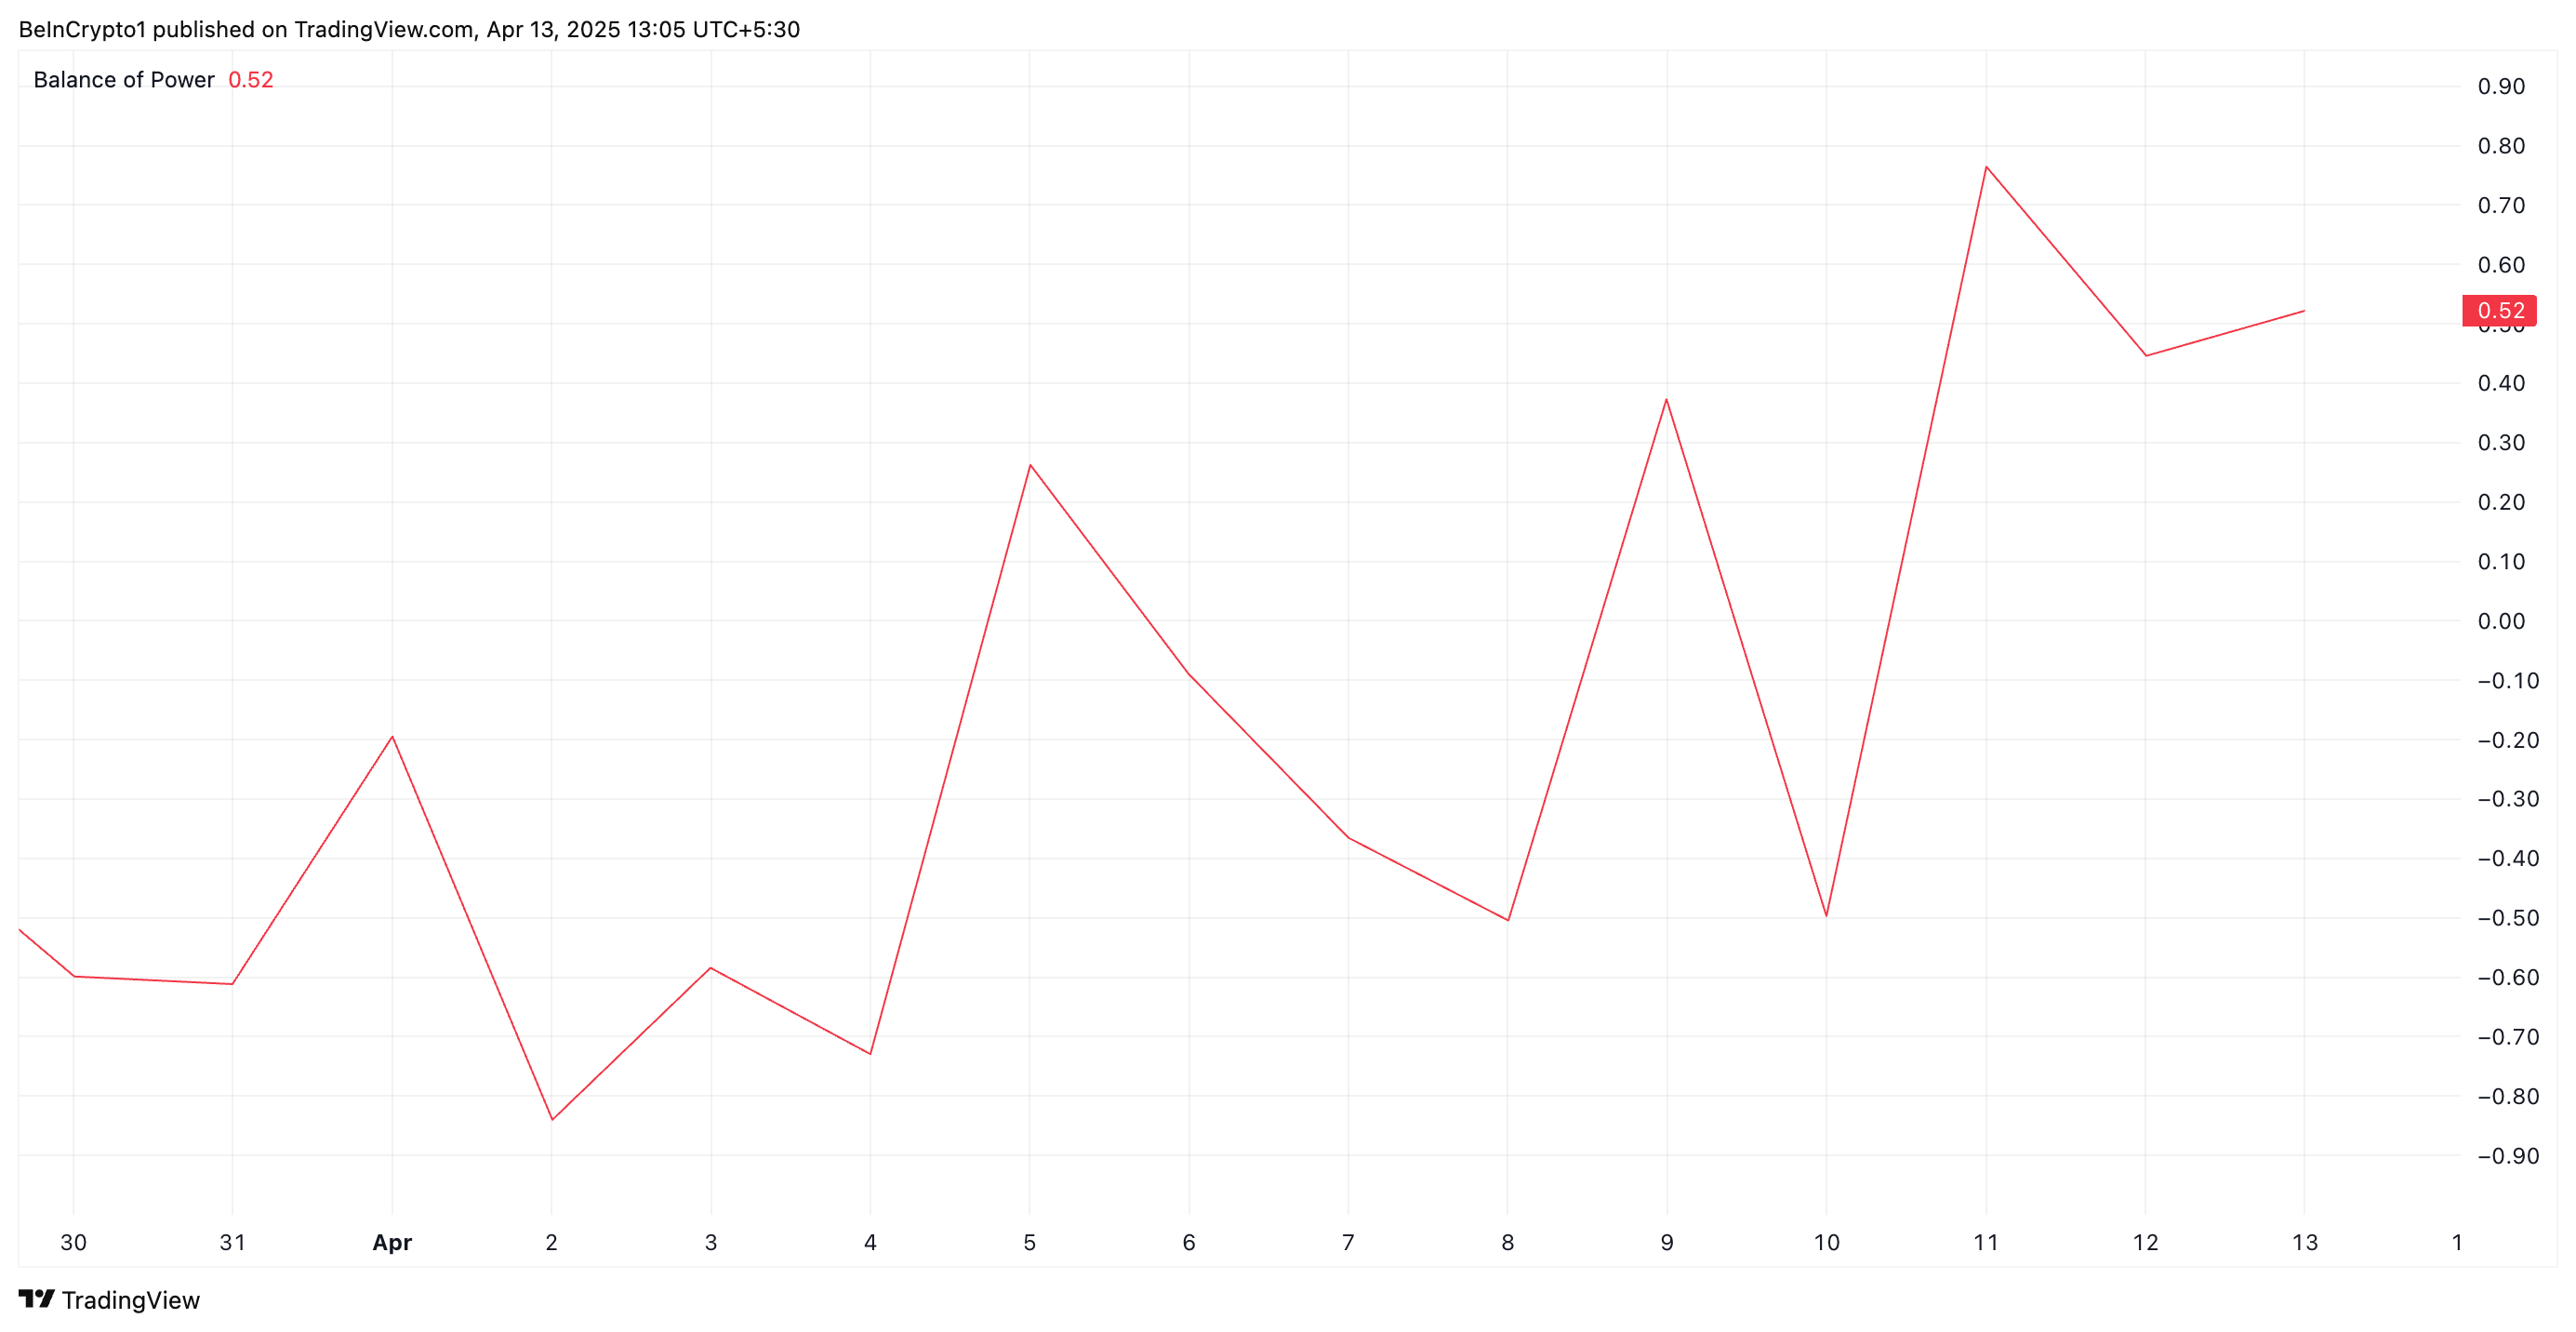
The BoP indicator measures the strength of buyers versus sellers in the market, helping to identify momentum shifts. When its value is positive, buyers are dominating the market over sellers and driving newer price gains.
Is $1 Within Reach?
PI’s ongoing rally has caused its price to trend within an ascending parallel channel. This bullish pattern is formed when an asset’s price consistently moves between two upward-sloping, parallel trendlines.
It signals a sustained uptrend, with PI buyers gradually gaining control while allowing short-term pullbacks. If the rally continues, PI could exchange hands at $0.95.
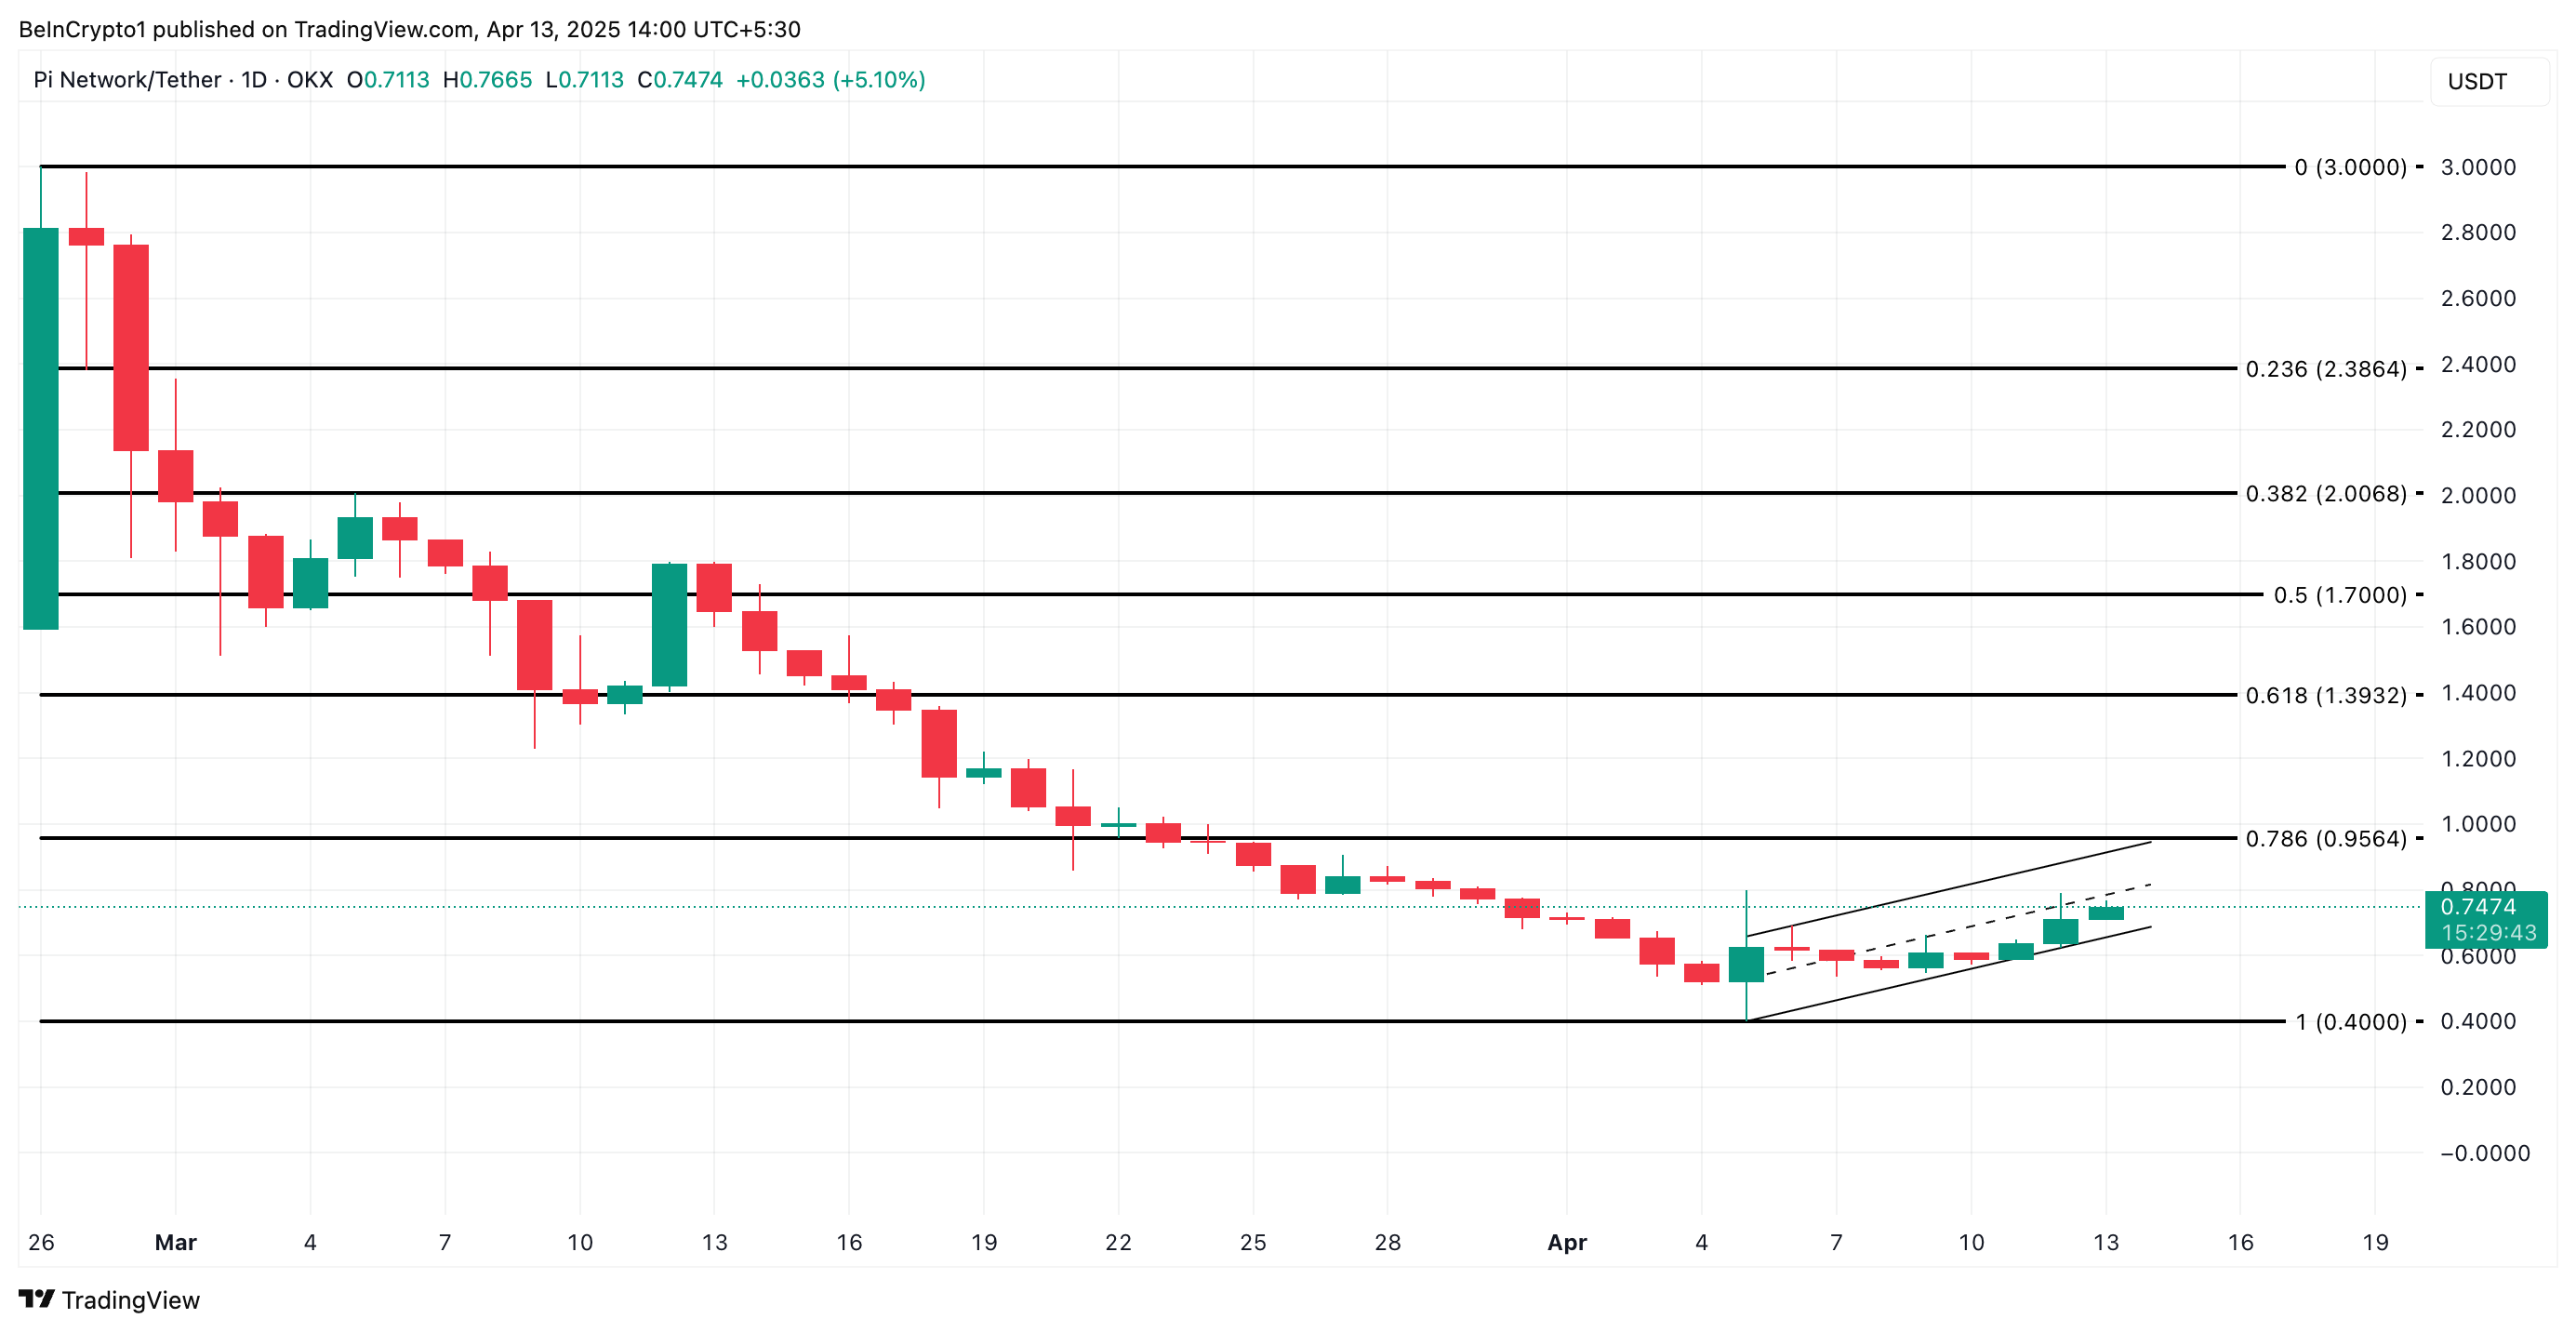
However, if the altcoin reverses its current trend and sheds recent gains, its value could fall to $0.40.
Disclaimer
In line with the Trust Project guidelines, this price analysis article is for informational purposes only and should not be considered financial or investment advice. BeInCrypto is committed to accurate, unbiased reporting, but market conditions are subject to change without notice. Always conduct your own research and consult with a professional before making any financial decisions. Please note that our Terms and Conditions, Privacy Policy, and Disclaimers have been updated.

Since plunging to its year-to-date low of $1.61 on April 7, XRP holders have taken full advantage of the dip, ramping up accumulation efforts. This buying pressure has steadily increased the asset’s value over the past week.
At press time, XRP trades at a seven-day high of $2.19 and technical indicators show that it’s positioned to extend the gains.
XRP Golden Cross Drives Bullish Momentum
On the daily chart, a golden cross has formed on XRP’s Moving Average Convergence Divergence (MACD) indicator, which is often viewed as a key signal of a shift toward long-term upside.
The MACD indicator measures an asset’s price trends and momentum, and identifies reversal points. It forms a golden cross when its MACD line (blue) crosses above its signal line (orange).
When a golden cross emerges like this, it signals a positive shift in investor sentiment. Traders interpret it as a cue that buying pressure outpaces selling activity, which can attract even more inflows and drive the price higher.
For XRP, this golden cross occurred on April 11, reinforcing the growing bullish sentiment surrounding the asset. This pattern confirms that the altcoin’s recent price rebound is not just a short-lived reaction but may mark the beginning of a more sustained uptrend.
Further, the token’s positive Chaikin Money Flow (CMF) supports this bullish outlook. At press time, it rests above the center line and in an uptrend at 0.07.
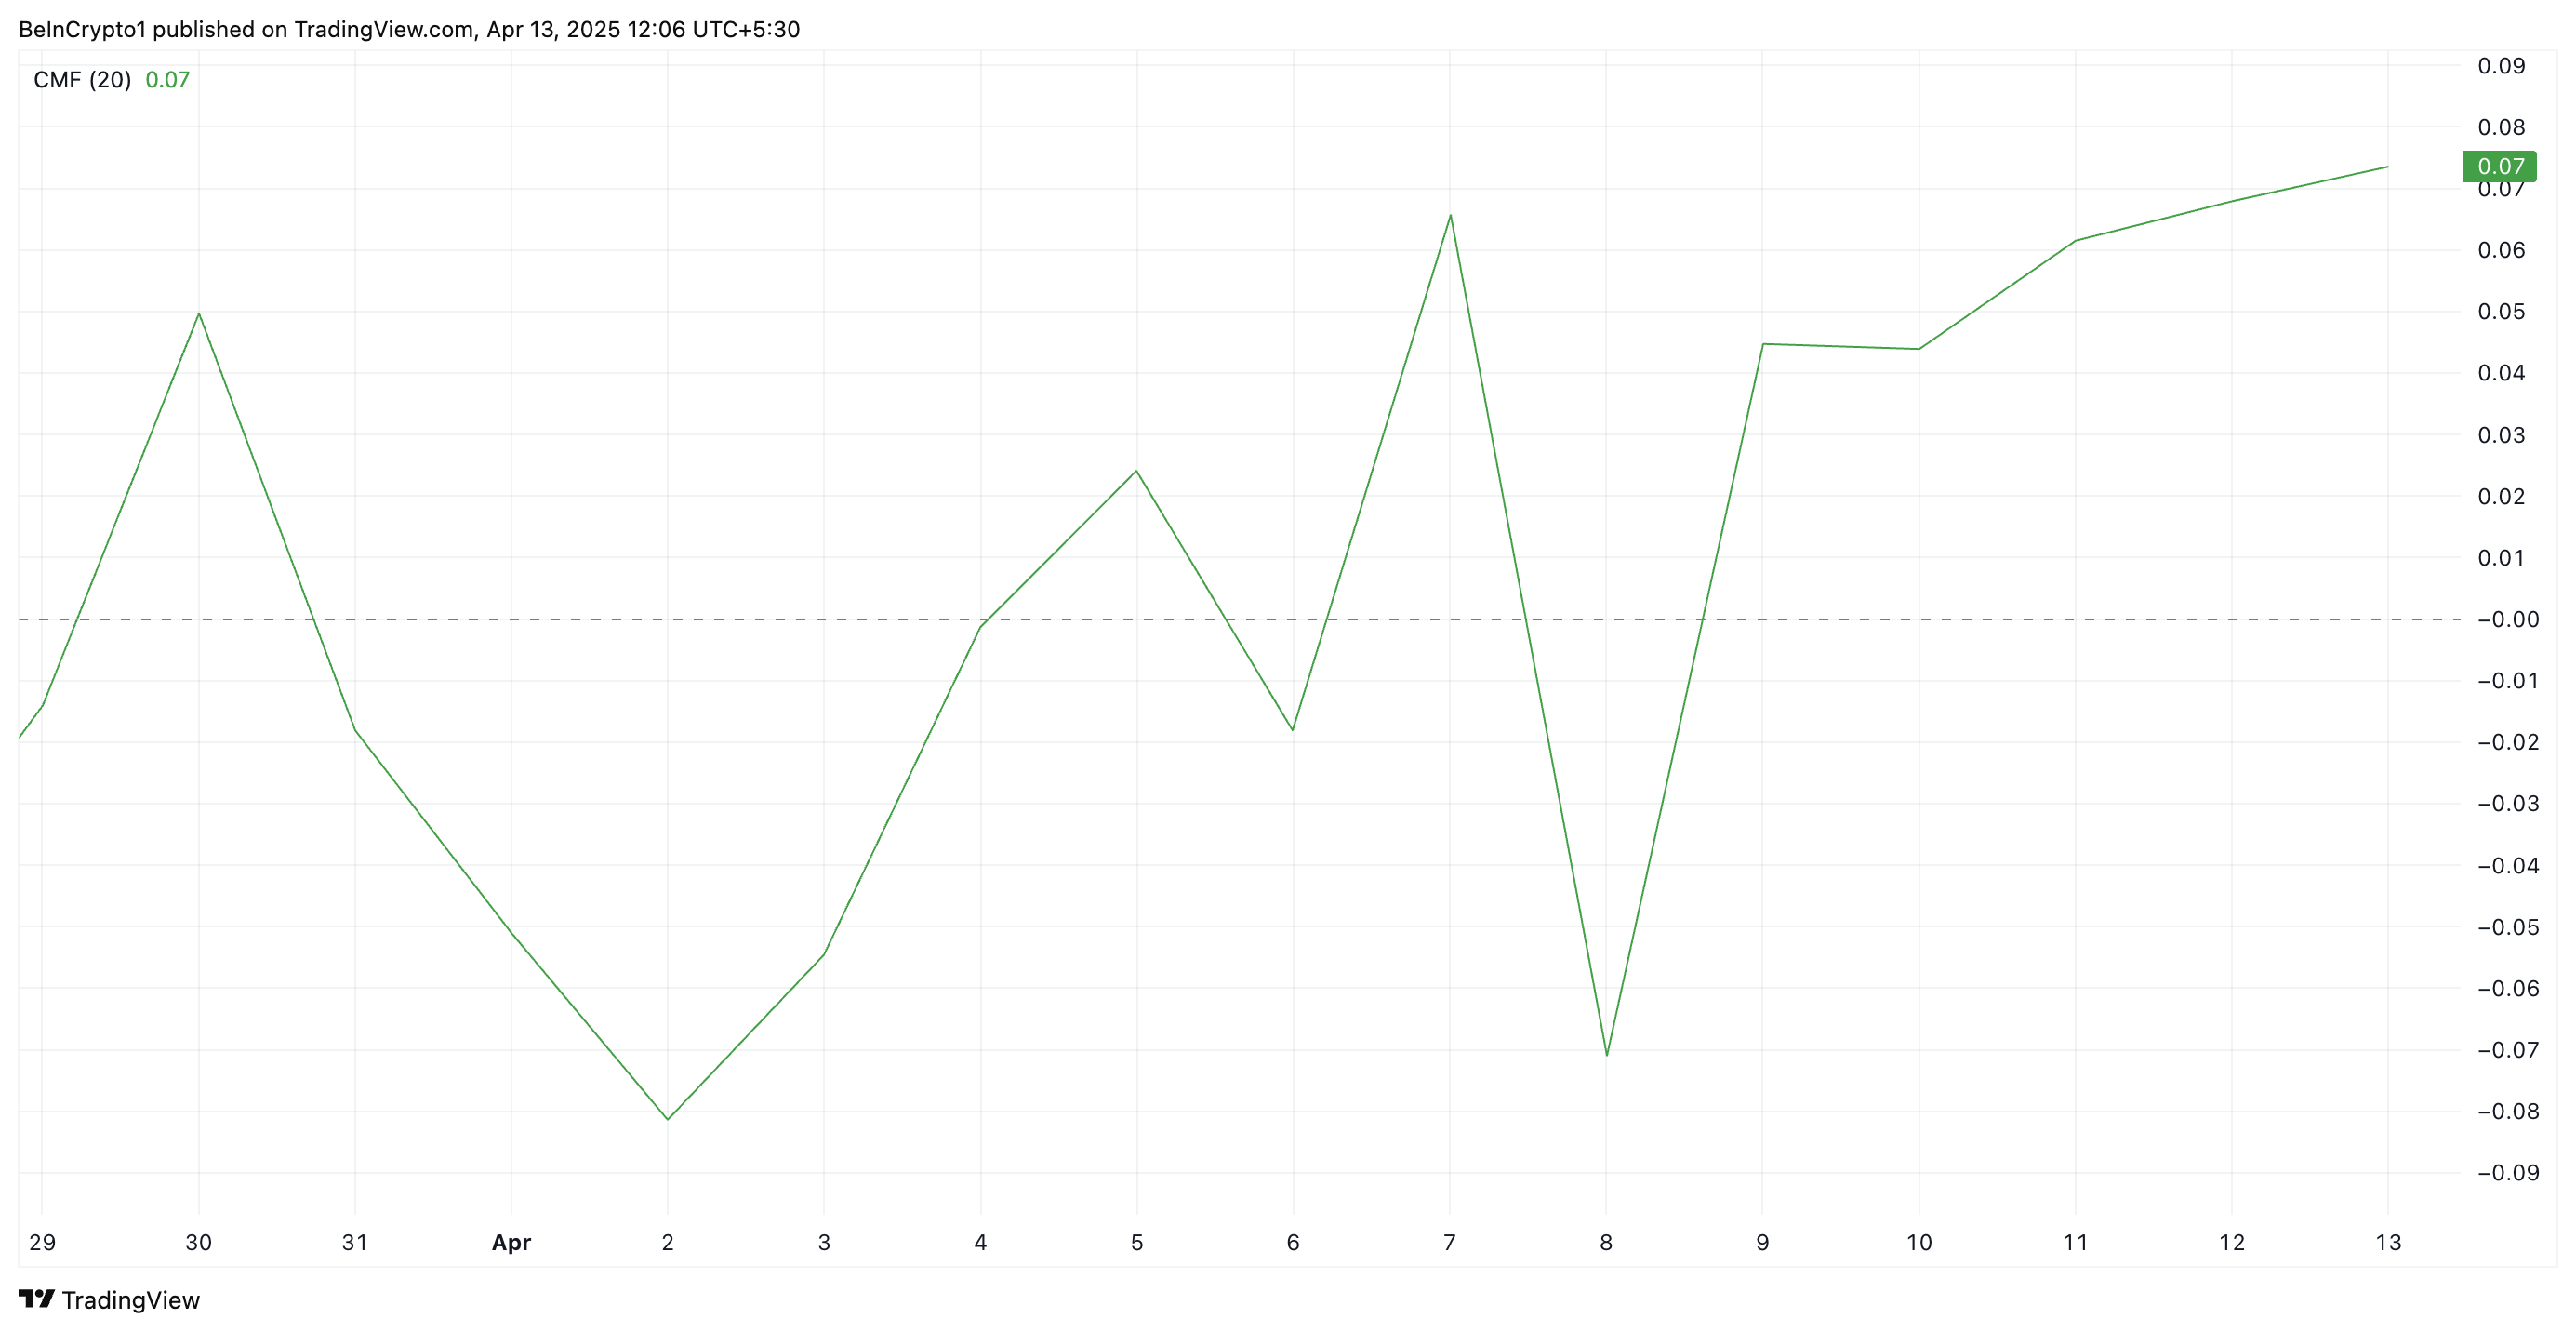
The CMF indicator measures how money flows into and out of an asset. A positive CMF reading, as with XRP, means buying pressure is stronger than selling pressure over a given period. It suggests capital is flowing into the token, signaling accumulation and potential price growth.
XRP Maintains Uptrend—Next Stop: $2.50 or Back to $1.99?
Since its rally began on April 7, XRP has traded above an ascending trend line. This bullish pattern emerges when an asset forms higher lows over time, creating an upward-sloping support line.
It signals sustained buying interest in XRP and suggests that momentum is building in favor of the bulls as the token’s price continues to climb.
If demand soars, XRP could extend its gains and climb to $2.29. A successful flip of this resistance into a support floor could propel XRP to $2.50.
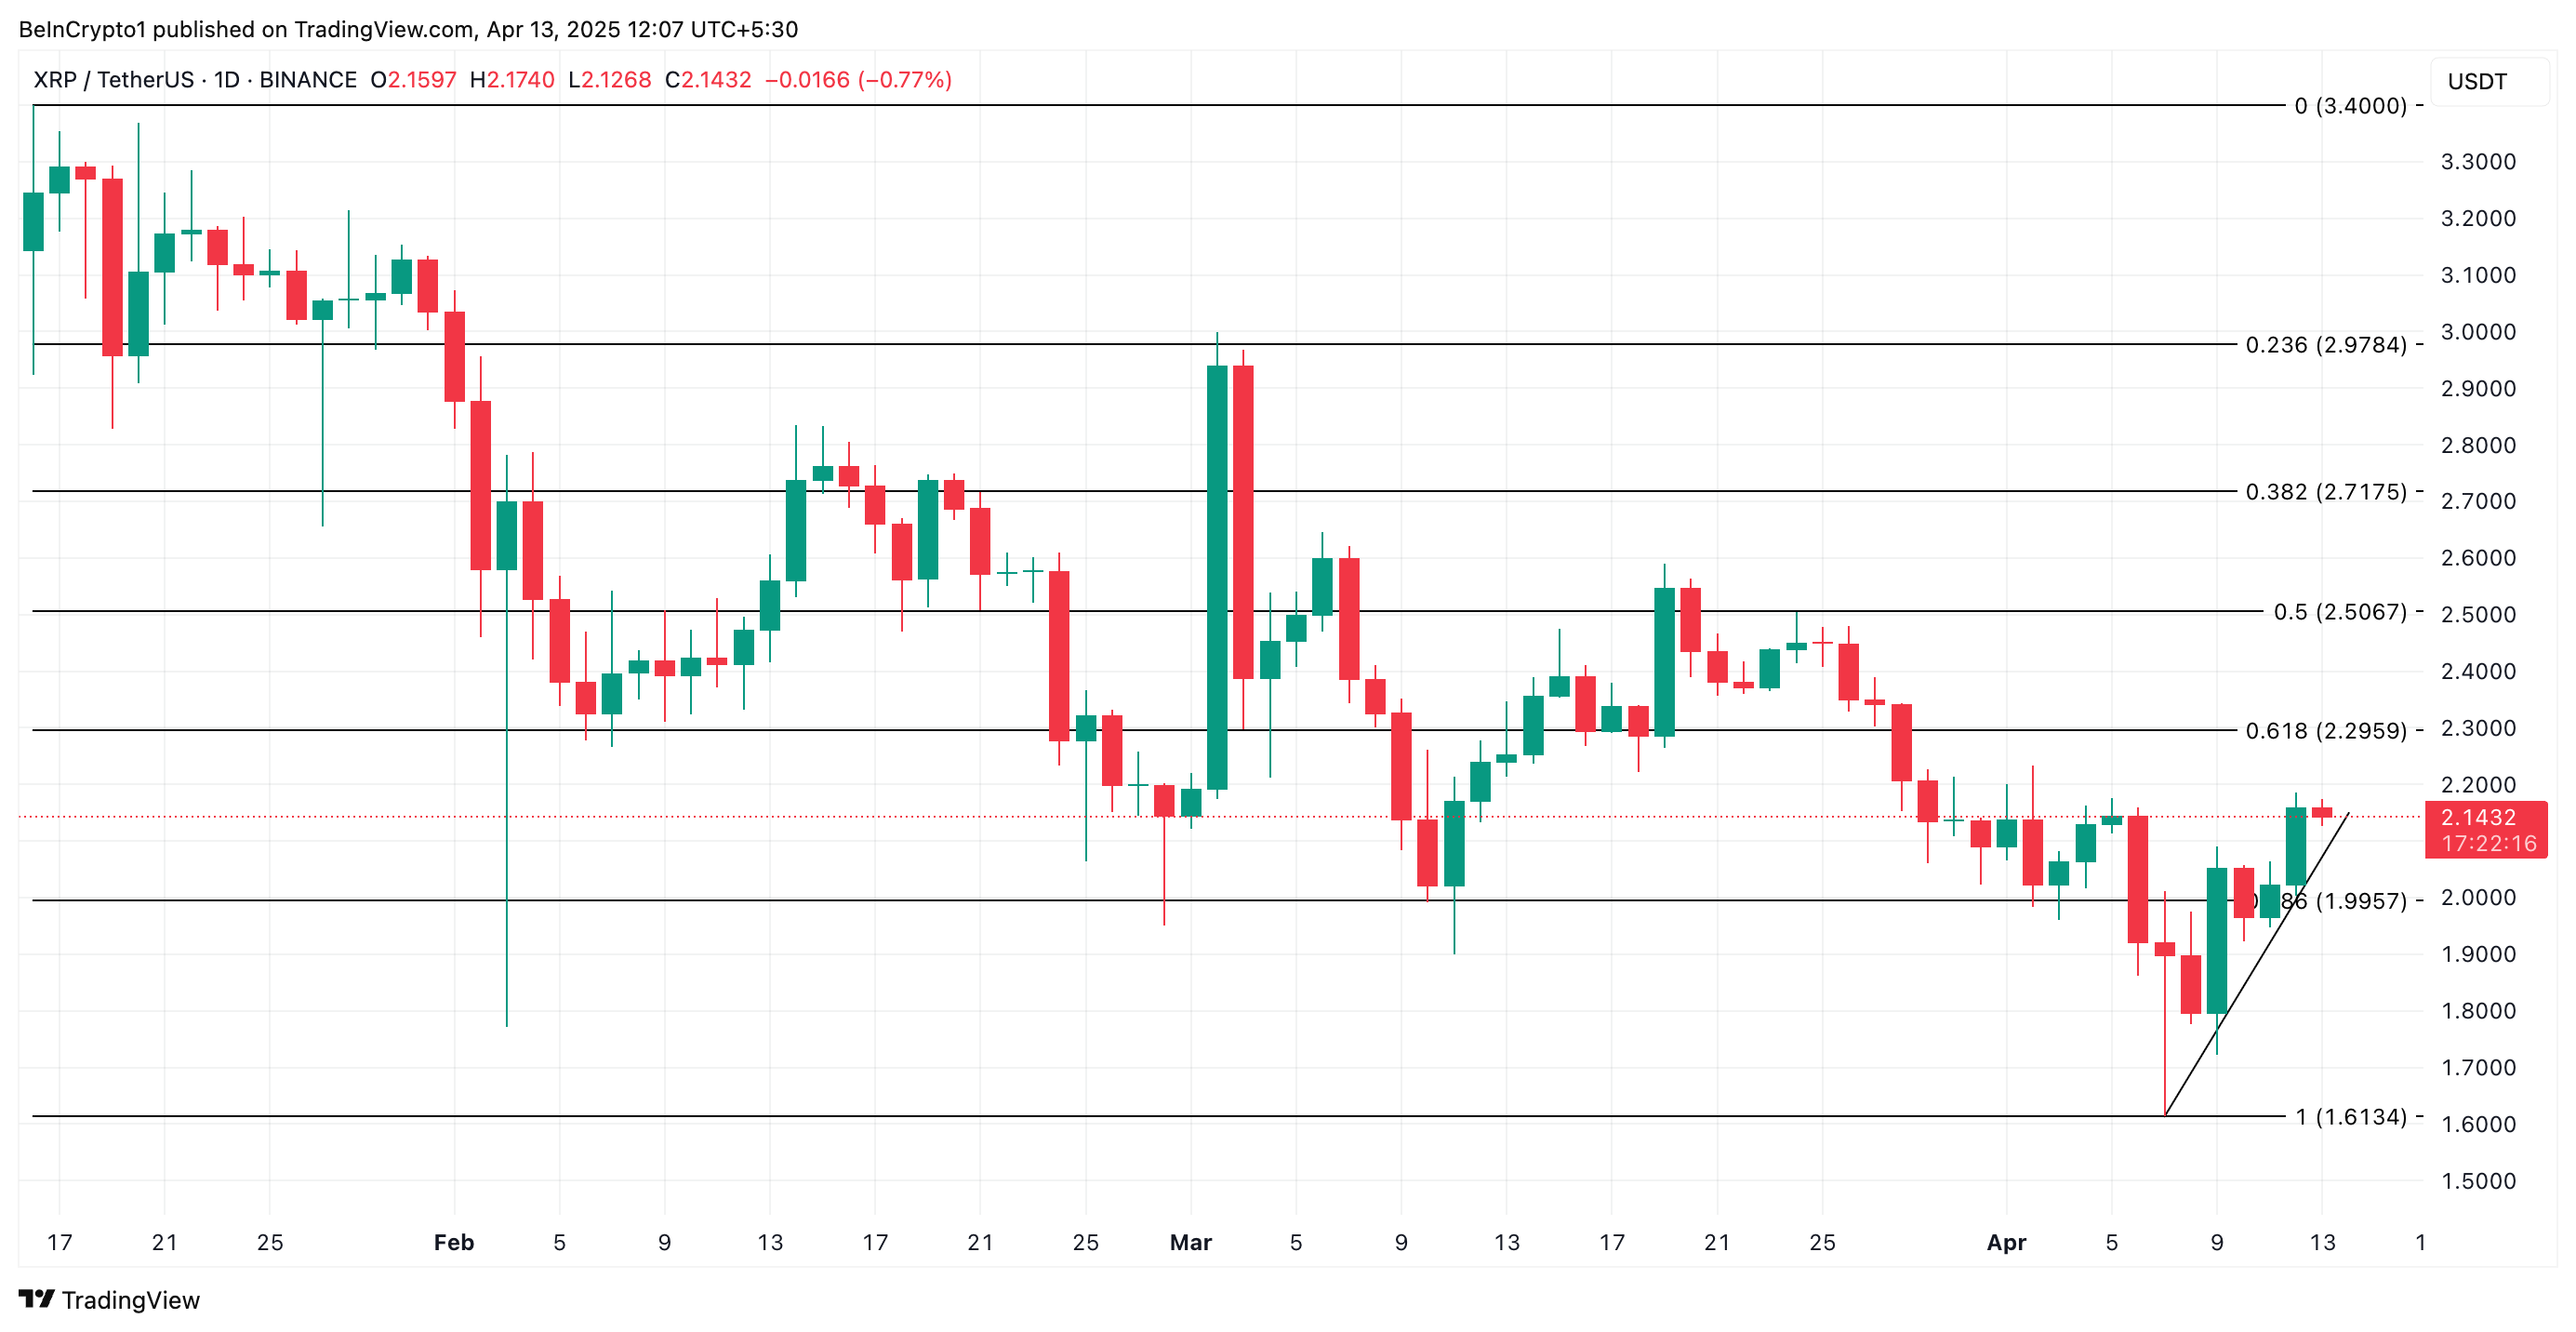
However, if profit-taking resumes and selling pressure rises, XRP could reverse its uptrend and fall to $1.99.
Disclaimer
In line with the Trust Project guidelines, this price analysis article is for informational purposes only and should not be considered financial or investment advice. BeInCrypto is committed to accurate, unbiased reporting, but market conditions are subject to change without notice. Always conduct your own research and consult with a professional before making any financial decisions. Please note that our Terms and Conditions, Privacy Policy, and Disclaimers have been updated.

DOGE Spot Outflows Exceed $120 Million in April

Ethereum Reclaims Key Support At $1,574, Here’s The Next Price Target

PI Coin Recovers 80% From All-time Low — Will It Retake $1?

CryptoQuant CEO Says Bitcoin Bull Cycle Is Over, Here’s Why

XRP Golden Cross Creates Bullish Momentum: Is $2.50 Next?

Satoshi Nakamoto Turns 50 — Still No Idea Who He Is

2.52 Million Altcoins Are Ruining Crypto’s Future

Animoca Brands Valuation Tanks 75% In Two Years, Here’s Why

Crypto exchange BingX hacked for $43 million

Are The Big Players Losing Interest?

Hong Kong’s Securities Association Tips Authorities On Crypto Self-Regulation

Coinbase cbBTC Set to go Live on Solana
2.52 Million Altcoins Are Ruining Crypto’s Future
Animoca Brands Valuation Tanks 75% In Two Years, Here’s Why
Crypto exchange BingX hacked for $43 million
Are The Big Players Losing Interest?
Hong Kong’s Securities Association Tips Authorities On Crypto Self-Regulation
Coinbase cbBTC Set to go Live on Solana
-

 Market23 hours ago
SEC Signals Readiness to Rethink Crypto Trading Oversight
-

 Market22 hours ago
Ethereum ETFs See Seventh Consecutive Week of Net Outflows
-

 Bitcoin22 hours ago
Bitcoin’s Impact Alarming, Says NY Atty. General—Congress Needs To Act
-
 Altcoin20 hours ago
Bankless Cofounder David Hoffman Reveals Strategy To Improve Ethereum Price Performance
-

 Bitcoin16 hours ago
Bitcoin Price Volatility Far Lower Than During COVID-19 Crash — What This Means
-

 Market20 hours ago
Solana Bulls Lead 17% Recovery, Targeting $138
-

 Market17 hours ago
XRP Price To Hit $45? Here’s What Happens If It Mimics 2017 And 2021 Rallies
-

 Ethereum17 hours ago
Ethereum (ETH) Consolidates Within Tight Range As Key Support Level Forms