
Market
HBAR Buyers Fuel Surge with Golden Cross, Suggesting Upside

Hedera’s HBAR has bucked the broader market dip to record a slight 1% rally over the past 24 hours. As of this writing, the altcoin trades at $0.17.
This upward movement comes amidst signs of a resurgence in new demand for the altcoin, as highlighted by key technical indicators on the daily chart.
HBAR Bullish Trend Gains Strength
Readings from HBAR’s Moving Average Convergence Divergence (MACD) reveal that on April 9, the token’s MACD line (blue) climbed above its signal line (orange), forming a “golden cross.”
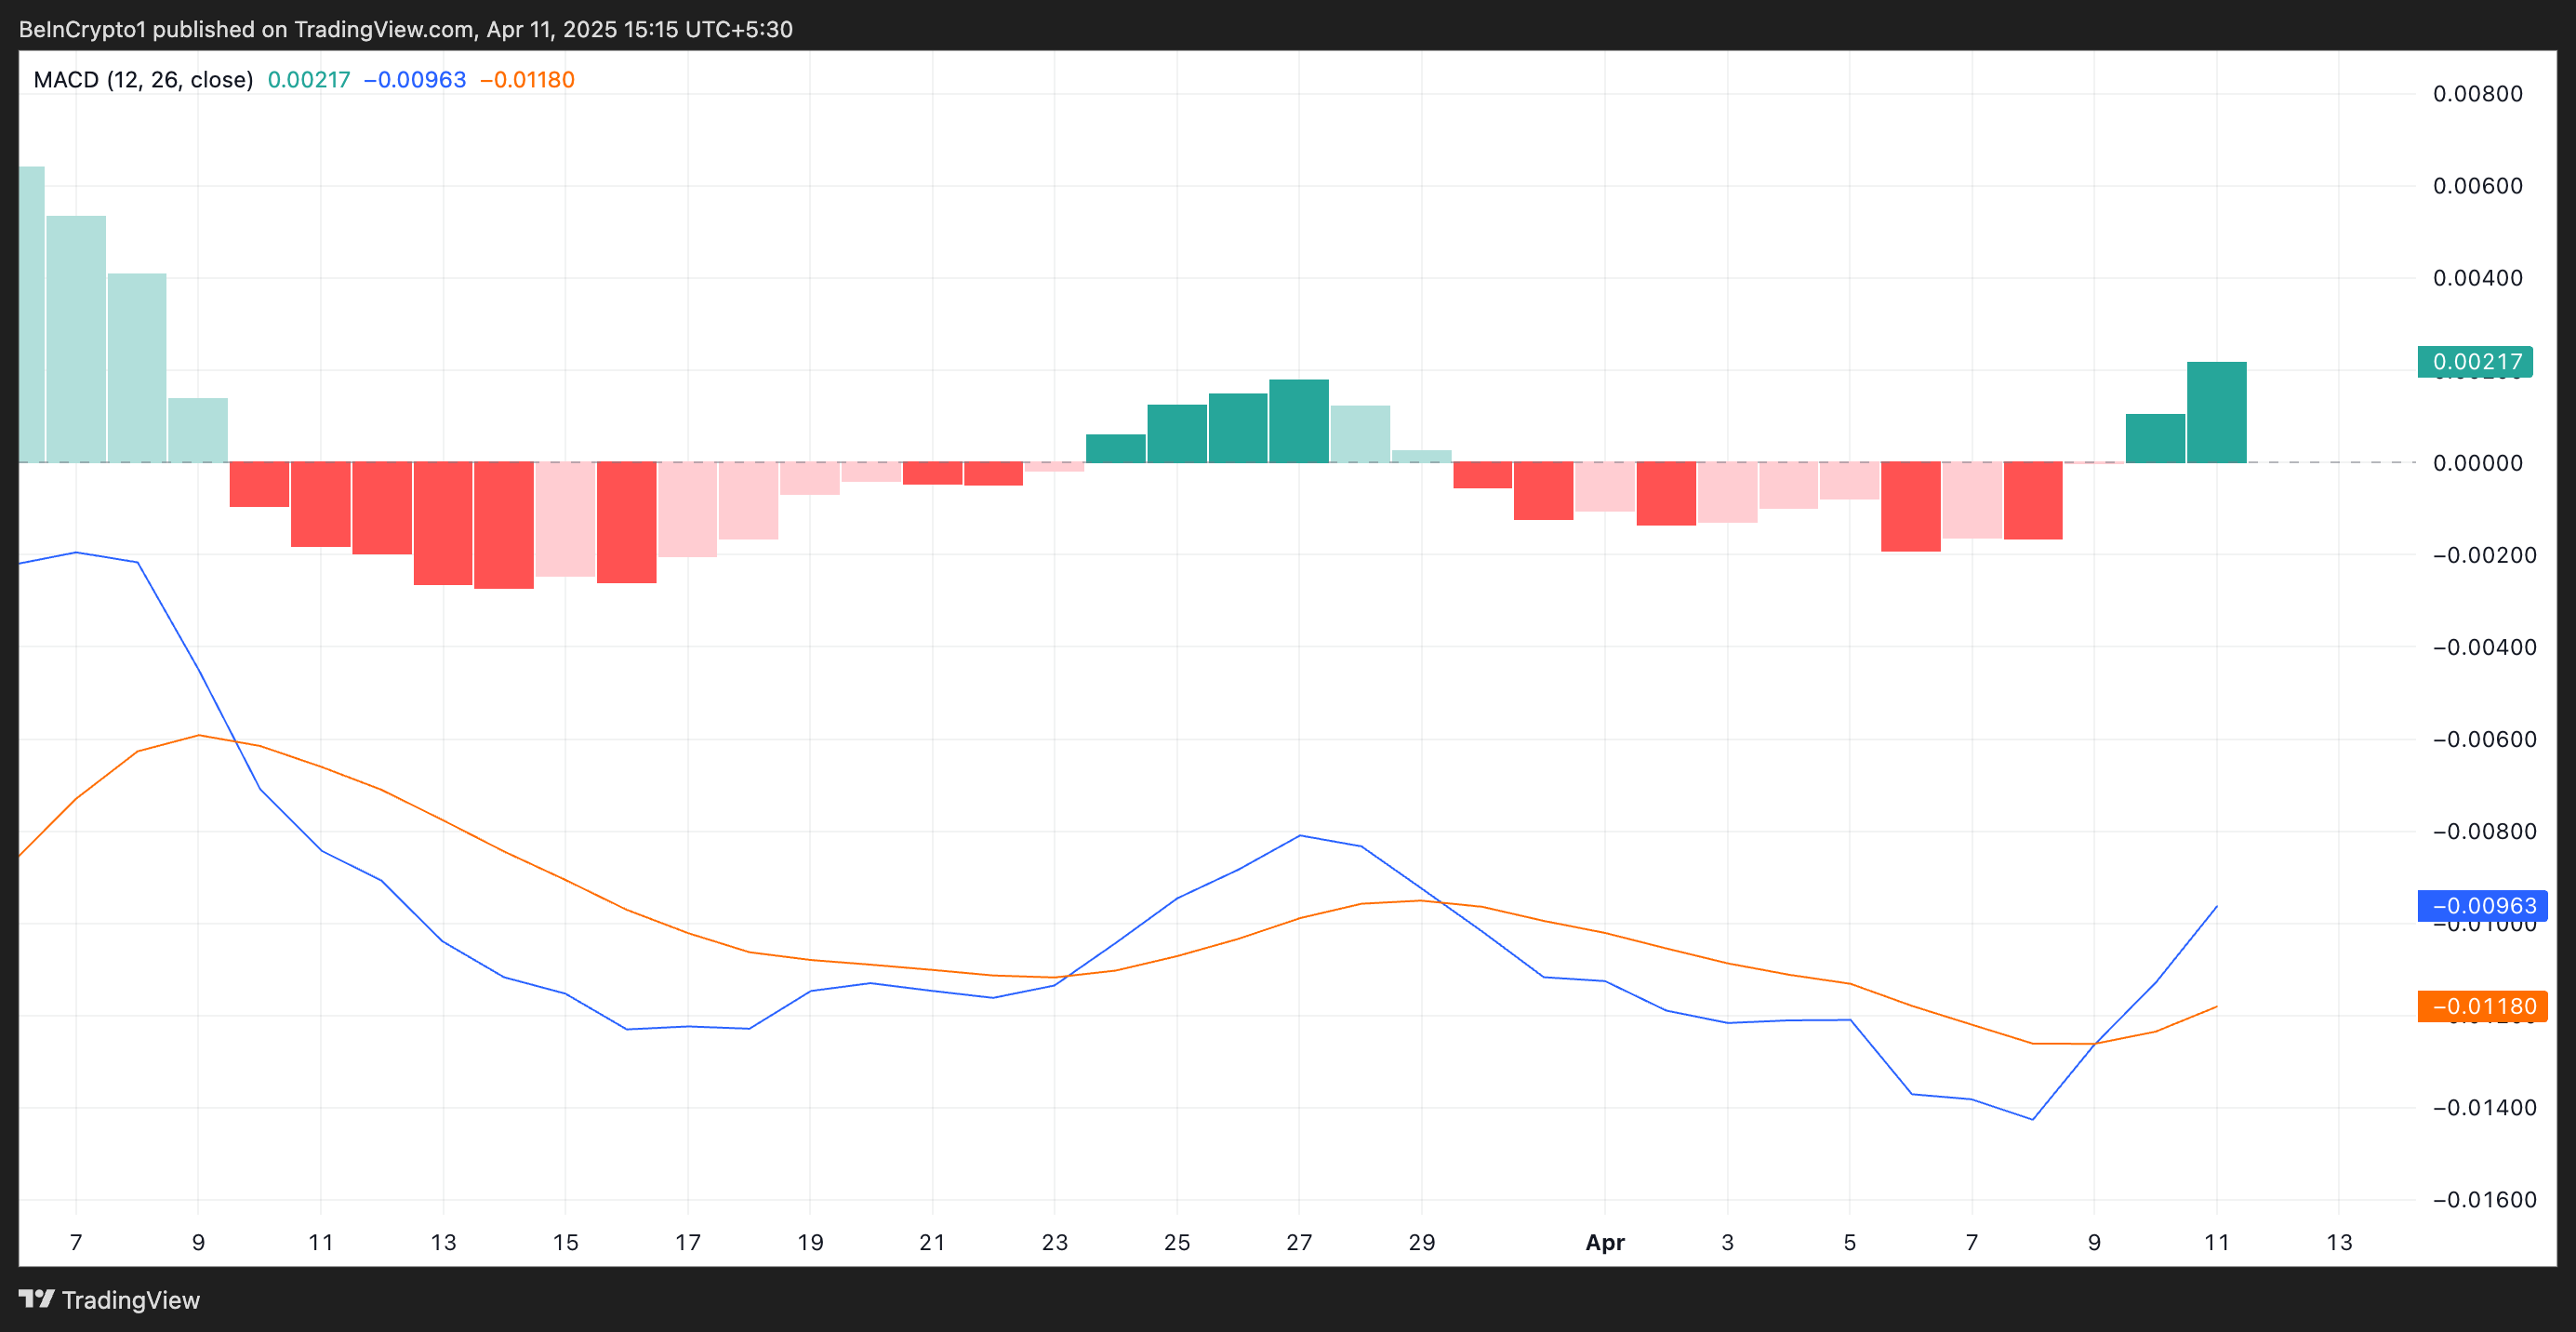
A golden cross occurs when the MACD line crosses above the signal line, signaling a potential bullish trend and increased buying pressure. This confirms that HBAR’s upward momentum is gaining strength, especially as investors commonly view this pattern as a buy signal.
Moreover, as of this writing, HBAR’s Relative Strength Index (RSI) is poised to break above the 50-neutral line, highlighting the spike in fresh demand for the altcoin. It is currently at 49.17 and remains in an uptrend.
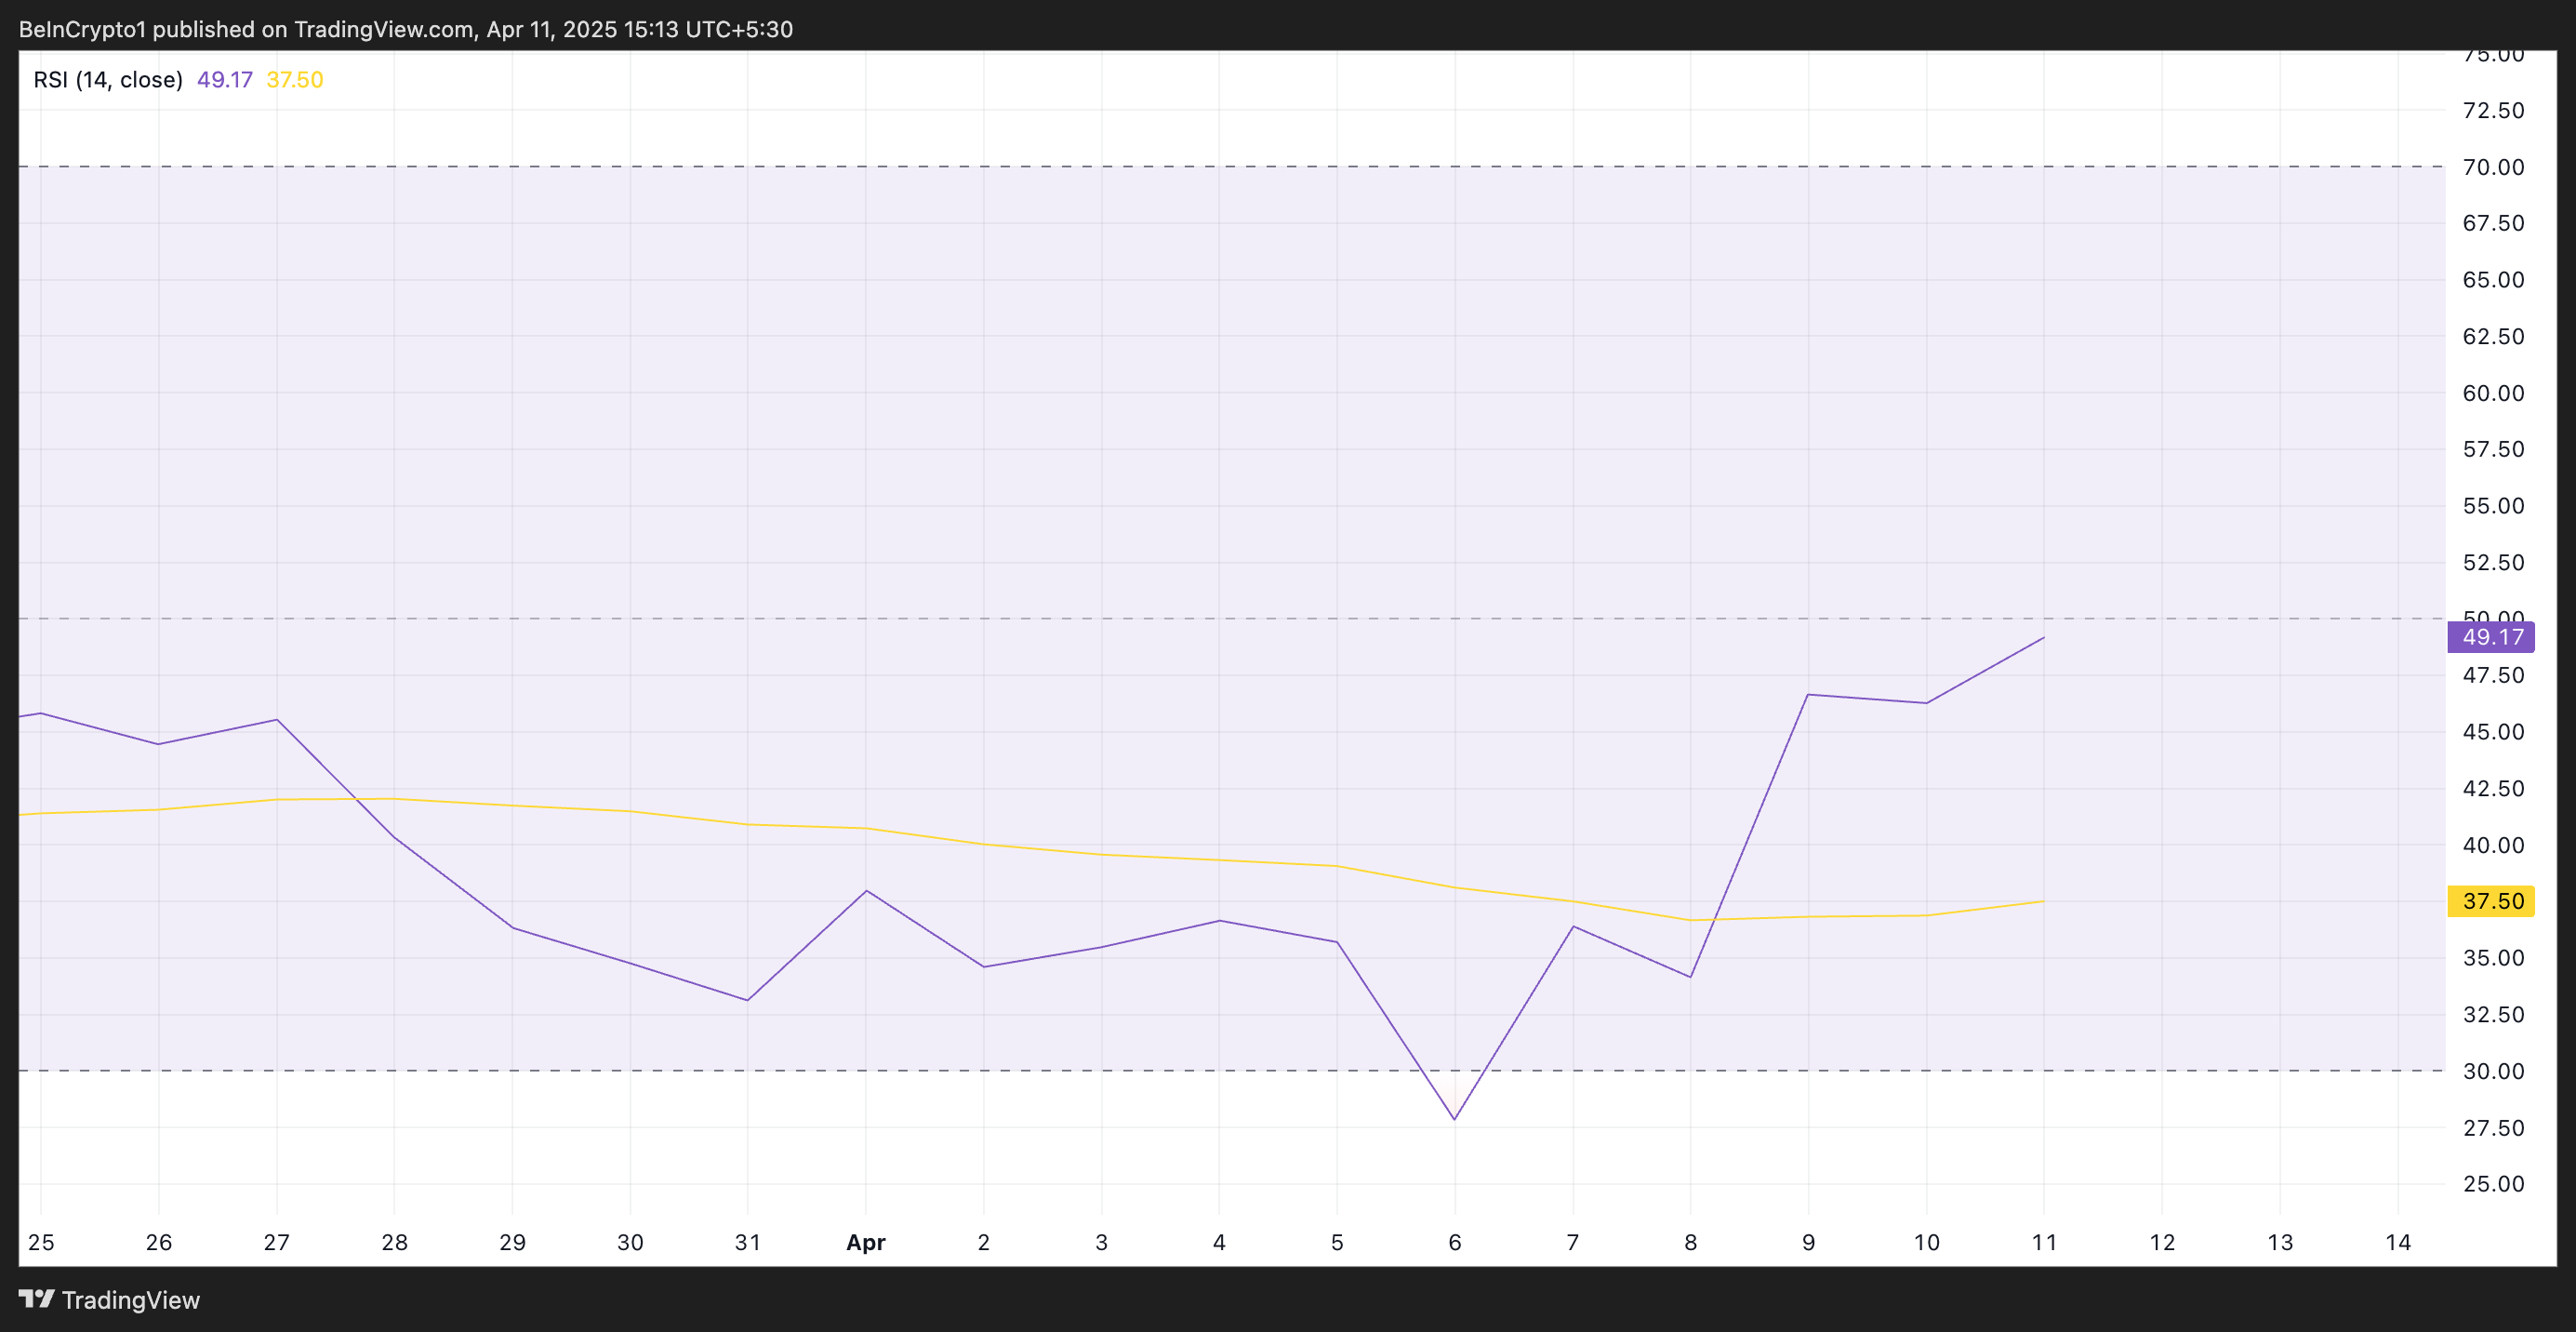
The RSI indicator measures an asset’s overbought and oversold market conditions. It ranges between 0 and 100. Values above 70 suggest that the asset is overbought and due for a price decline, while values under 30 indicate that the asset is oversold and may witness a rebound.
At 49.17 and climbing, HBAR’s RSI signals a gradual shift from bearish territory into a more neutral zone. If the altcoin’s RSI continues to rise above 50, it would signal increasing bullish sentiment, driving up HBAR’s value.
HBAR Eyes $0.19 Amid Strong Buying Pressure
HBAR’s surge over the past day has pushed its price above the key resistance formed at $0.16, which has kept the token in a downtrend since March 30.
With growing buying pressure, the token could flip this zone into a support floor. If successful, it could propel HBAR’s price to $0.19.
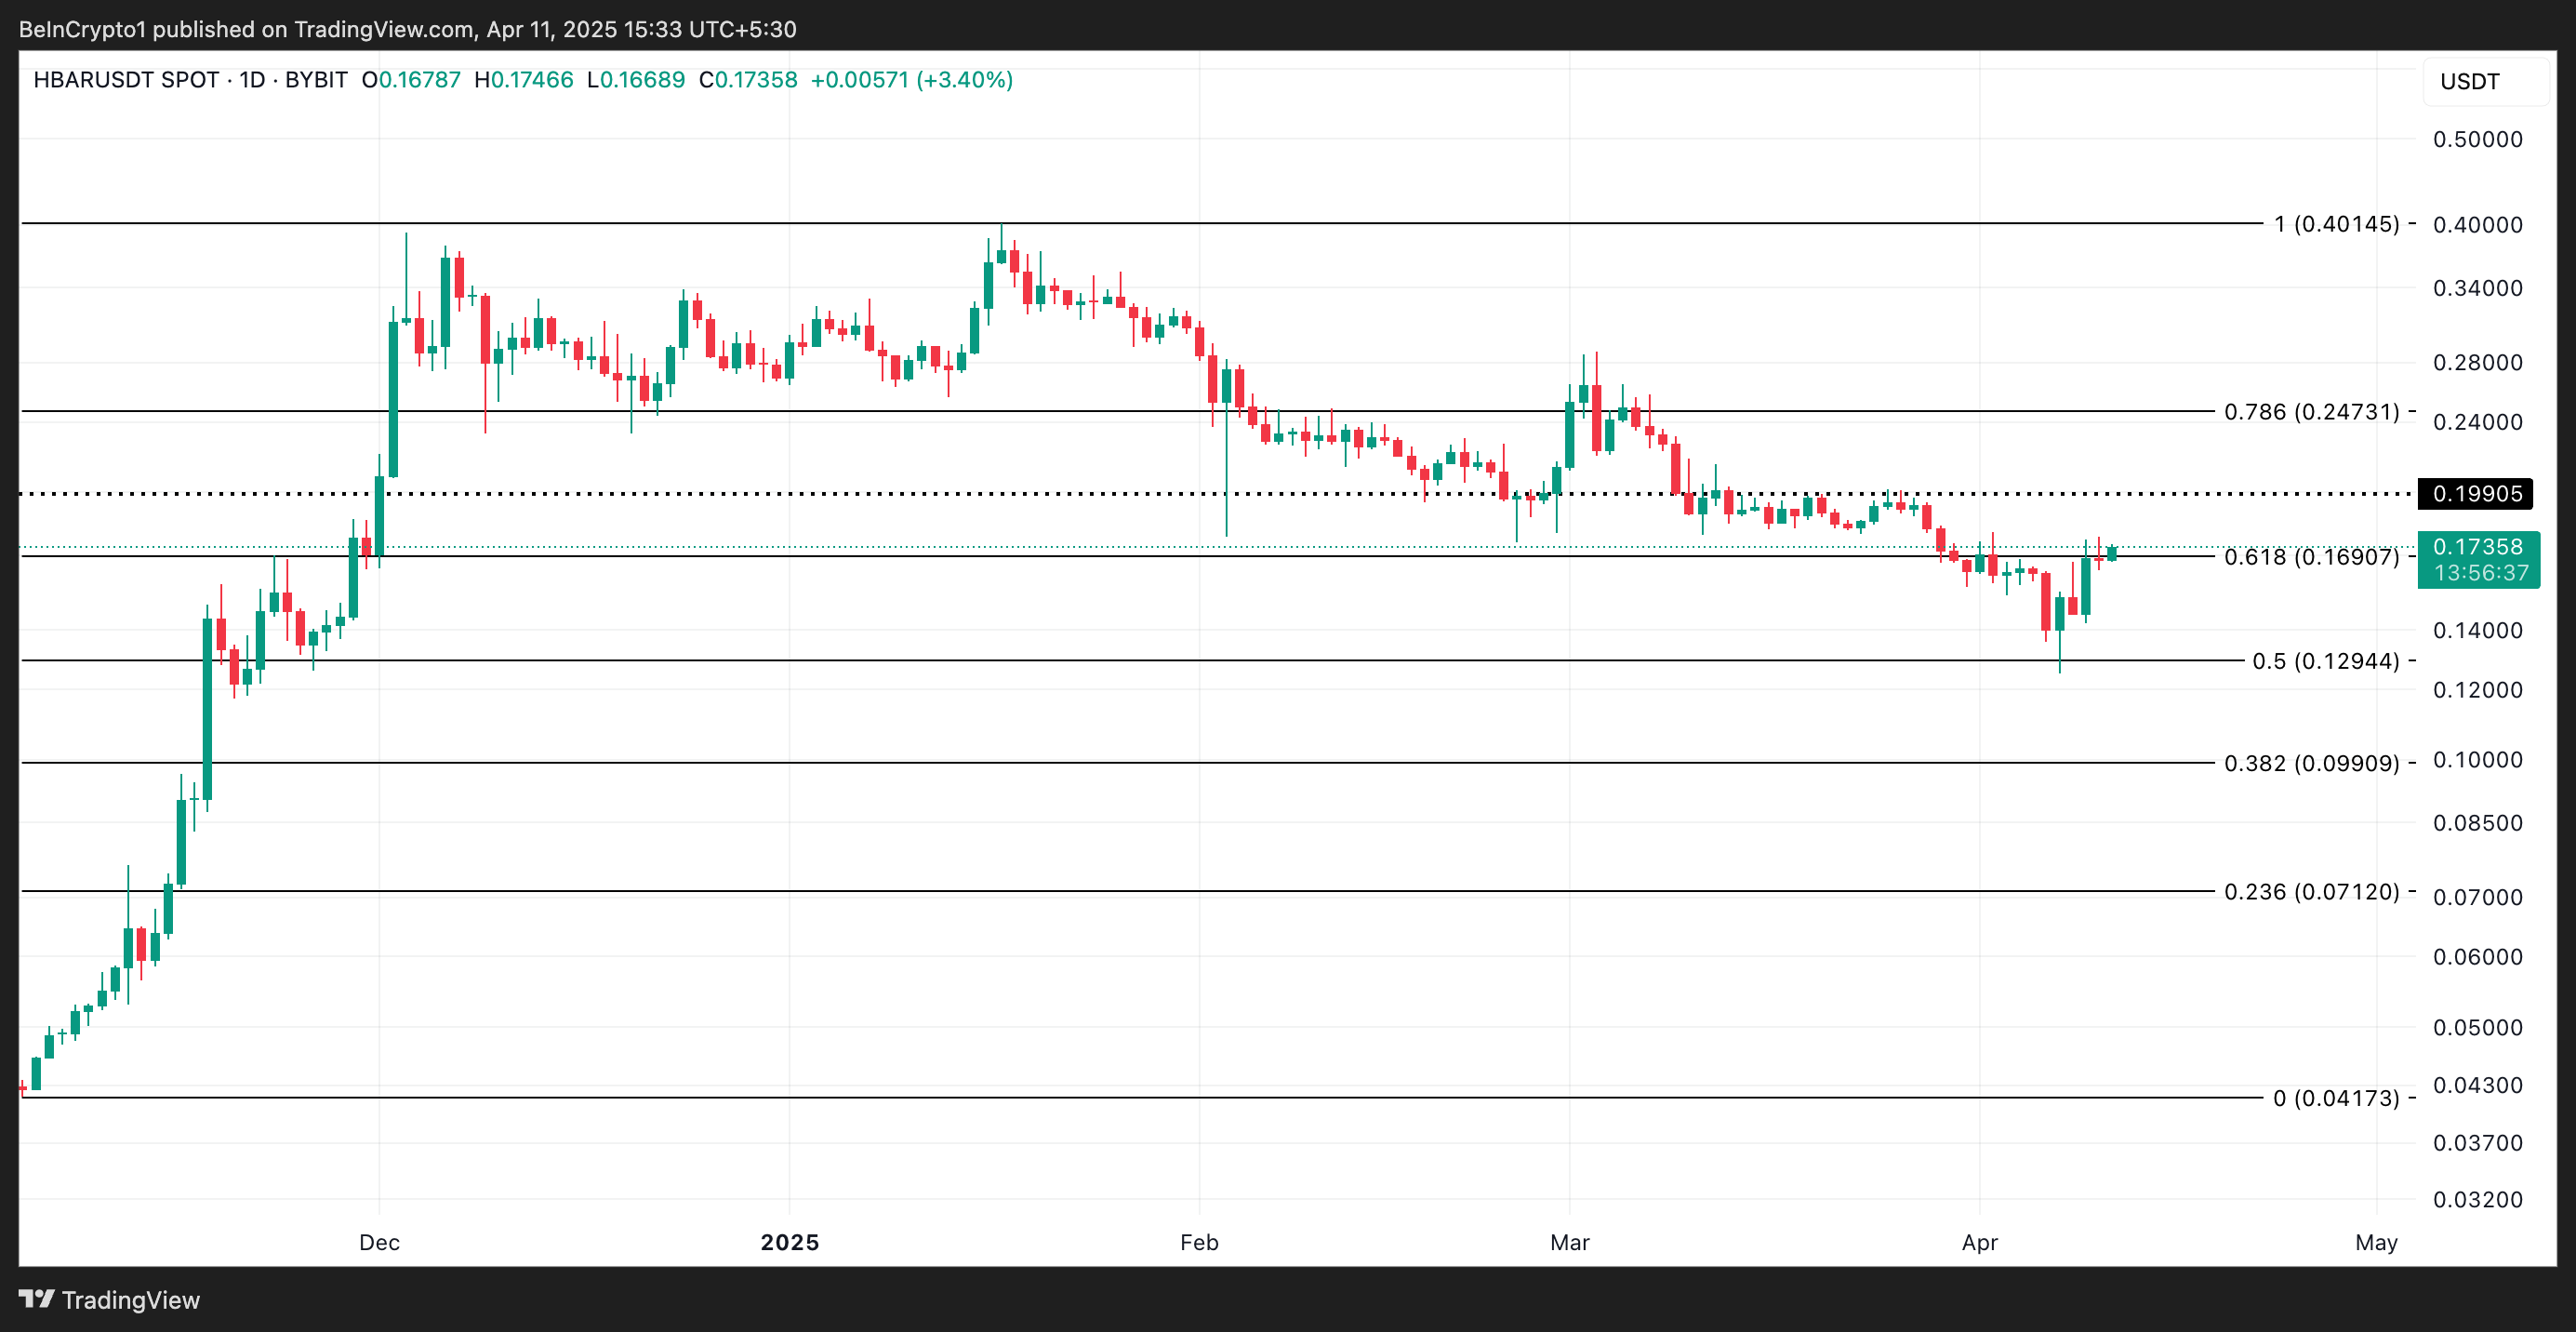
However, if traders resume profit-taking, HBAR’s current rally would halt, and the token’s price could fall below $0.16 and decline toward $0.12.
Disclaimer
In line with the Trust Project guidelines, this price analysis article is for informational purposes only and should not be considered financial or investment advice. BeInCrypto is committed to accurate, unbiased reporting, but market conditions are subject to change without notice. Always conduct your own research and consult with a professional before making any financial decisions. Please note that our Terms and Conditions, Privacy Policy, and Disclaimers have been updated.


Shaw, the founder of AI16Z, announced on X that Auto.fun, a new token launchpad platform, is set to launch this week.
In a market witnessing fierce competition between major platforms such as Pump.fun (Solana), SunPump (Tron), and Launchlabs (Raydium), how will Auto.fun hold up?
Auto.fun: The Promise of a Newcomer
Led by AI16Z’s Shaw, Auto.fun aims to create a decentralized platform. It allows content creators and communities to truly own their space. Slated for release this week, Auto.fun’s mission is to build a “transparent and decentralized” ecosystem.
It stands apart from traditional launchpads often criticized for opacity and control by small developer groups.
“Open source launchpad where creators claim the fees, community can coordinate and create content or CTO tokens from other platforms,” Shaw stated.
Auto.fun’s standout feature is its “anti-pump” and “ultra-fun” approach, as described by Shaw. Beyond merely issuing tokens, the platform seeks to foster a creative environment where communities and creators can collaboratively develop content and tokens sustainably.
The Launchpad Market: Decline and Fierce Competition
Auto.fun enters the market at a challenging time. The token launchpad sector is witnessing a decline among major players.
Pump.fun, a leading name, has faced significant hurdles recently. Its revenue has plummeted by 95%, with the platform transferring SOL to exchanges, possibly signaling mass capital withdrawal. In early 2025, Pump.fun’s daily revenue was $14 million.
Competition in the launchpad market is intensifying. Alongside Pump.fun, platforms like SunPump (Tron) and Launchlabs (Raydium) dominate with distinct strategies, making it a tough environment for newcomers.
Despite these obstacles, Auto.fun has a chance to make its mark by leveraging its unique strengths. First, its “decentralized and transparent” approach is a bright spot, as launchpads are often criticized for manipulation and lack of clarity.
Second, Auto.fun’s launch aligns with a market seeking fresh alternatives to struggling platforms like Pump.fun. The latter’s declining revenue and trust, coupled with competition from SunPump, Launchlabs or Hypurr.fun, create an opening for Auto.fun to shine—if it can deliver a superior user experience, lower costs, or innovative features. Pump.fun is also trying to introduce new features to its users.
In the volatile crypto market 2025, Auto.fun must swiftly prove its value to survive in the cutthroat launchpad race.
Disclaimer
In adherence to the Trust Project guidelines, BeInCrypto is committed to unbiased, transparent reporting. This news article aims to provide accurate, timely information. However, readers are advised to verify facts independently and consult with a professional before making any decisions based on this content. Please note that our Terms and Conditions, Privacy Policy, and Disclaimers have been updated.

Layer-1 (L1) coin FLR has climbed 19% over the past 24 hours to rank as the top gainer in the crypto market today.
This marks another strong day in what has become a week-long rally, pushing FLR’s price to a new weekly high of $0.018, a 57% increase over the past seven days.
Flare Bullish Rally Gains Steam
Since April 9, FLR has made new daily highs, indicating strong bullish momentum. The coin’s Relative Strength Index (RSI), which is in an upward trend and at 67.13 at press time, confirms this positive outlook.
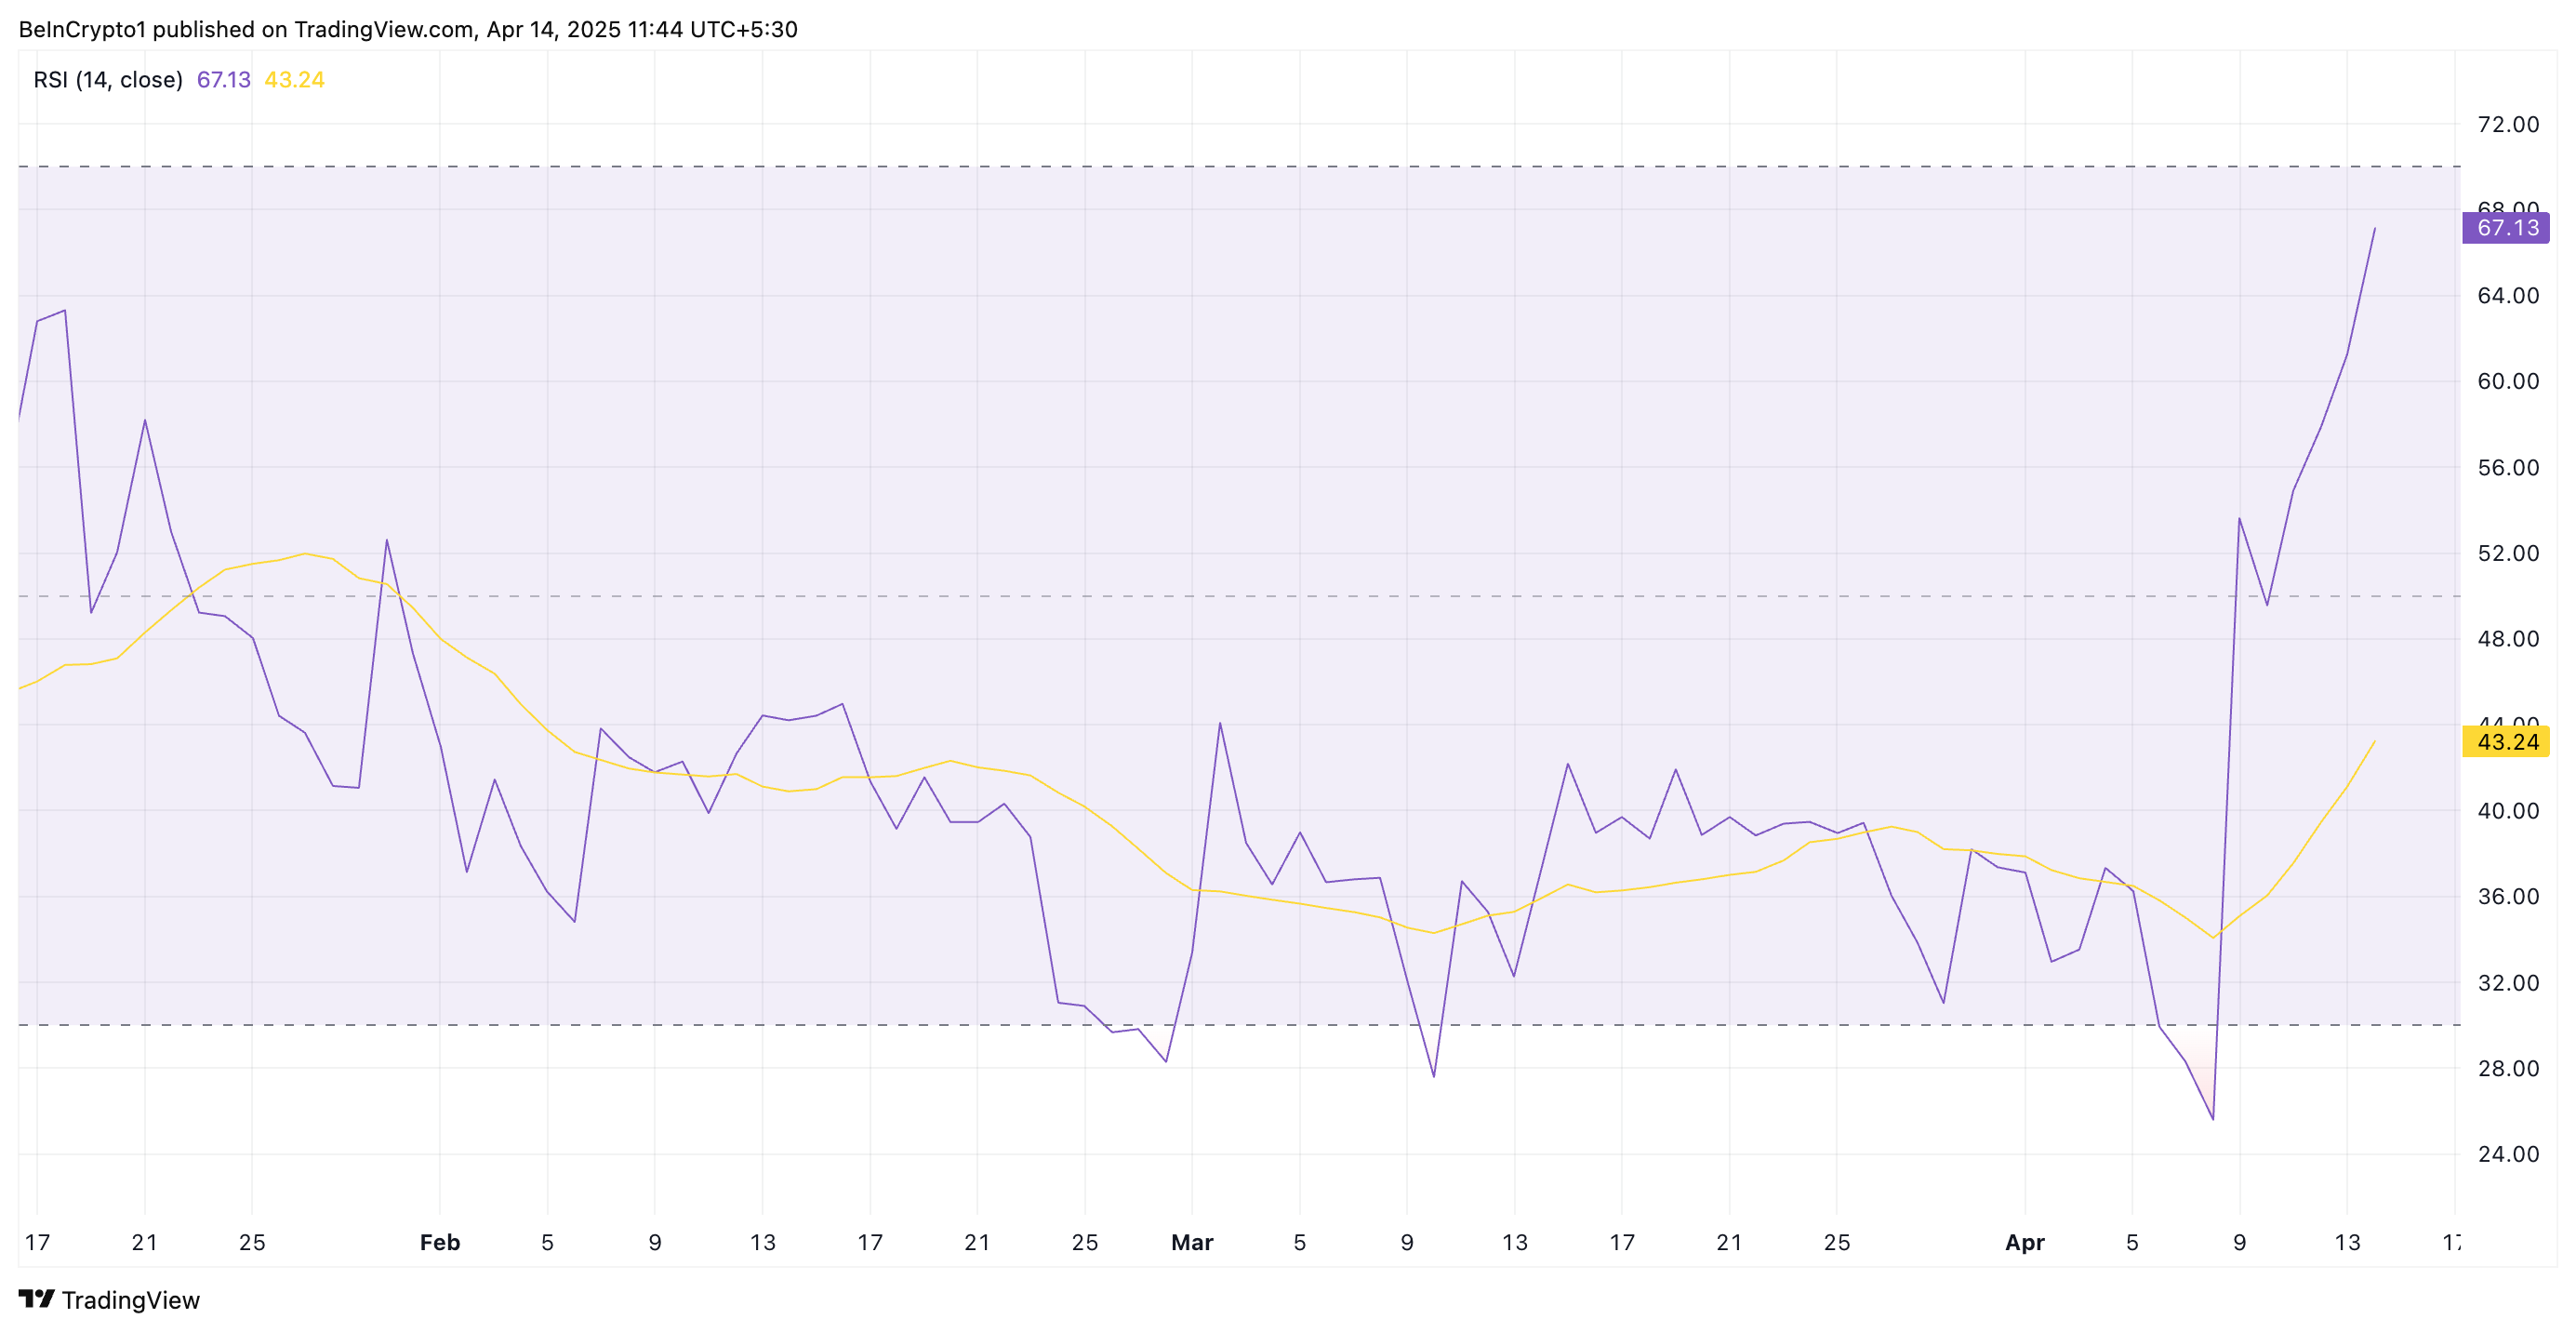
The RSI indicator measures an asset’s overbought and oversold market conditions. It ranges between 0 and 100. Values above 70 suggest that the asset is overbought and due for a price decline, while values under 30 indicate that the asset is oversold and may witness a rebound.
At 67.13, FLR’s RSI indicates that the buying pressure significantly exceeds selling activity among its spot market participants. It suggests there is still room for further gains before the altcoin becomes overbought and due for a correction.
Moreover, for the first time since January 26, the histogram bars that make up FLR’s Awesome Oscillator (AO) have flipped above the zero line and continue to grow taller. This reflects the strengthening bullish sentiment amongst FLR holders.

The AO indicator measures an asset’s market trends and potential reversals. It comprises a histogram bar chart that visually represents the difference between a short-term and long-term moving average. When the bars are below zero, it suggests that short-term momentum is weaker, indicating bearish pressure.
On the other hand, as with FLR, when the AO bars flip above the zero line and continue trending upward, it signals that bullish momentum is not just present but also growing. This hints at further price gains for FLR if other market conditions align.
Bulls Push Through Resistance, But Profit-Taking Could Halt Gains
FLR’s double-digit rally over the past day has pushed its price above the key resistance formed at $0.016. Should this price point offer a strong support floor for FLR, it could extend its gains and climb to $0.021.
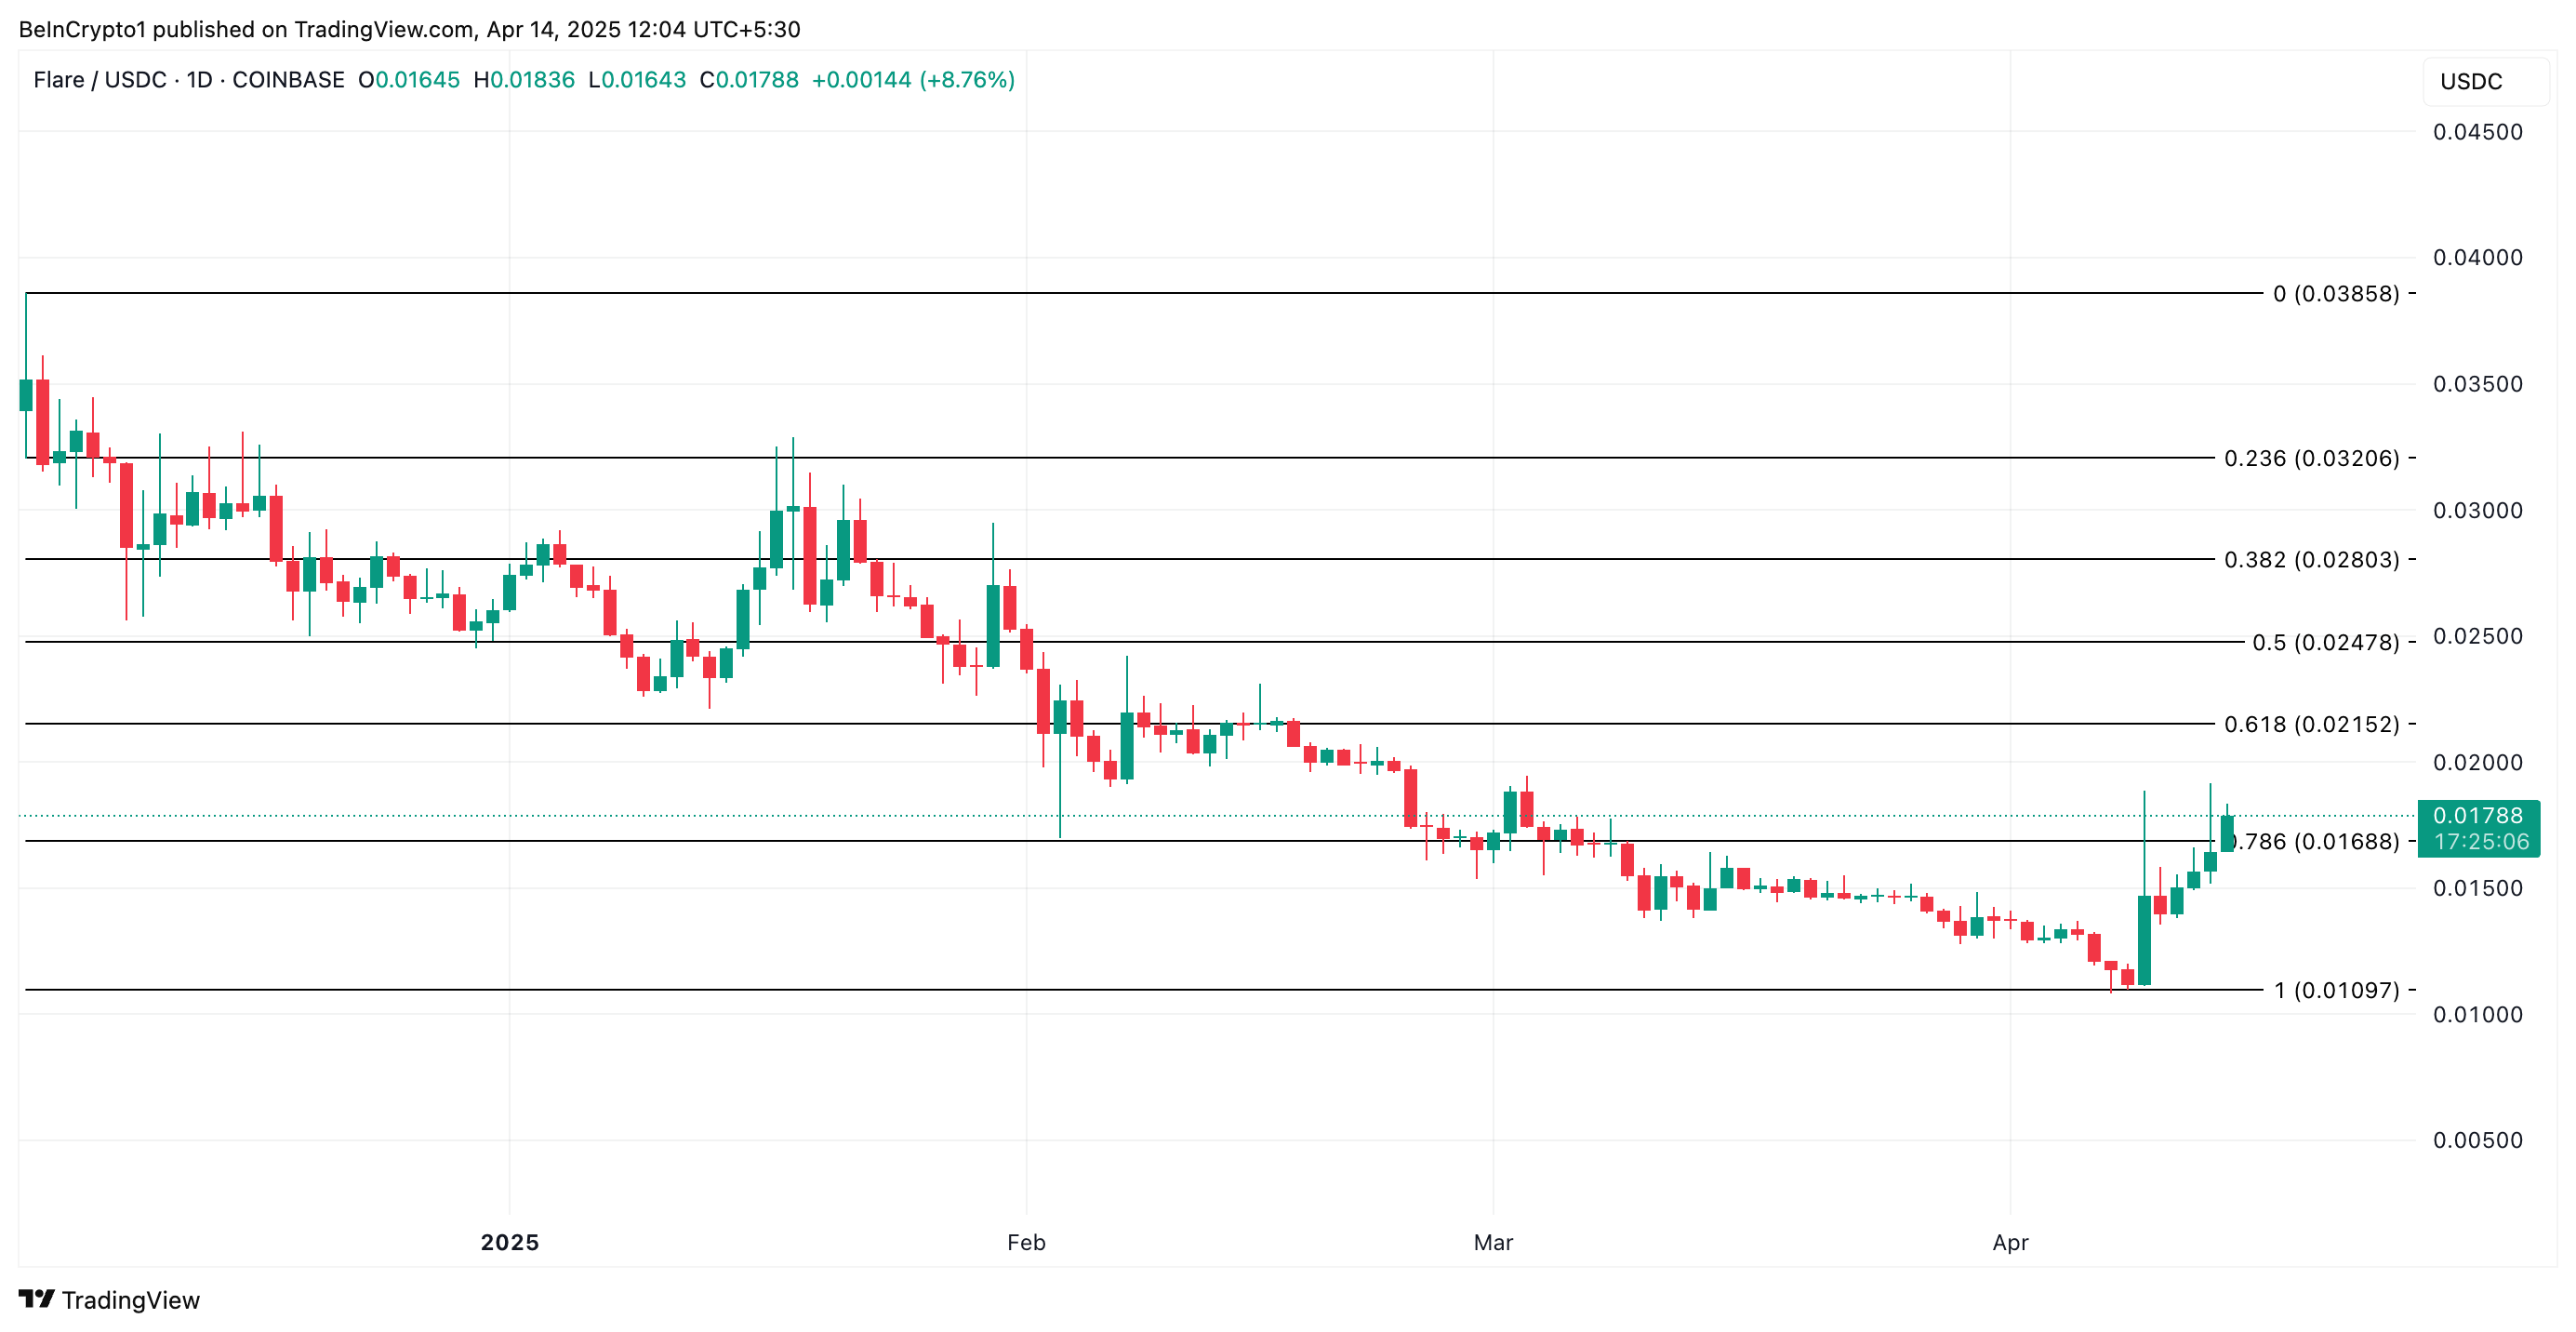
However, a resurgence in profit-taking activity will invalidate this bullish projection. In that case, the altcoin’s price could break below $0.016 and fall toward $0.010.
Disclaimer
In line with the Trust Project guidelines, this price analysis article is for informational purposes only and should not be considered financial or investment advice. BeInCrypto is committed to accurate, unbiased reporting, but market conditions are subject to change without notice. Always conduct your own research and consult with a professional before making any financial decisions. Please note that our Terms and Conditions, Privacy Policy, and Disclaimers have been updated.
Reason to trust
![]()
Strict editorial policy that focuses on accuracy, relevance, and impartiality
Created by industry experts and meticulously reviewed
The highest standards in reporting and publishing
Strict editorial policy that focuses on accuracy, relevance, and impartiality
Morbi pretium leo et nisl aliquam mollis. Quisque arcu lorem, ultricies quis pellentesque nec, ullamcorper eu odio.
The XRP price saw a rise in value over the weekend as bulls seemed to return to the table. Since the market has been low over the past few months, investors unsurprisingly took this as an opportunity to get out at a somewhat higher price. This has led to more negative networks over the last few days, adding even more red to the month of April that has been dominated by outflows.
XRP’s April Outflows Cross $300 Million
According to data from Coinglass, XRP has been struggling with negative net flows for the better part of April, recording more red days than green. Even the green days have been quite muted and have fallen short of the volumes recorded on the red days. With only 13 days gone out the month so far, there has already been more than $300 million in outflows recorded for the month already.
Related Reading
So far, only four out of the 13 days have ended with positive net flows, coming out to $56.08 million in inflows for the month. In contrast, the other nine days have been dominated by outflows, coming out to $311 million by Sunday.
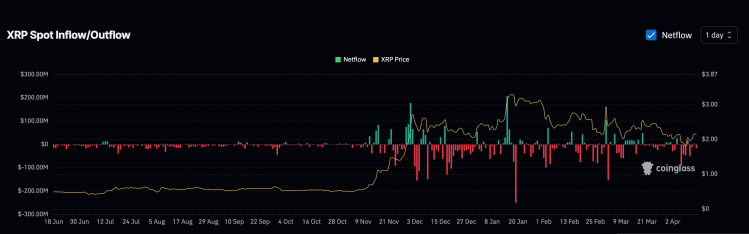
This consistent outflow suggests that sellers are still dominating the market, which explains why the XRP price has continued to remain low throughout this time. Additionally, if this negative net flow trend continues, then the XRP price could suffer further crashes from here.
However, in comparison to the last three months, the month of April seems to be recording a slow down when it comes to outflows. For example, months of January and March recorded $150 million outflow days, whereas the highest so far in April has been $90 million, which occurred on April 6.
One More Dip Coming?
While there has been a return of positive sentiment among XRP investors, bearish expectations still abound, although mainly for the short-term. Crypto analyst Egrag Crypto, a known XRP bull, has pointed out that the altcoin is likely to see another dip in price before a recovery. Nevertheless, the expectations for the long-term are still extremely bullish.
Related Reading
The crypto analyst highlights the possibility for the XRP price to dip to $1.4, but explains that he continues to hold his position. As for how high the price could go, the analyst maintain three major price targets: $7.50, $13, and $27.
“For me, I follow the charts with a clear understanding that certain events will unfold, but I stay updated on the news to see what narratives are created to influence market movements,” Egrag Crypto explained.
Featured image from Dall.E, chart from TradingView.com
XRP Price Climbs Again, Will XRP Still Face a Death Cross?

Auto.fun Launchpad Set to Debut Amid Fierce Market Rivalry

Crypto Outflows Hit $795 Million On Trump’s Tariffs & Market Fear

FLR Token Hits Weekly High, Outperforms Major Coins

Bitcoin All-Time High in 2025? Expert Sees 77% Chance

XRP Outflows Cross $300 Million In April, Why The Price Could Crash Further

2.52 Million Altcoins Are Ruining Crypto’s Future

Animoca Brands Valuation Tanks 75% In Two Years, Here’s Why

Crypto exchange BingX hacked for $43 million

Are The Big Players Losing Interest?

Hong Kong’s Securities Association Tips Authorities On Crypto Self-Regulation

Coinbase cbBTC Set to go Live on Solana
2.52 Million Altcoins Are Ruining Crypto’s Future
Animoca Brands Valuation Tanks 75% In Two Years, Here’s Why
Crypto exchange BingX hacked for $43 million
Are The Big Players Losing Interest?
Hong Kong’s Securities Association Tips Authorities On Crypto Self-Regulation
Coinbase cbBTC Set to go Live on Solana
-
 Altcoin14 hours ago
Mantra Team Responds As The OM Token Price Crashes Over 80% In 24 Hours
-
 Market19 hours ago
Hackers are Targeting Atomic and Exodus Wallets
-
 Market18 hours ago
3 Token Unlocks for This Week: TRUMP, STRK, ZKJ
-

 Market22 hours ago
FARTCOIN Is Overbought After 250% Rally – Is the Bull Run Over?
-
 Bitcoin20 hours ago
New Bill Pushes Bitcoin Miners to Invest in Clean Energy
-
 Altcoin17 hours ago
Ethereum Price Eyes Rally To $4,800 After Breaking Key Resistance
-

 Market23 hours ago
Binance Users Targeted by New Phishing SMS Scam
-

 Market21 hours ago
Ethereum’s Buterin Criticizes Pump.Fun for Bad Social Philosophy