
Market
Bitcoin Holds The Line—But Can It Bounce Back or Break Lower?

Reason to trust
![]()
Strict editorial policy that focuses on accuracy, relevance, and impartiality
Created by industry experts and meticulously reviewed
The highest standards in reporting and publishing
Strict editorial policy that focuses on accuracy, relevance, and impartiality
Morbi pretium leo et nisl aliquam mollis. Quisque arcu lorem, ultricies quis pellentesque nec, ullamcorper eu odio.
Bitcoin price started a fresh increase above the $80,000 zone. BTC is now correcting gains and might struggle to stay above the $79,500 support.
- Bitcoin started a fresh increase above the $80,000 zone.
- The price is trading above $79,500 and the 100 hourly Simple moving average.
- There is a new connecting bearish trend line forming with resistance at $80,500 on the hourly chart of the BTC/USD pair (data feed from Kraken).
- The pair could start another increase if it clears the $80,500 zone.
Bitcoin Price Dips Again
Bitcoin price started a fresh increase above the $77,500 zone. BTC formed a base and gained pace for a move above the $79,500 and $80,000 resistance levels.
The bulls pumped the price above the $82,500 resistance. A high was formed at $83,548 and the price recently started a downside correction. There was a move below the $81,500 support. The price dipped below the 23.6% Fib retracement level of the upward move from the $74,572 swing low to the $83,548 high.
Bitcoin price is now trading above $79,200 and the 100 hourly Simple moving average. On the upside, immediate resistance is near the $80,500 level. There is also a new connecting bearish trend line forming with resistance at $80,500 on the hourly chart of the BTC/USD pair.

The first key resistance is near the $81,500 level. The next key resistance could be $82,500. A close above the $82,500 resistance might send the price further higher. In the stated case, the price could rise and test the $83,500 resistance level. Any more gains might send the price toward the $85,000 level.
More Losses In BTC?
If Bitcoin fails to rise above the $80,500 resistance zone, it could continue to move down. Immediate support on the downside is near the $79,500 level. The first major support is near the $79,000 level and the 50% Fib retracement level of the upward move from the $74,572 swing low to the $83,548 high.
The next support is now near the $78,000 zone. Any more losses might send the price toward the $76,500 support in the near term. The main support sits at $75,000.
Technical indicators:
Hourly MACD – The MACD is now losing pace in the bullish zone.
Hourly RSI (Relative Strength Index) – The RSI for BTC/USD is now above the 50 level.
Major Support Levels – $79,500, followed by $79,000.
Major Resistance Levels – $80,500 and $81,500.


The Solana-based meme coin FARTCOIN has emerged as an unlikely outperformer over the past month. The altcoin has defied the broader market troubles and surged by nearly 250% in the past 30 days.
However, buyer exhaustion could soon set in, potentially triggering a wave of profit-taking among FARTCOIN holders eager to lock in gains.
FARTCOIN Enters Overbought Zone
FARTCOIN’s triple-digit rally has pushed its price above the upper band of its Bollinger Bands (BB) indicator, a sign that the meme coin is overbought.
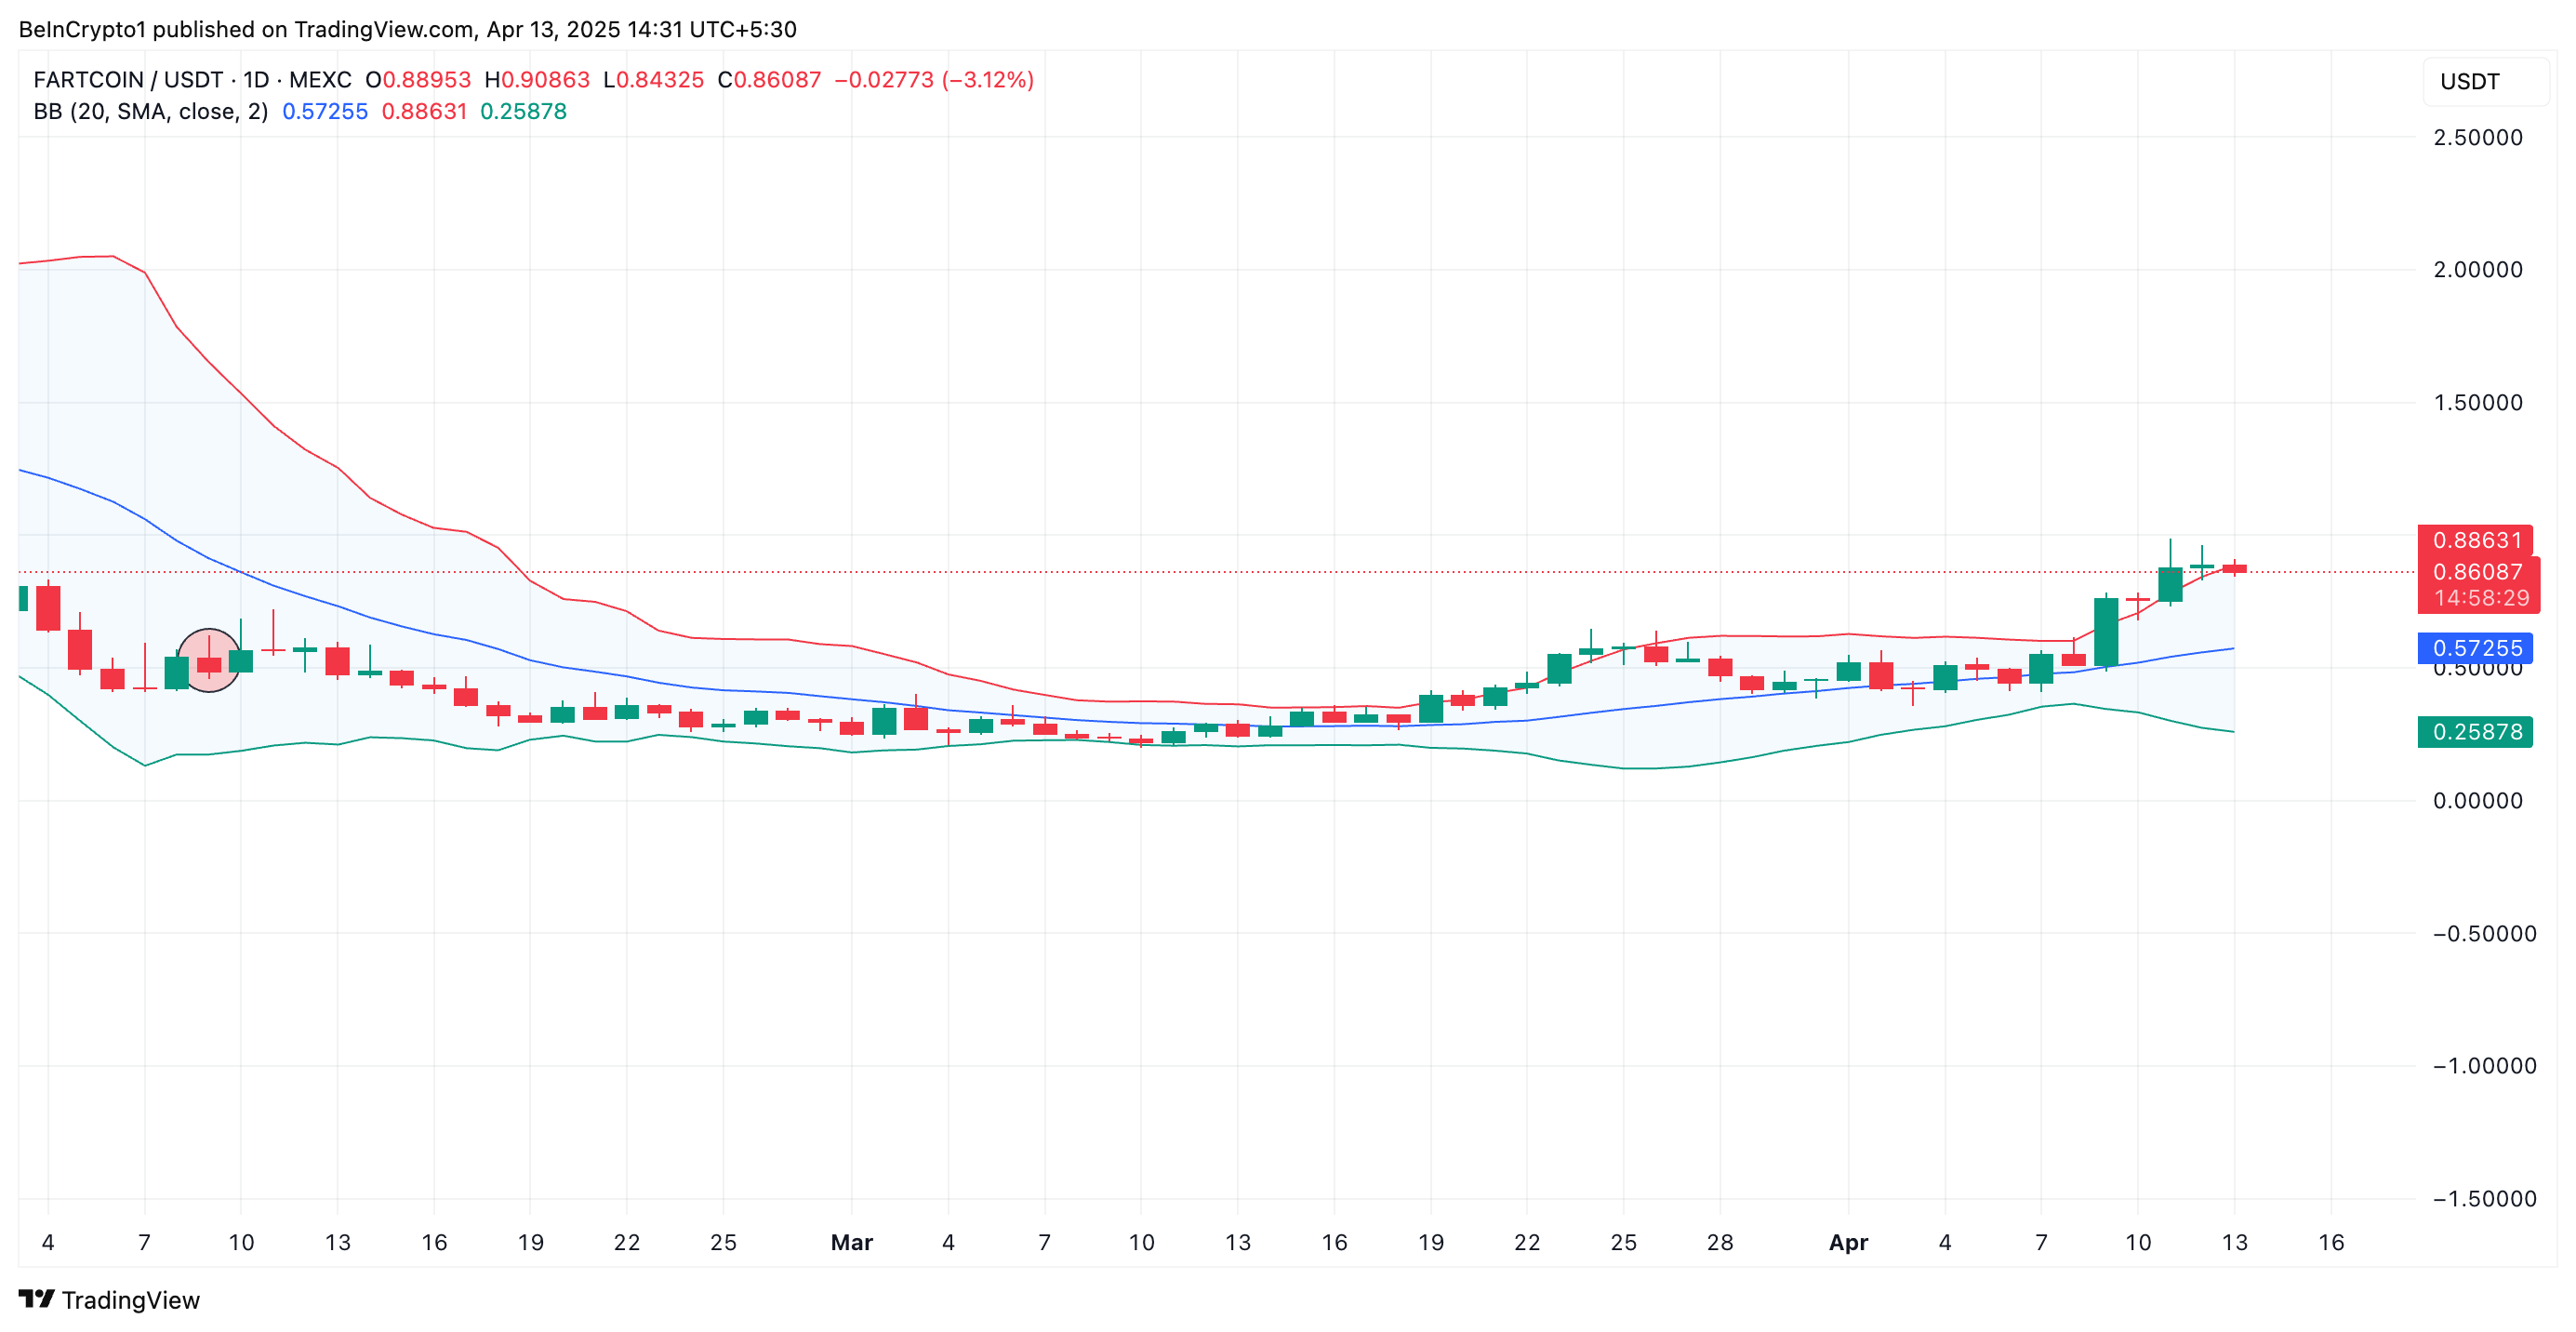
The BB indicator identifies overbought or oversold conditions and measures an asset’s price volatility. It consists of three lines: a simple moving average (middle band) and two bands (upper and lower) representing standard deviations above and below the moving average.
When the price breaks above the upper band, it means the asset’s current value is moving significantly away from its average, making it overbought and due for a price correction.
This pattern suggests that FARTCOIN’s current price level may not be sustainable, increasing the likelihood of a near-term pullback.
Moreover, readings from the token’s Relative Strength Index (RSI) confirm its nearly overbought status. At press time, this momentum indicator rests at 69.09.
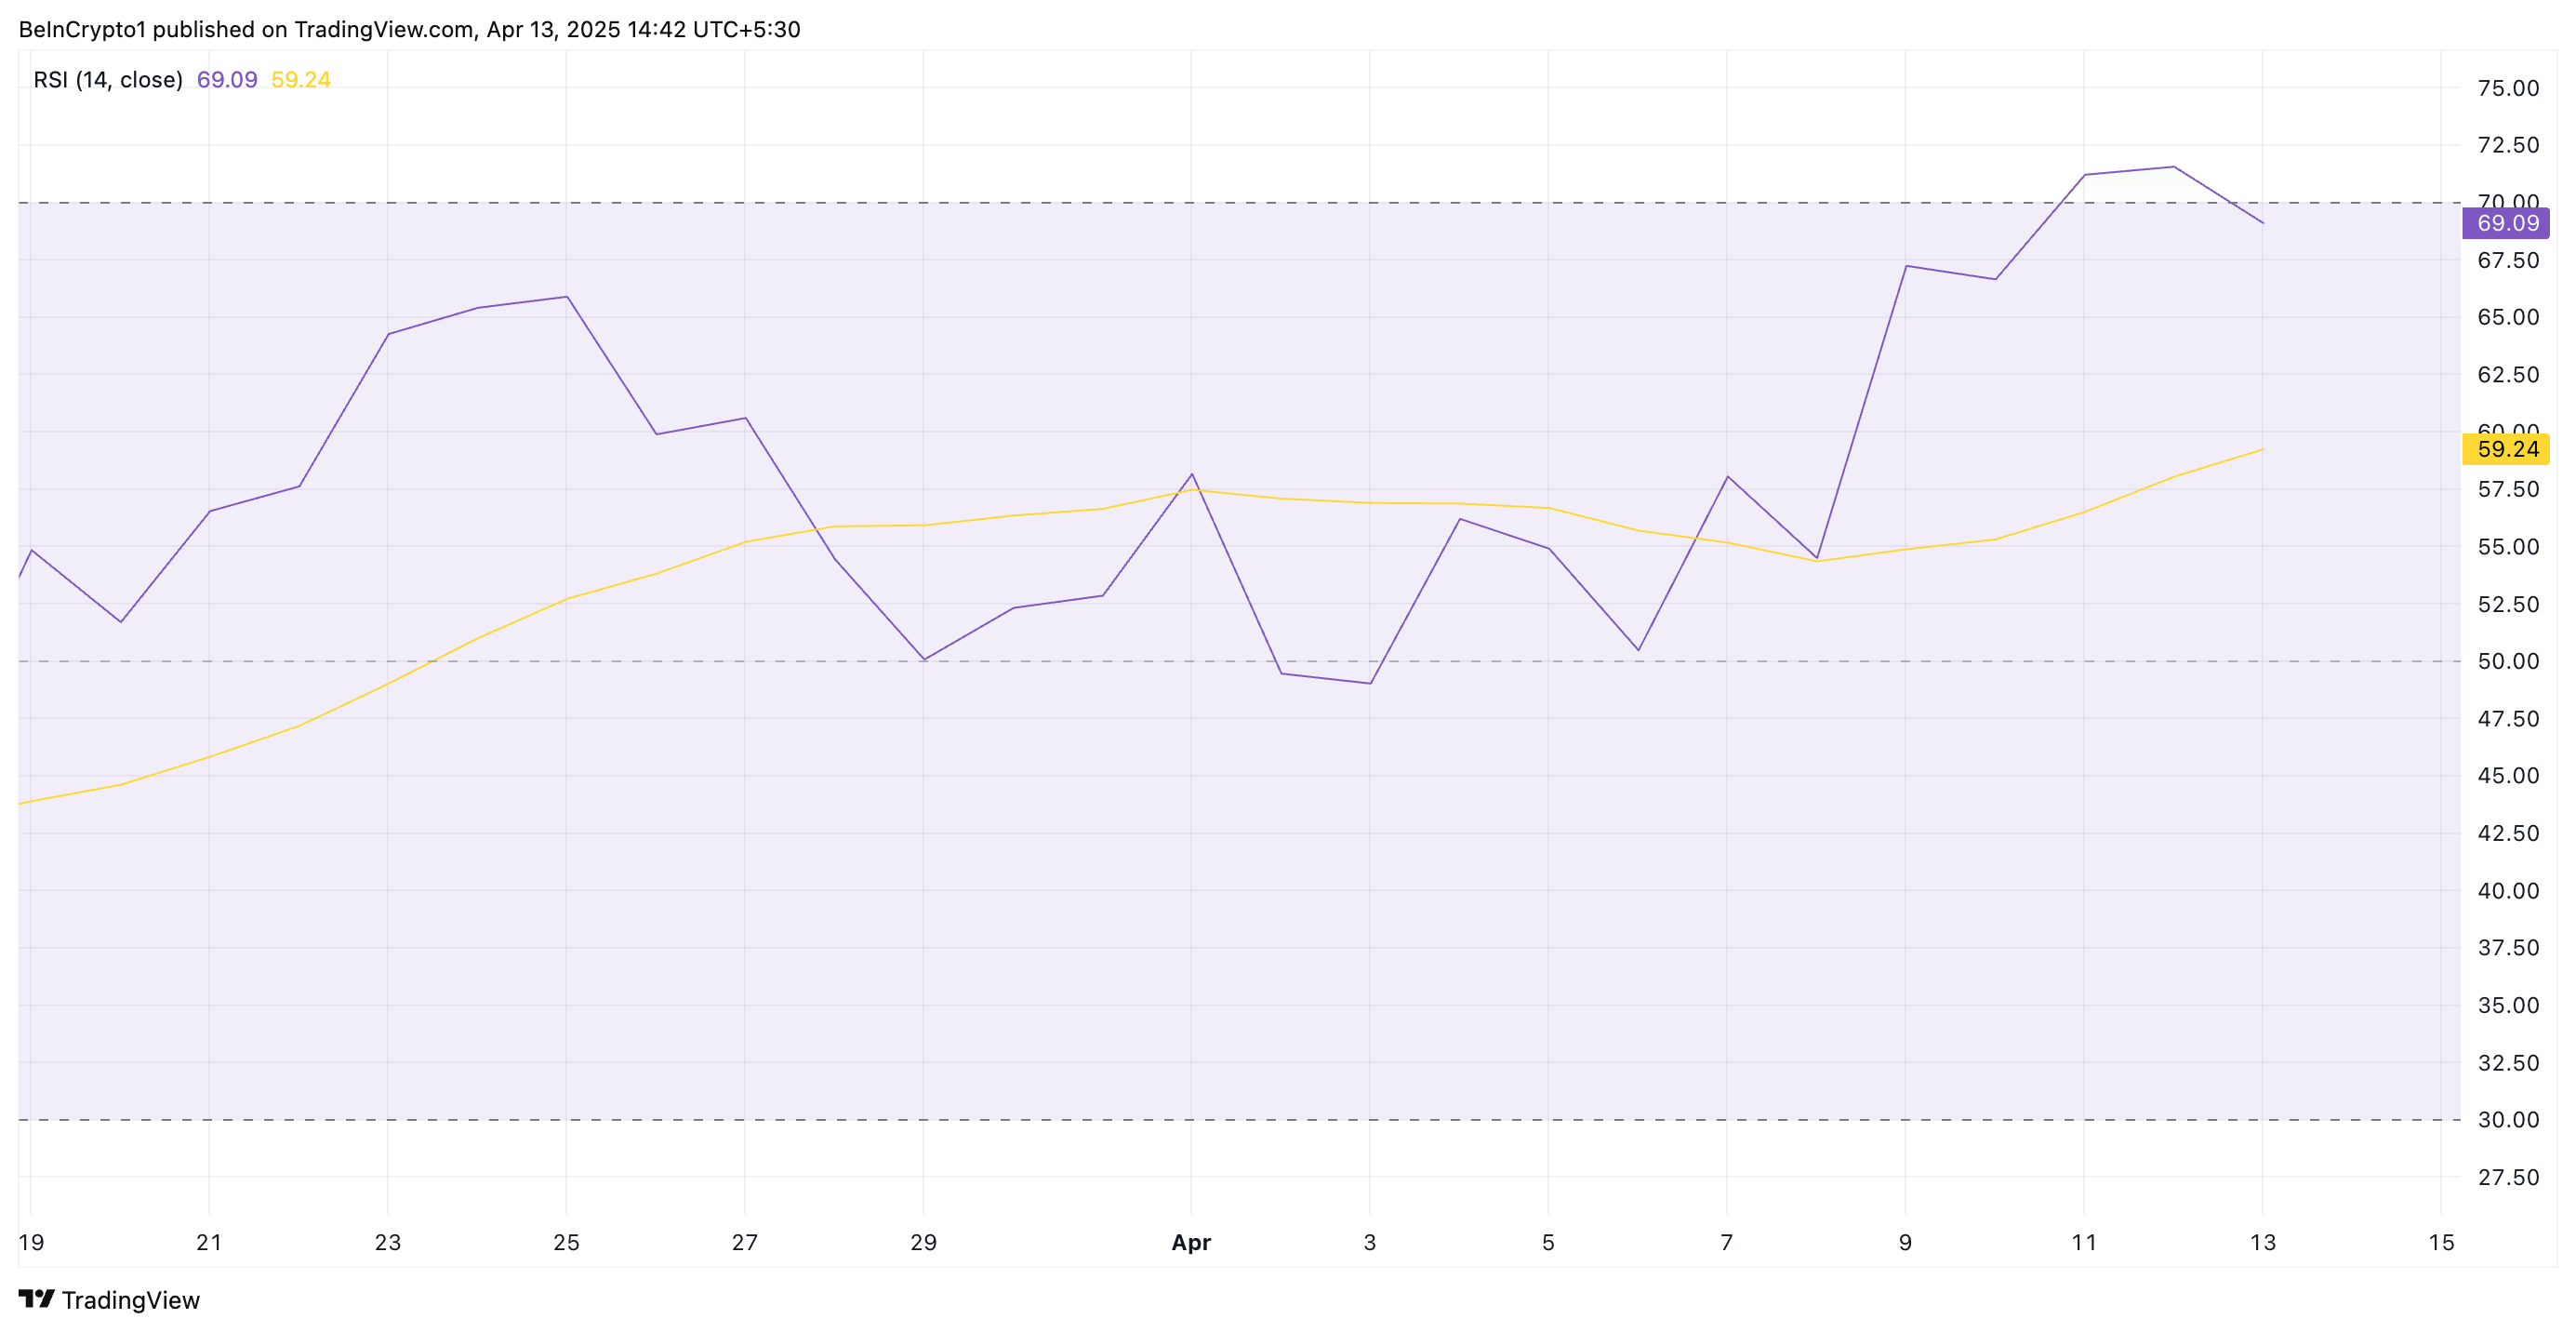
The RSI indicator measures an asset’s overbought and oversold market conditions. It ranges between 0 and 100. Values above 70 suggest that the asset is overbought and due for a price decline, while values under 30 indicate that the asset is oversold and may witness a rebound.
At 69.09, FARTCOIN’s RSI signals that the meme coin is nearly overbought. Its upward momentum may be weakening, and a price correction could be near.
Will It Hit $1.16 or Slip Back to $0.37?
If the current momentum fades, FARTCOIN could face a short-term correction that causes it to shed some recent gains. In that scenario, the Solana-based asset could retest support at $0.74.
Should it fail to hold, the downtrend strengthens and could continue toward $0.37.
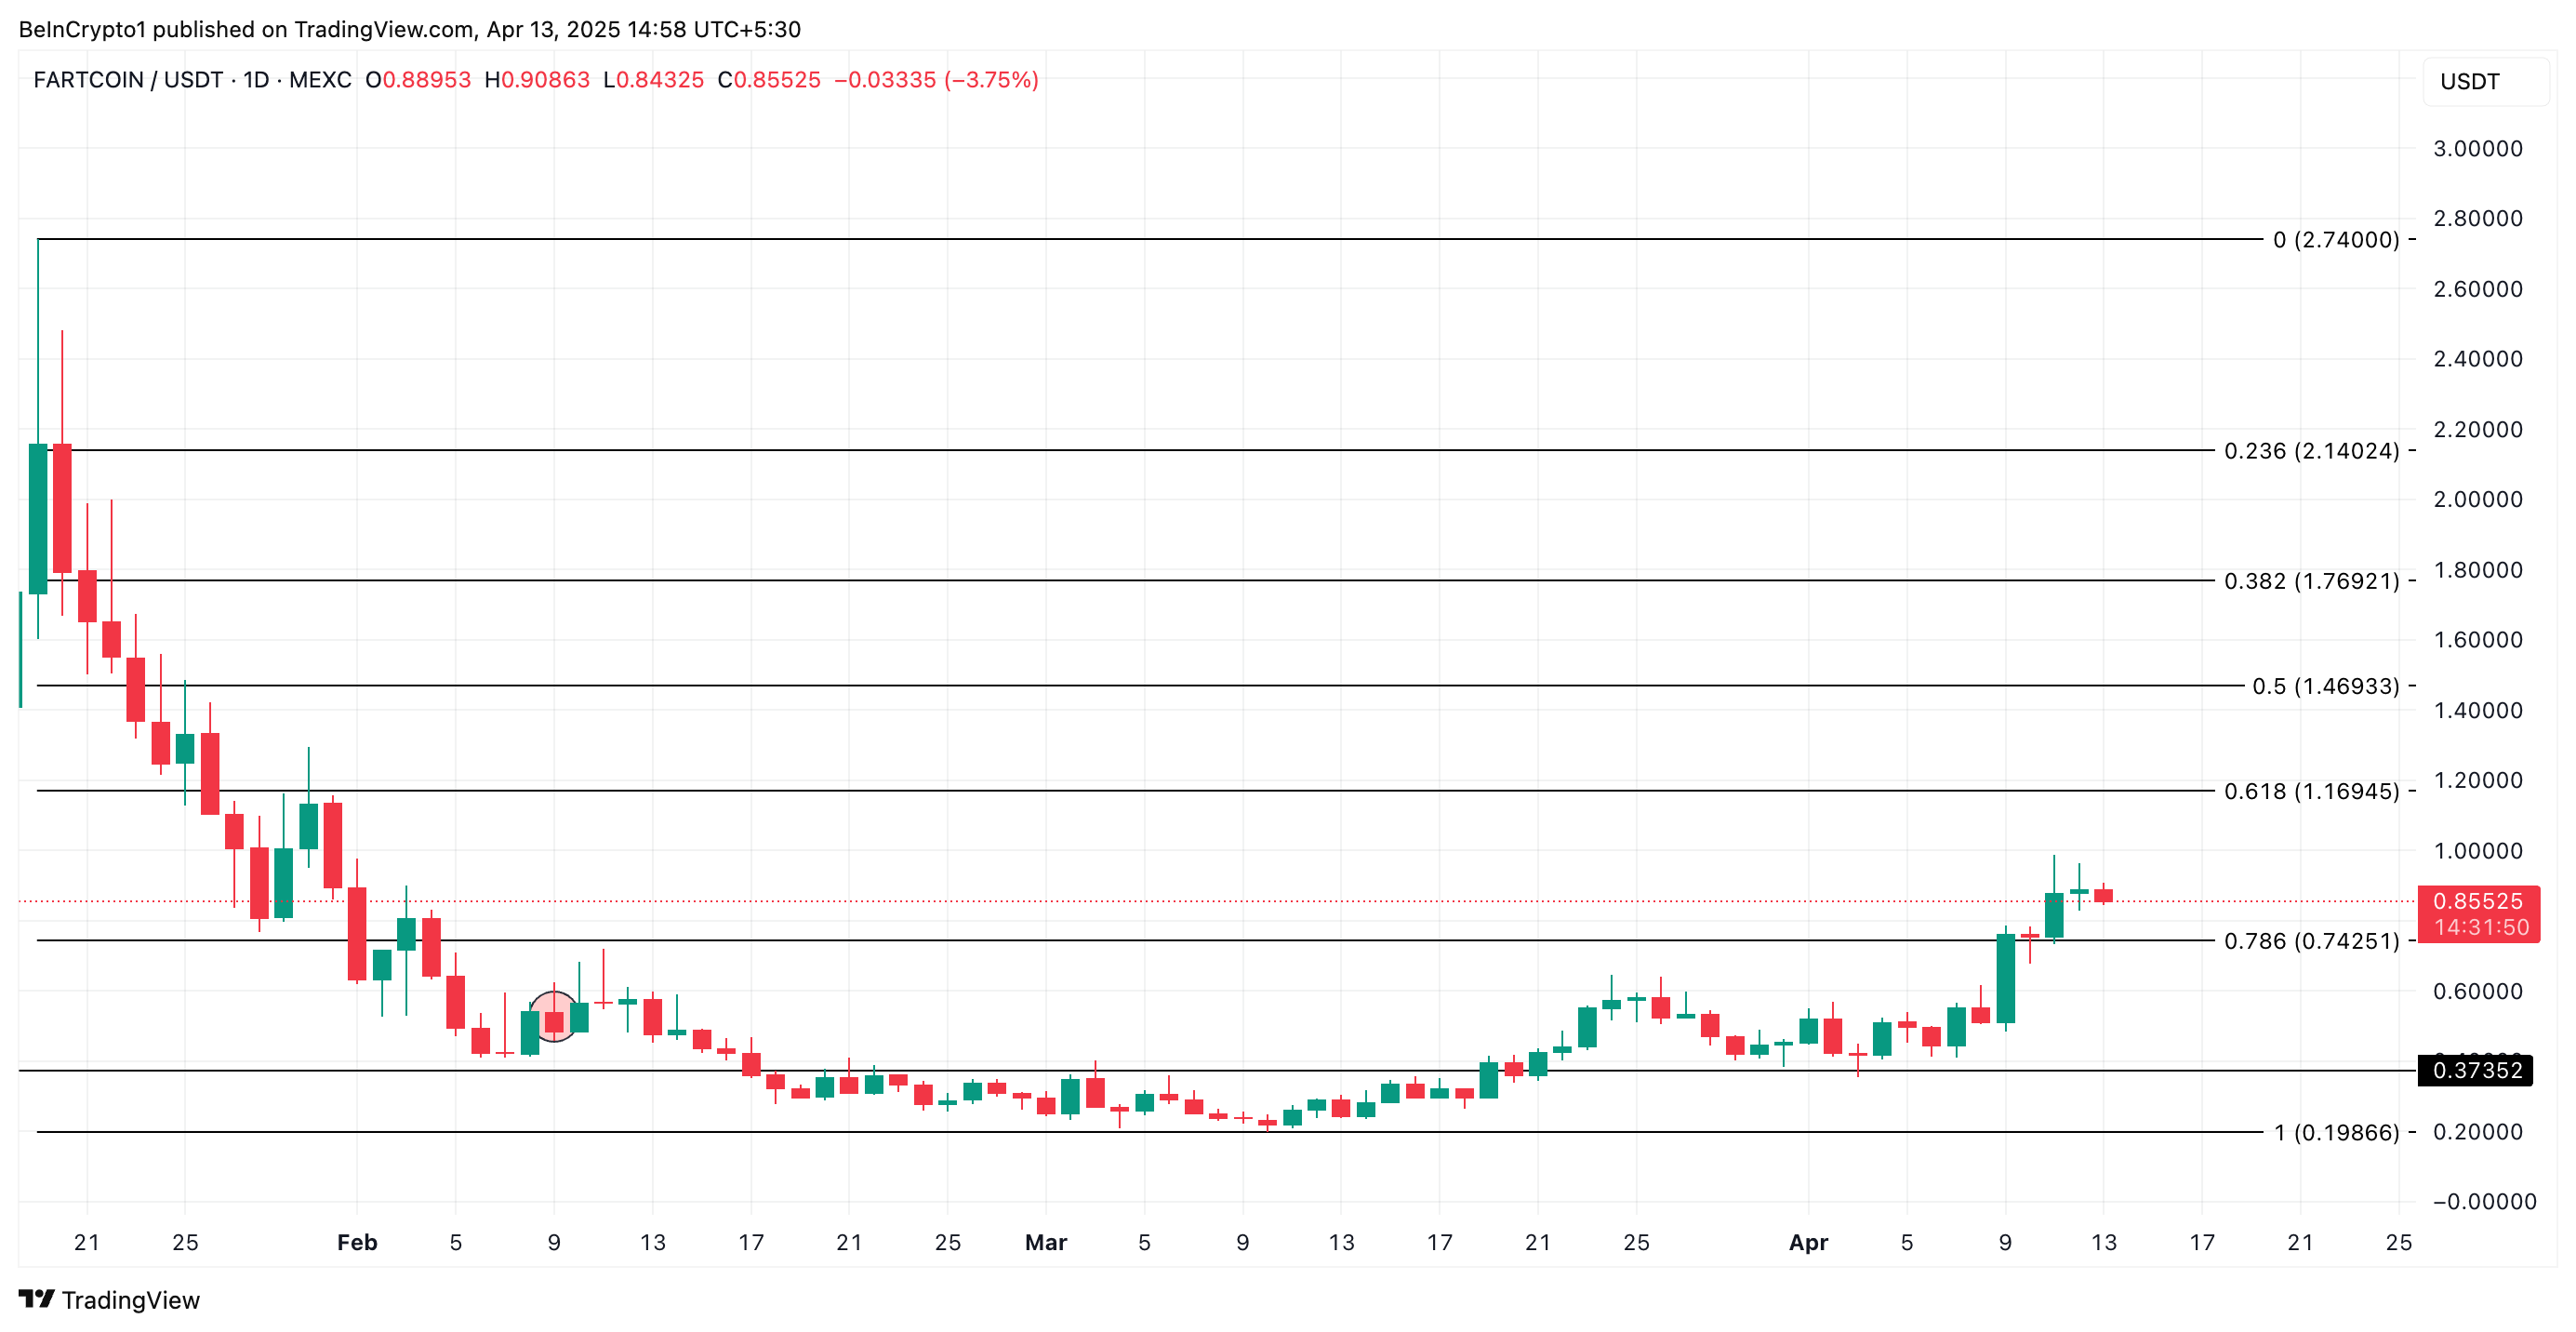
However, if FARTCOIN maintains its uptrend, it could rally to $1.16.
Disclaimer
In line with the Trust Project guidelines, this price analysis article is for informational purposes only and should not be considered financial or investment advice. BeInCrypto is committed to accurate, unbiased reporting, but market conditions are subject to change without notice. Always conduct your own research and consult with a professional before making any financial decisions. Please note that our Terms and Conditions, Privacy Policy, and Disclaimers have been updated.
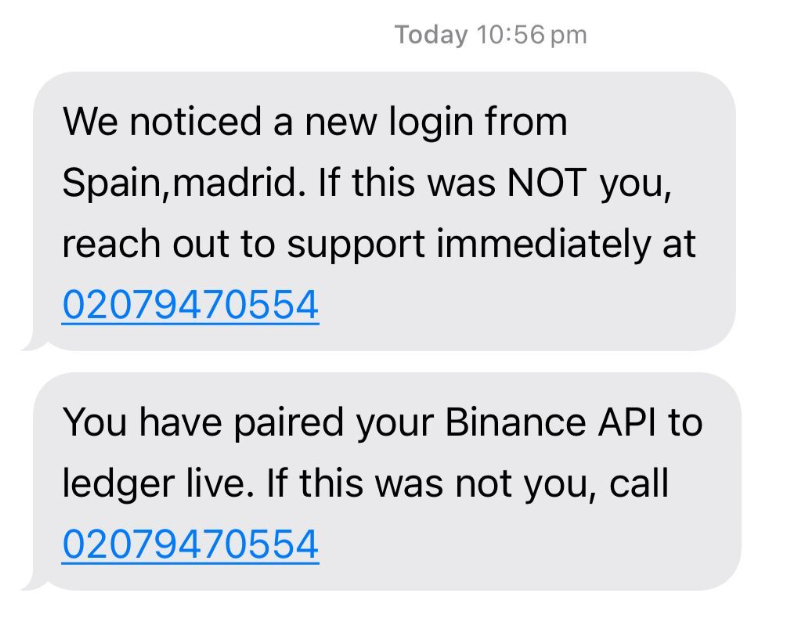
Dozens of Binance users report receiving an alarming wave of phishing text messages that appear genuine. These messages even match the phone number and SMS inbox they regularly see for official Binance updates.
Almost all phishing texts reviewed by BeInCrypto have the same wording and format. This leads us to believe that a particular threat actor or criminal group is targeting Binance users with a sophisticated phishing campaign.
Targeted Phishing Campaign Against Binance Users
The messages often warn of users’ unauthorized account activities—such as a newly added two-factor authentication device.
Most commonly, the phishing messages follow up with a text about an unexpected Binance API pairing with Ledger Live. The recipients are then urged to call a provided phone number.
Some targeted users claim these texts show up in the same thread as their legitimate Binance notifications. This creates confusion and prompts them to engage. Investigations by BeInCrypto reveal a surge in consumer complaints on X (formerly Twitter).
Many users say they were caught off guard because the scam messages originated from the same sender ID used by Binance for authentic notifications.
Meanwhile, the criminals behind this campaign appear to be capitalizing on publicly reported leaks of Binance user data on dark web forums.
Last month, an estimated 230,000 combined user records from Binance and Gemini reportedly appeared for sale on the dark web. Security experts suggest these leaks came through phishing attacks rather than direct system breaches.
The suspected group of threat actors is likely using leaked information—names, phone numbers, and emails—to craft targeted messages that give the illusion of legitimacy.
Also, the pattern seen in the phishing attempts typically involves an urgent “not you?” query. It prompts recipients to call an embedded phone line instead of simply clicking a link.
This method bypasses the more common scenario of phishing links in SMS.
Binance is Extending Anti-Phishing Code to SMS
In an exclusive email to BeInCrypto, Binance’s Chief Security Officer, Jimmy Su, responded to these findings. Su confirmed the company’s awareness of the escalating smishing incidents.
“We are aware of smishing scams on the rise where phishing scammers are impersonating us and other legitimate senders via SMS. These scams appear to be more authentic, tricking users into revealing sensitive information, clicking into phishing links, or making a transfer that result in loss of assets.” Binance’s Chief Security Officer told BeInCrypto.
Su further disclosed that Binance has extended its Anti-Phishing Code to SMS. This feature was originally offered for emails.
The code is a user-defined identifier that appears in official Binance messages, making it easier for recipients to recognize genuine notifications and avoid impostors.
“By incorporating a unique Anti-Phishing code into Binance SMS messages, we are making it significantly harder for scammers to deceive our users,” Su said.
The Anti-Phishing Code has been rolled out to all licensed jurisdictions where Binance operates.
Also, according to Binance, both registered and non-registered users have reported receiving suspicious texts.
Therefore, attackers might be leveraging databases that include phone numbers of individuals not actively using Binance.
BeInCrypto advises users to adopt additional measures, such as verifying transactions directly through Binance’s official app or website, using multifactor authentication, and never sharing credentials over the phone.
Reporting suspicious messages to Binance’s support team is strongly advised.
Individuals are encouraged to confirm official communications by checking for the Anti-Phishing Code and to carefully scrutinize any request to call phone numbers provided in unsolicited messages.
Disclaimer
In adherence to the Trust Project guidelines, BeInCrypto is committed to unbiased, transparent reporting. This news article aims to provide accurate, timely information. However, readers are advised to verify facts independently and consult with a professional before making any decisions based on this content. Please note that our Terms and Conditions, Privacy Policy, and Disclaimers have been updated.
Dogecoin holders have been withdrawing their funds from spot markets in April, with the leading meme coin facing mounting selling pressure.
The lack of new capital flowing into DOGE reflects a decline in investor confidence and adds downward pressure on the altcoin.
Sell-Off Worsens for DOGE as Outflows Outpace Inflows
Since the beginning of April, DOGE has seen a consistent stream of net outflows from its spot market, totaling over $120 million. Net inflows during the same period have been negligible, amounting to less than $5 million per Coinglass.

When an asset records spot outflows, more of its coins or tokens are being sold or withdrawn from the spot market than are being bought or deposited.
This indicates that DOGE investors are losing confidence and opting to liquidate their holdings due to increasingly bearish market conditions.
The persistent outflows from the meme coin over the past two weeks reflect the lack of new demand for the altcoin. If this trend continues, DOGE’s price could remain range-bound or face another decline cycle.
On the technical front, DOGE’s Relative Strength Index (RSI) has continued to trend downward on the daily chart, further confirming the bearish outlook.
At press time, this key momentum indicator, which measures an asset’s oversold and overbought market conditions, is below the 50-neutral line at 47.61.

When an asset’s RSI falls below the center line, bearish momentum strengthens. This suggests that DOGE selling pressure is beginning to outweigh buying interest, signaling a potential dip in the asset’s price.
DOGE Risks Retesting Yearly Lows
With the crypto market’s volatility heightened by Donald Trump’s ongoing trade wars and DOGE’s current struggles to attract fresh investment, the meme coin may test new lows in the near term. If selling pressure strengthens, DOGE could revisit its year-to-date low of $0.12.
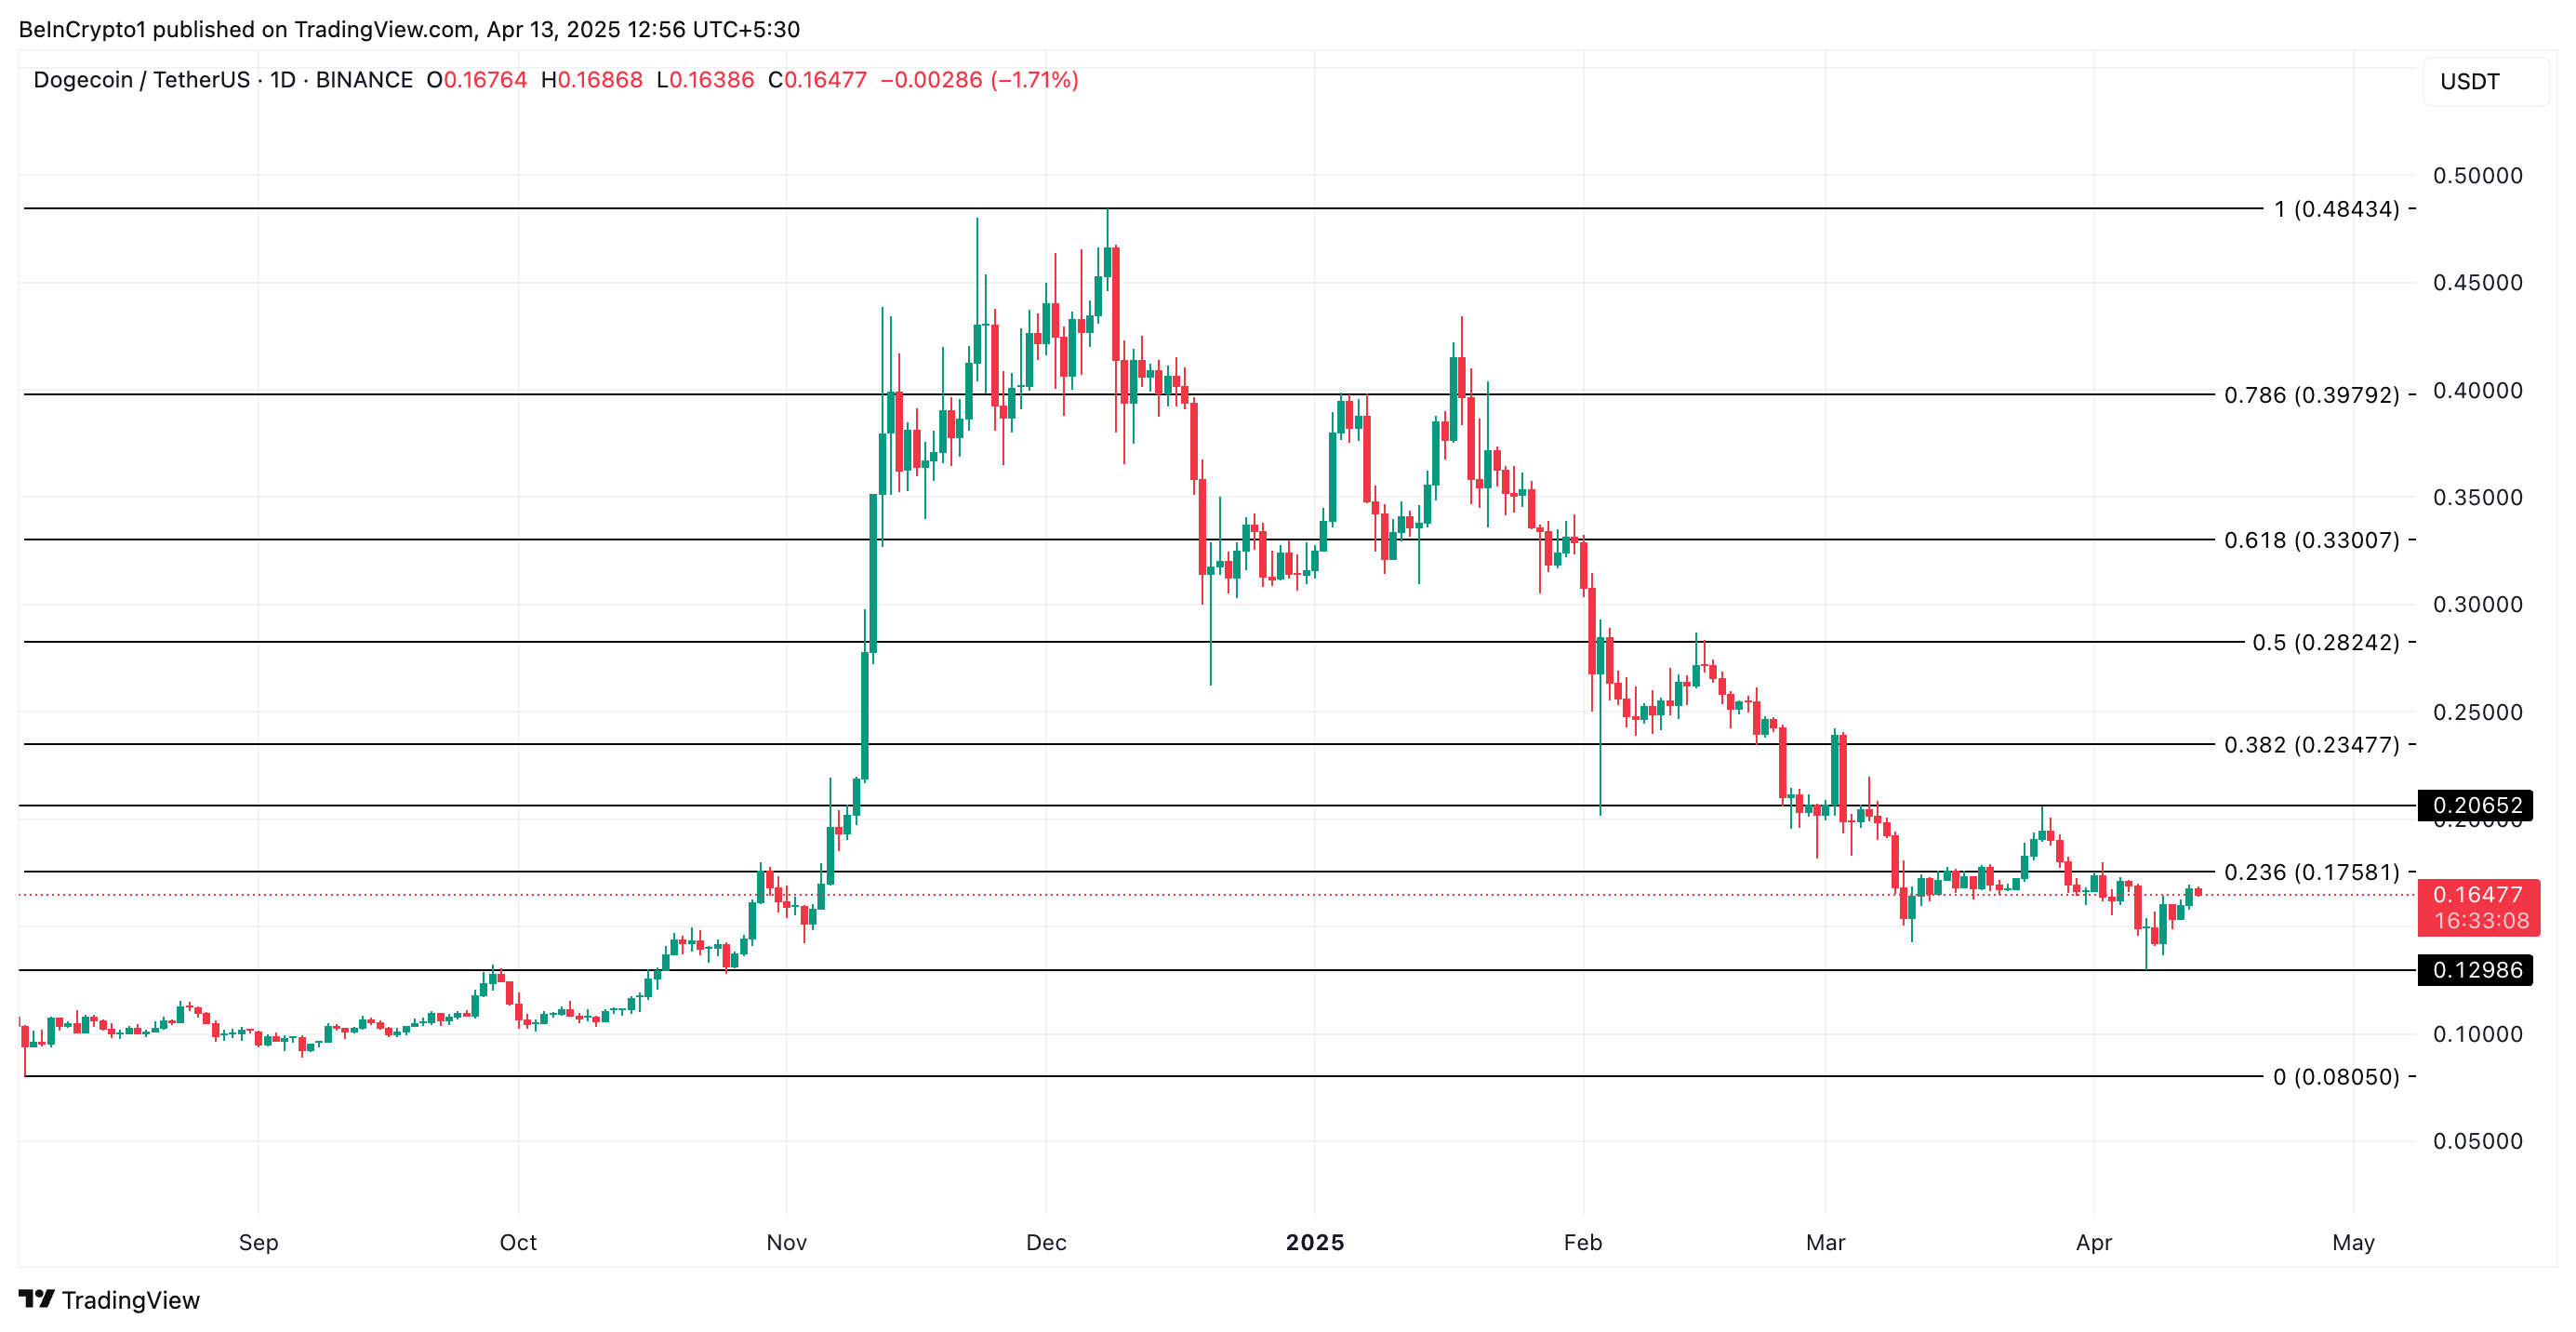
Conversely, a resurgence in new demand for the meme coin will invalidate this bearish outlook. In that scenario, DOGE’s price could break above $0.17 and climb to $0.20.
Disclaimer
In line with the Trust Project guidelines, this price analysis article is for informational purposes only and should not be considered financial or investment advice. BeInCrypto is committed to accurate, unbiased reporting, but market conditions are subject to change without notice. Always conduct your own research and consult with a professional before making any financial decisions. Please note that our Terms and Conditions, Privacy Policy, and Disclaimers have been updated.

FARTCOIN Is Overbought After 250% Rally – Is the Bull Run Over?

Binance Users Targeted by New Phishing SMS Scam

DOGE Spot Outflows Exceed $120 Million in April

Ethereum Reclaims Key Support At $1,574, Here’s The Next Price Target

PI Coin Recovers 80% From All-time Low — Will It Retake $1?

CryptoQuant CEO Says Bitcoin Bull Cycle Is Over, Here’s Why

2.52 Million Altcoins Are Ruining Crypto’s Future

Animoca Brands Valuation Tanks 75% In Two Years, Here’s Why

Crypto exchange BingX hacked for $43 million

Are The Big Players Losing Interest?

Hong Kong’s Securities Association Tips Authorities On Crypto Self-Regulation

Coinbase cbBTC Set to go Live on Solana
2.52 Million Altcoins Are Ruining Crypto’s Future
Animoca Brands Valuation Tanks 75% In Two Years, Here’s Why
Crypto exchange BingX hacked for $43 million
Are The Big Players Losing Interest?
Hong Kong’s Securities Association Tips Authorities On Crypto Self-Regulation
Coinbase cbBTC Set to go Live on Solana
-

 Bitcoin24 hours ago
Bitcoin’s Impact Alarming, Says NY Atty. General—Congress Needs To Act
-
 Market24 hours ago
Ripple May Settle SEC’s $50 Million Fine Using XRP
-
 Altcoin23 hours ago
Bankless Cofounder David Hoffman Reveals Strategy To Improve Ethereum Price Performance
-

 Market23 hours ago
Solana Bulls Lead 17% Recovery, Targeting $138
-
 Market20 hours ago
XRP Price To Hit $45? Here’s What Happens If It Mimics 2017 And 2021 Rallies
-

 Ethereum19 hours ago
Ethereum (ETH) Consolidates Within Tight Range As Key Support Level Forms
-

 Bitcoin18 hours ago
Bitcoin Price Volatility Far Lower Than During COVID-19 Crash — What This Means
-

 Bitcoin13 hours ago
Bitcoin Set For Challenge With Two Major Resistance Zones