
Market
Solana (SOL) Drops 4% as Selling Pressure Intensifies

Solana (SOL) has recovered over 12% today after Trump announced a 90-day pause on tariffs. Despite the significant recovery, technical indicators continue flashing bearish warnings. Key indicators like the RSI, BBTrend, and EMA lines all point to weakening momentum and a lack of buyer conviction. While oversold conditions have started to stabilize, the broader structure still leans slightly in favor of sellers.
Solana RSI Shows The Lack Of Conviction Among Buyers
Solana’s Relative Strength Index (RSI) is currently sitting at 45.52, hovering in neutral territory but remaining below the midline of 50 for nearly two days.
This comes after the RSI briefly dipped to an oversold level of 21.53 two days ago, indicating that sellers had briefly dominated before demand began to stabilize.
The RSI’s slow climb back toward neutral suggests that while extreme selling pressure has eased, bullish momentum has not yet taken control.
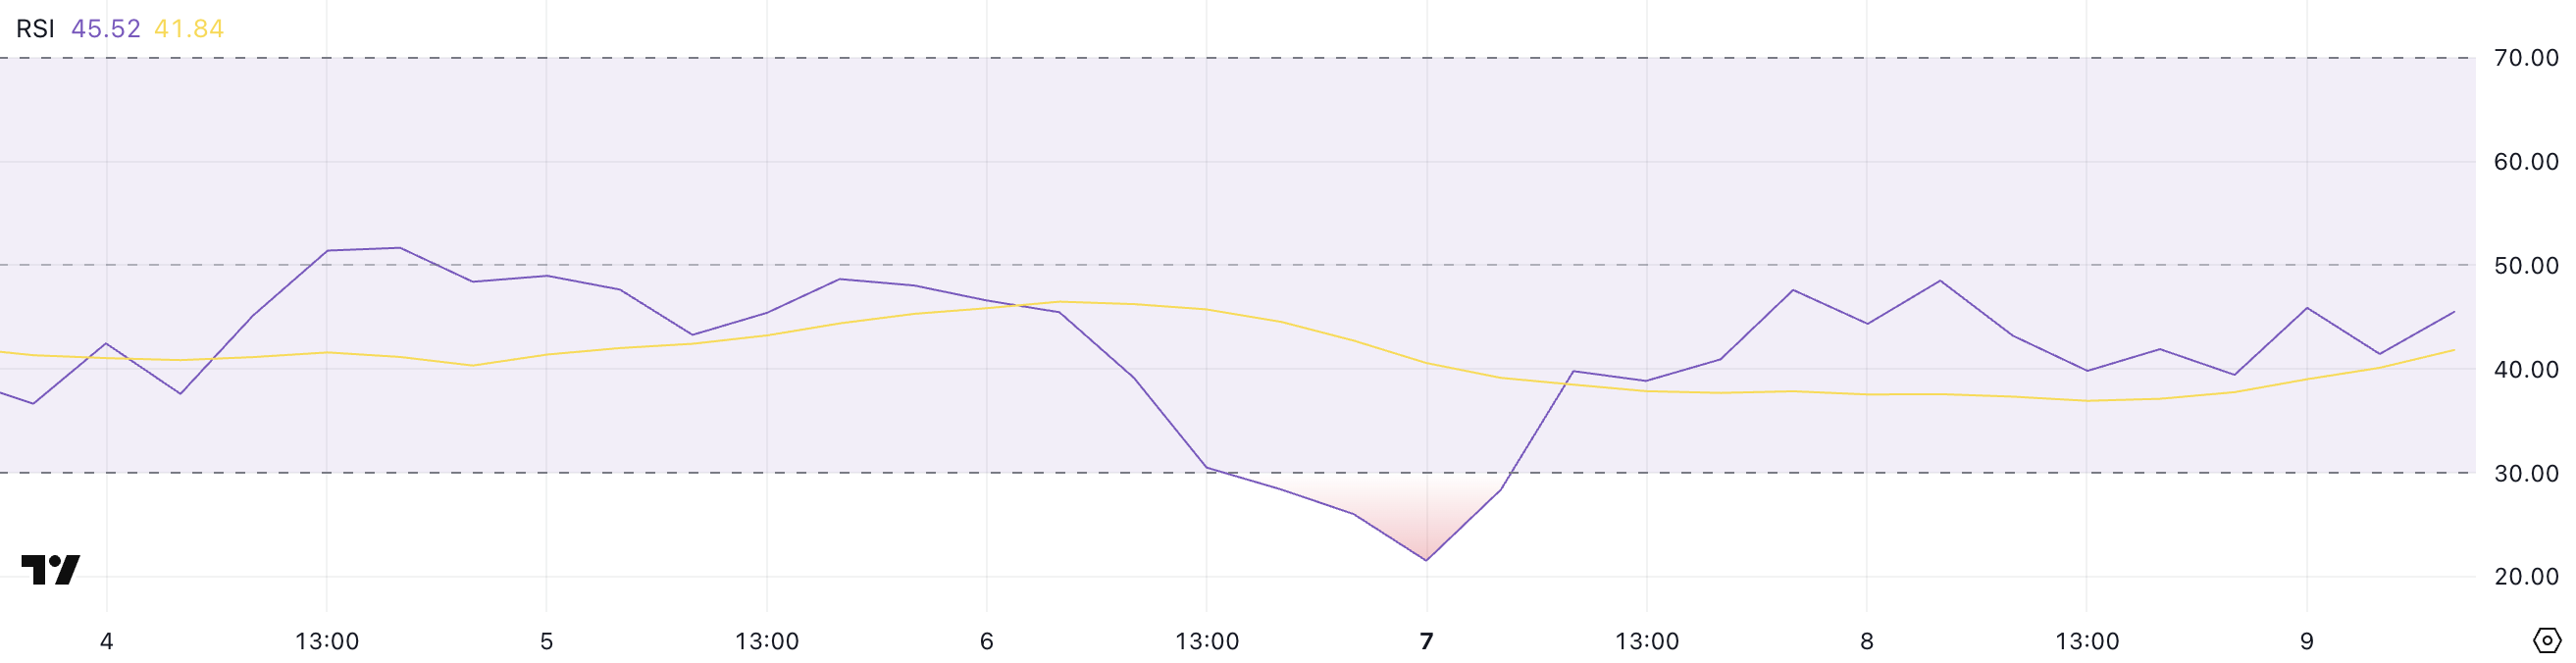
The RSI is a momentum oscillator that measures the speed and magnitude of recent price movements. It typically ranges from 0 to 100.
Readings above 70 are generally interpreted as overbought, signaling the potential for a pullback, while readings below 30 suggest oversold conditions and potential for a rebound.
Solana’s RSI at 45.52 indicates that the asset is in a recovery phase but lacks conviction. If the RSI fails to cross above 50 soon, it could imply continued hesitation among buyers and the potential for sideways price action or even another leg lower.
SOL BBTrend Has Reached Its Lowest Levels In Almost A Month
Solana’s BBTrend indicator is currently at -14.19, having turned negative since yesterday, and is at its lowest level since March 13—nearly a month ago.
This shift into deeper negative territory suggests that bearish momentum is building once again after a period of relative stability.
The return to these levels may indicate growing downside pressure, especially if follow-through selling continues in the short term.
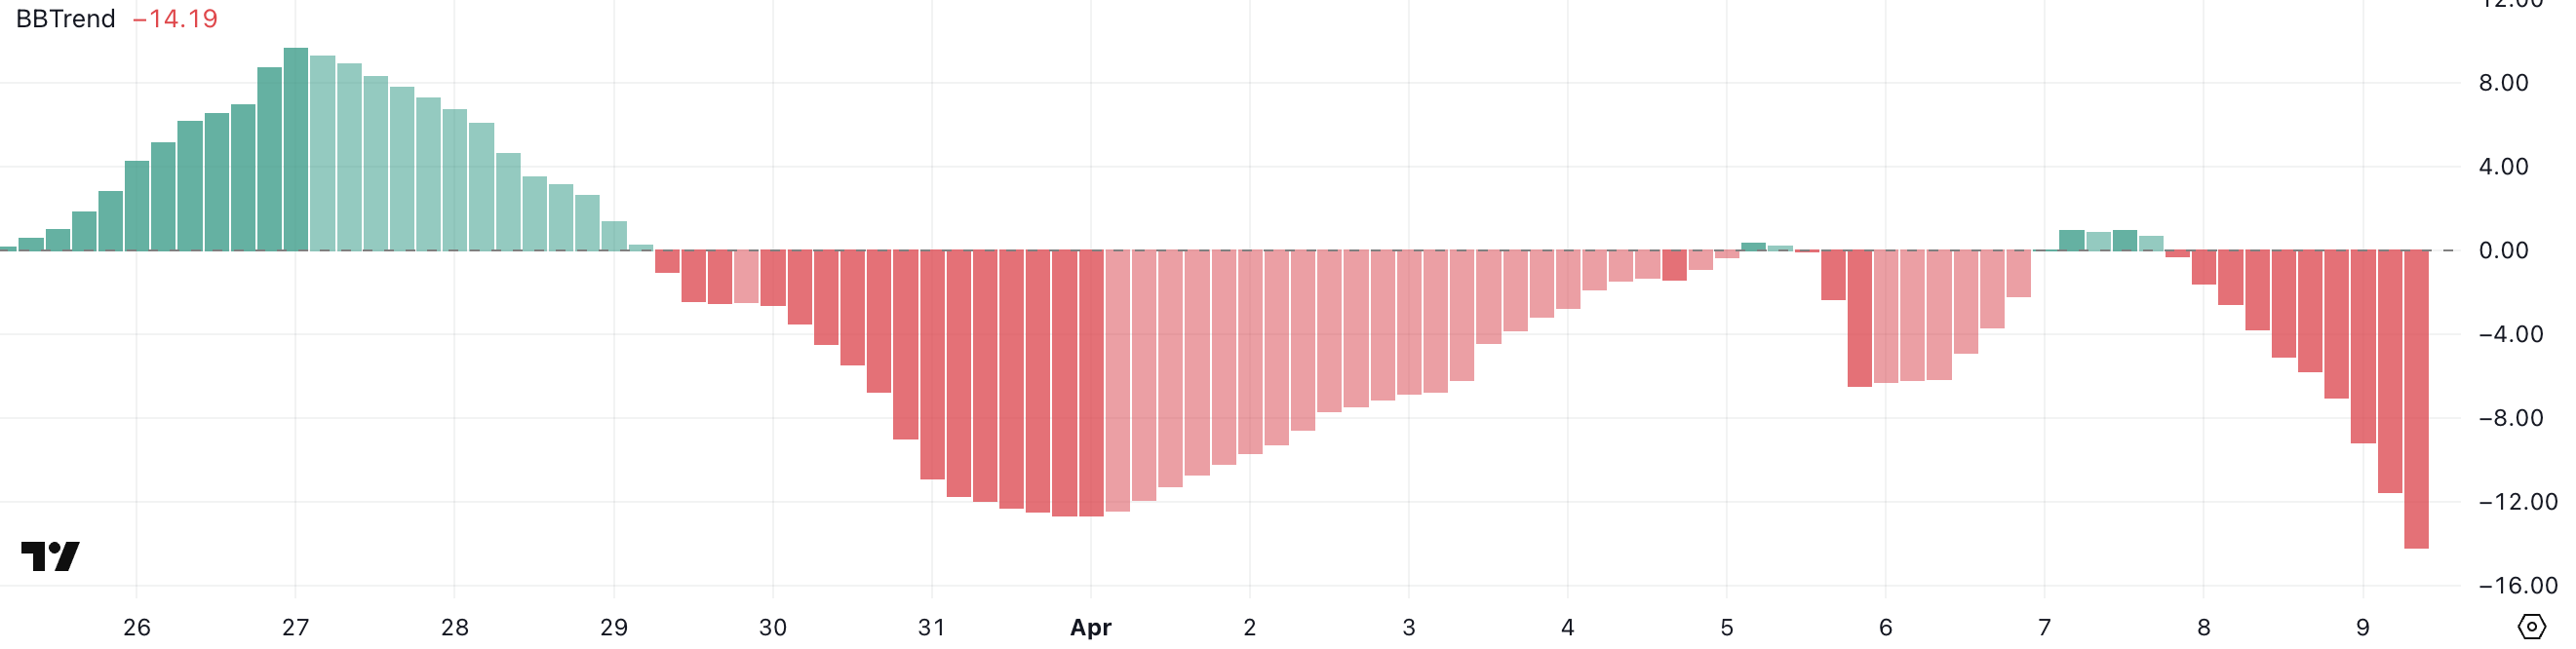
The BBTrend (Bollinger Band Trend) is a volatility-based indicator that measures the strength and direction of a price trend using the distance between price and Bollinger Bands.
Positive BBTrend values generally reflect bullish momentum, while negative values signal bearish momentum. The deeper the reading into negative territory, the stronger the downward pressure is considered to be.
Solana’s BBTrend is now at -14.19, implying an intensifying bearish phase, which could mean further price declines unless sentiment or volume shifts quickly in favor of buyers.
Will Solana Dip Below $100 Again In April?
Solana’s EMA setup continues to reflect a strong bearish structure, with short-term moving averages remaining well below long-term ones.
This alignment confirms that downward momentum is still in control, keeping sellers in a dominant position.
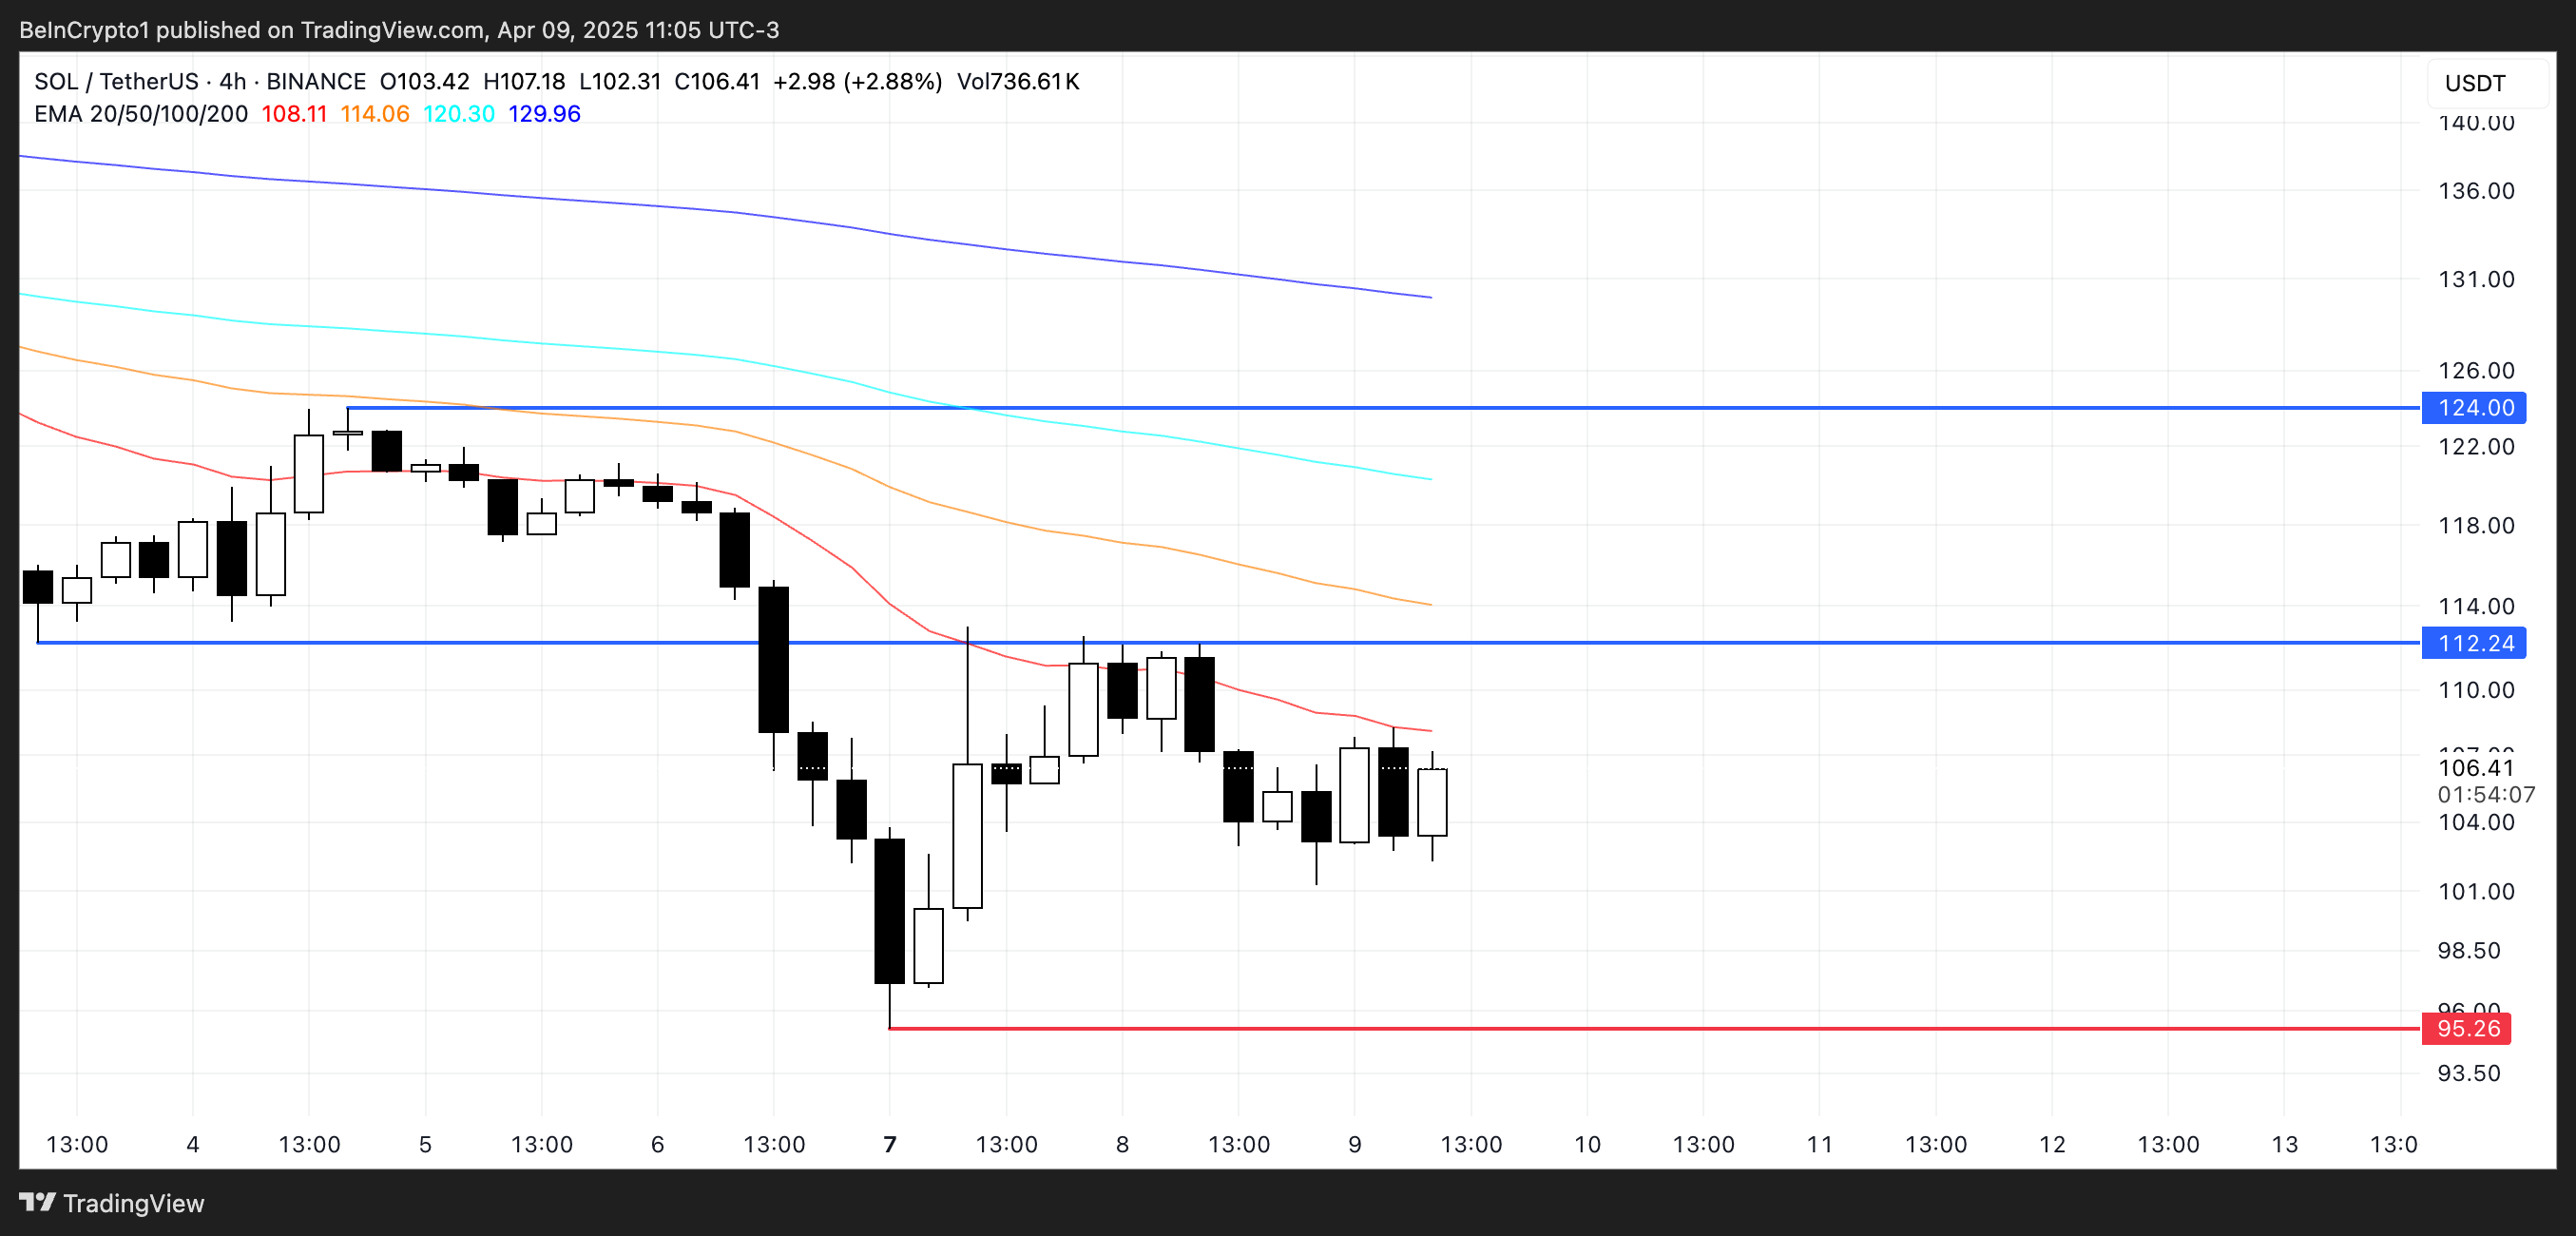
However, if Solana price manages to sustain the current strength and buying interest, it could test resistance at $120. A break above that level may open the path toward the next target at $134.
On the downside, if the current bearish trend persists, Solana could revisit support near $95, a level that has previously acted as a short-term floor.
Losing this level would be technically significant, potentially pushing SOL below $90—territory not seen since January 2024.
Disclaimer
In line with the Trust Project guidelines, this price analysis article is for informational purposes only and should not be considered financial or investment advice. BeInCrypto is committed to accurate, unbiased reporting, but market conditions are subject to change without notice. Always conduct your own research and consult with a professional before making any financial decisions. Please note that our Terms and Conditions, Privacy Policy, and Disclaimers have been updated.


Following Mantra’s catastrophic OM token crash, analysts urge the Pi Core Team (PCT) to adopt greater transparency and caution.
These remarks follow Pi Network’s recent transition to the full Open Mainnet phase.
Pi Network Advised to Prioritize Transparency Post-Mainnet
The warning comes after OM’s price plummeted more than 90% in under an hour, wiping out over $5.5 billion in market capitalization.

Following this crash, there is widespread fear across the crypto industry of similar events occurring in projects undergoing key phases of development and token unlocking. Among such projects is Pi Network, which recently transitioned to Open Mainnet.
Dr Altcoin, a crypto analyst and advocate for decentralized ethics, relates the OM incident to the Pi Network and calls for stricter regulation.
“The OM incident is a wake-up call for the entire crypto industry, proof that stricter regulations are urgently needed. It also serves as a huge lesson for the Pi Core Team as we transition from the Open Network to the Open Mainnet,” he tweeted.
Some users defended Pi Network’s fundamentals, highlighting its utility-focused roadmap and avoidance of speculative hype. However, Dr Altcoin doubled down on concerns over a lack of transparency.
“One thing is clear about the PCT, they are not transparent,” he added.
Still, the broader Pi community remains optimistic. The account Pi Open Mainnet, presented as a pioneer, posted a rebuttal citing reasons Pi may avoid OM’s fate. It highlighted Pi’s slow token release strategy and absence of large early-sell events as elements central to that confidence.
“Massive community (35M+ pioneers), steady unlocks, growing utility (.pi domains, dapps), and a clean track record,” they wrote.
Indeed, Pi’s ecosystem is expanding. The integration with Chainlink, new fiat on-ramps, and Pi Ads are creating what the team calls a “virtuous cycle” of adoption and utility, according to Pi Open Mainnet 2025, a senior pioneer’s account.
“These advancements form a virtuous cycle for Pi Network. Easier fiat ramps bring in more users (Pi’s community is already ~60M strong), Pi Ads drive more apps & utility, and Chainlink integration adds trust and interoperability. More users →more utility,” it stated.
With a community reportedly approaching 60 million, many believe the project has a strong user-driven foundation, unlike OM’s more centralized dynamics.
Is This Enough to Prevent OM-Like Fate?
However, not everyone is convinced this will be enough. Mahidhar Crypto, a Pi Coin validator, urged users to withdraw Pi coins from centralized exchanges (CEXs) to prevent price manipulation.
“We have seen what happened to OM—how market makers dumped on users…When you deposit your Pi Coins on CEX, the Market makers will use bots to create artificial buy/sell walls to manipulate prices or Liquidity,” they warned.
This aligns with recent concerns about collusion between market makers and CEXs. Mahidhar also called for the Pi Core Team to scrutinize KYB-verified businesses and avoid listing Pi derivatives on CEXs, citing the risks of leveraged trading on still-maturing assets.
Further fanning skepticism is on-chain behavior tied to OM. Trading Digits, a technical analysis firm, pointed out that the “Pi Cycle Top” indicator, a pattern often signaling market tops, had triggered twice for OM since 2024, the most recent being just two months before its collapse.
“Coincidence or bound to happen?” the firm posed.
Will Pi follow a disciplined, utility-first path, or could it fall into the same traps that triggered OM’s downfall?
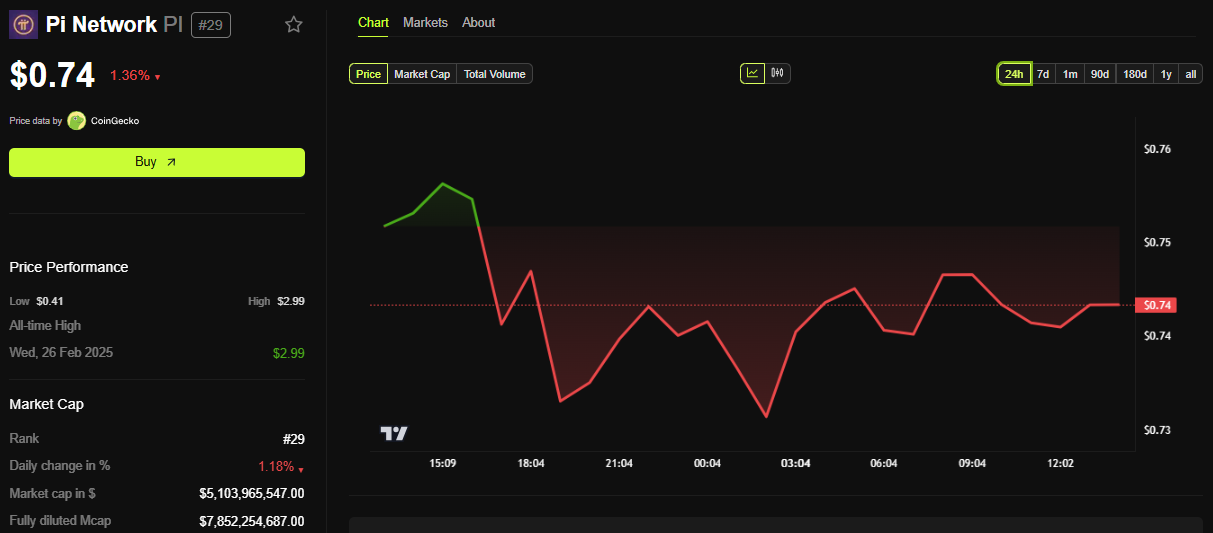
BeInCrypto data shows Pi Network’s PI coin was trading for $0.74% as of this writing, down by 1.36% in the last 24 hours.
Disclaimer
In adherence to the Trust Project guidelines, BeInCrypto is committed to unbiased, transparent reporting. This news article aims to provide accurate, timely information. However, readers are advised to verify facts independently and consult with a professional before making any decisions based on this content. Please note that our Terms and Conditions, Privacy Policy, and Disclaimers have been updated.

Dogecoin started a fresh decline from the $0.1700 zone against the US Dollar. DOGE is consolidating and might struggle to recover above $0.1650.
- DOGE price started a fresh decline below the $0.1650 and $0.1600 levels.
- The price is trading below the $0.1620 level and the 100-hourly simple moving average.
- There is a connecting bearish trend line forming with resistance at $0.1620 on the hourly chart of the DOGE/USD pair (data source from Kraken).
- The price could extend losses if it breaks the $0.1575 support zone.
Dogecoin Price Faces Rejection
Dogecoin price started a fresh decline after it failed to clear $0.170, unlike Bitcoin and Ethereum. DOGE dipped below the $0.1650 and $0.1600 support levels.
The bears were able to push the price below the $0.1585 support level. It even traded close to the $0.1575 support. A low was formed at $0.1573 and the price recently corrected some losses. There was a minor move above the 23.6% Fib retracement level of the downward move from the $0.1693 swing high to the $0.1573 low.
Dogecoin price is now trading below the $0.1620 level and the 100-hourly simple moving average. Immediate resistance on the upside is near the $0.1620 level. There is also a connecting bearish trend line forming with resistance at $0.1620 on the hourly chart of the DOGE/USD pair.
The first major resistance for the bulls could be near the $0.1635 level and the 50% Fib retracement level of the downward move from the $0.1693 swing high to the $0.1573 low.

The next major resistance is near the $0.1665 level. A close above the $0.1665 resistance might send the price toward the $0.1700 resistance. Any more gains might send the price toward the $0.1720 level. The next major stop for the bulls might be $0.1800.
Another Decline In DOGE?
If DOGE’s price fails to climb above the $0.1620 level, it could start another decline. Initial support on the downside is near the $0.1575 level. The next major support is near the $0.1540 level.
The main support sits at $0.1500. If there is a downside break below the $0.1500 support, the price could decline further. In the stated case, the price might decline toward the $0.1420 level or even $0.1350 in the near term.
Technical Indicators
Hourly MACD – The MACD for DOGE/USD is now gaining momentum in the bearish zone.
Hourly RSI (Relative Strength Index) – The RSI for DOGE/USD is now below the 50 level.
Major Support Levels – $0.1575 and $0.1540.
Major Resistance Levels – $0.1620 and $0.1665.
Layer-1 (L1) coin Cardano has recorded a 10% gain over the past week, positioning itself for an extended rally.
The altcoin is now trading close to its 20-day Exponential Moving Average (EMA), a key technical level that, if breached, could validate the ongoing rally and open the door to fresh highs.
ADA Approaches Key Breakout Zone Amid Surge in Buying Pressure
ADA currently trades near its 20-day EMA and is poised to climb above it. This key moving average measures an asset’s average price over the past 20 trading days, giving more weight to recent prices.
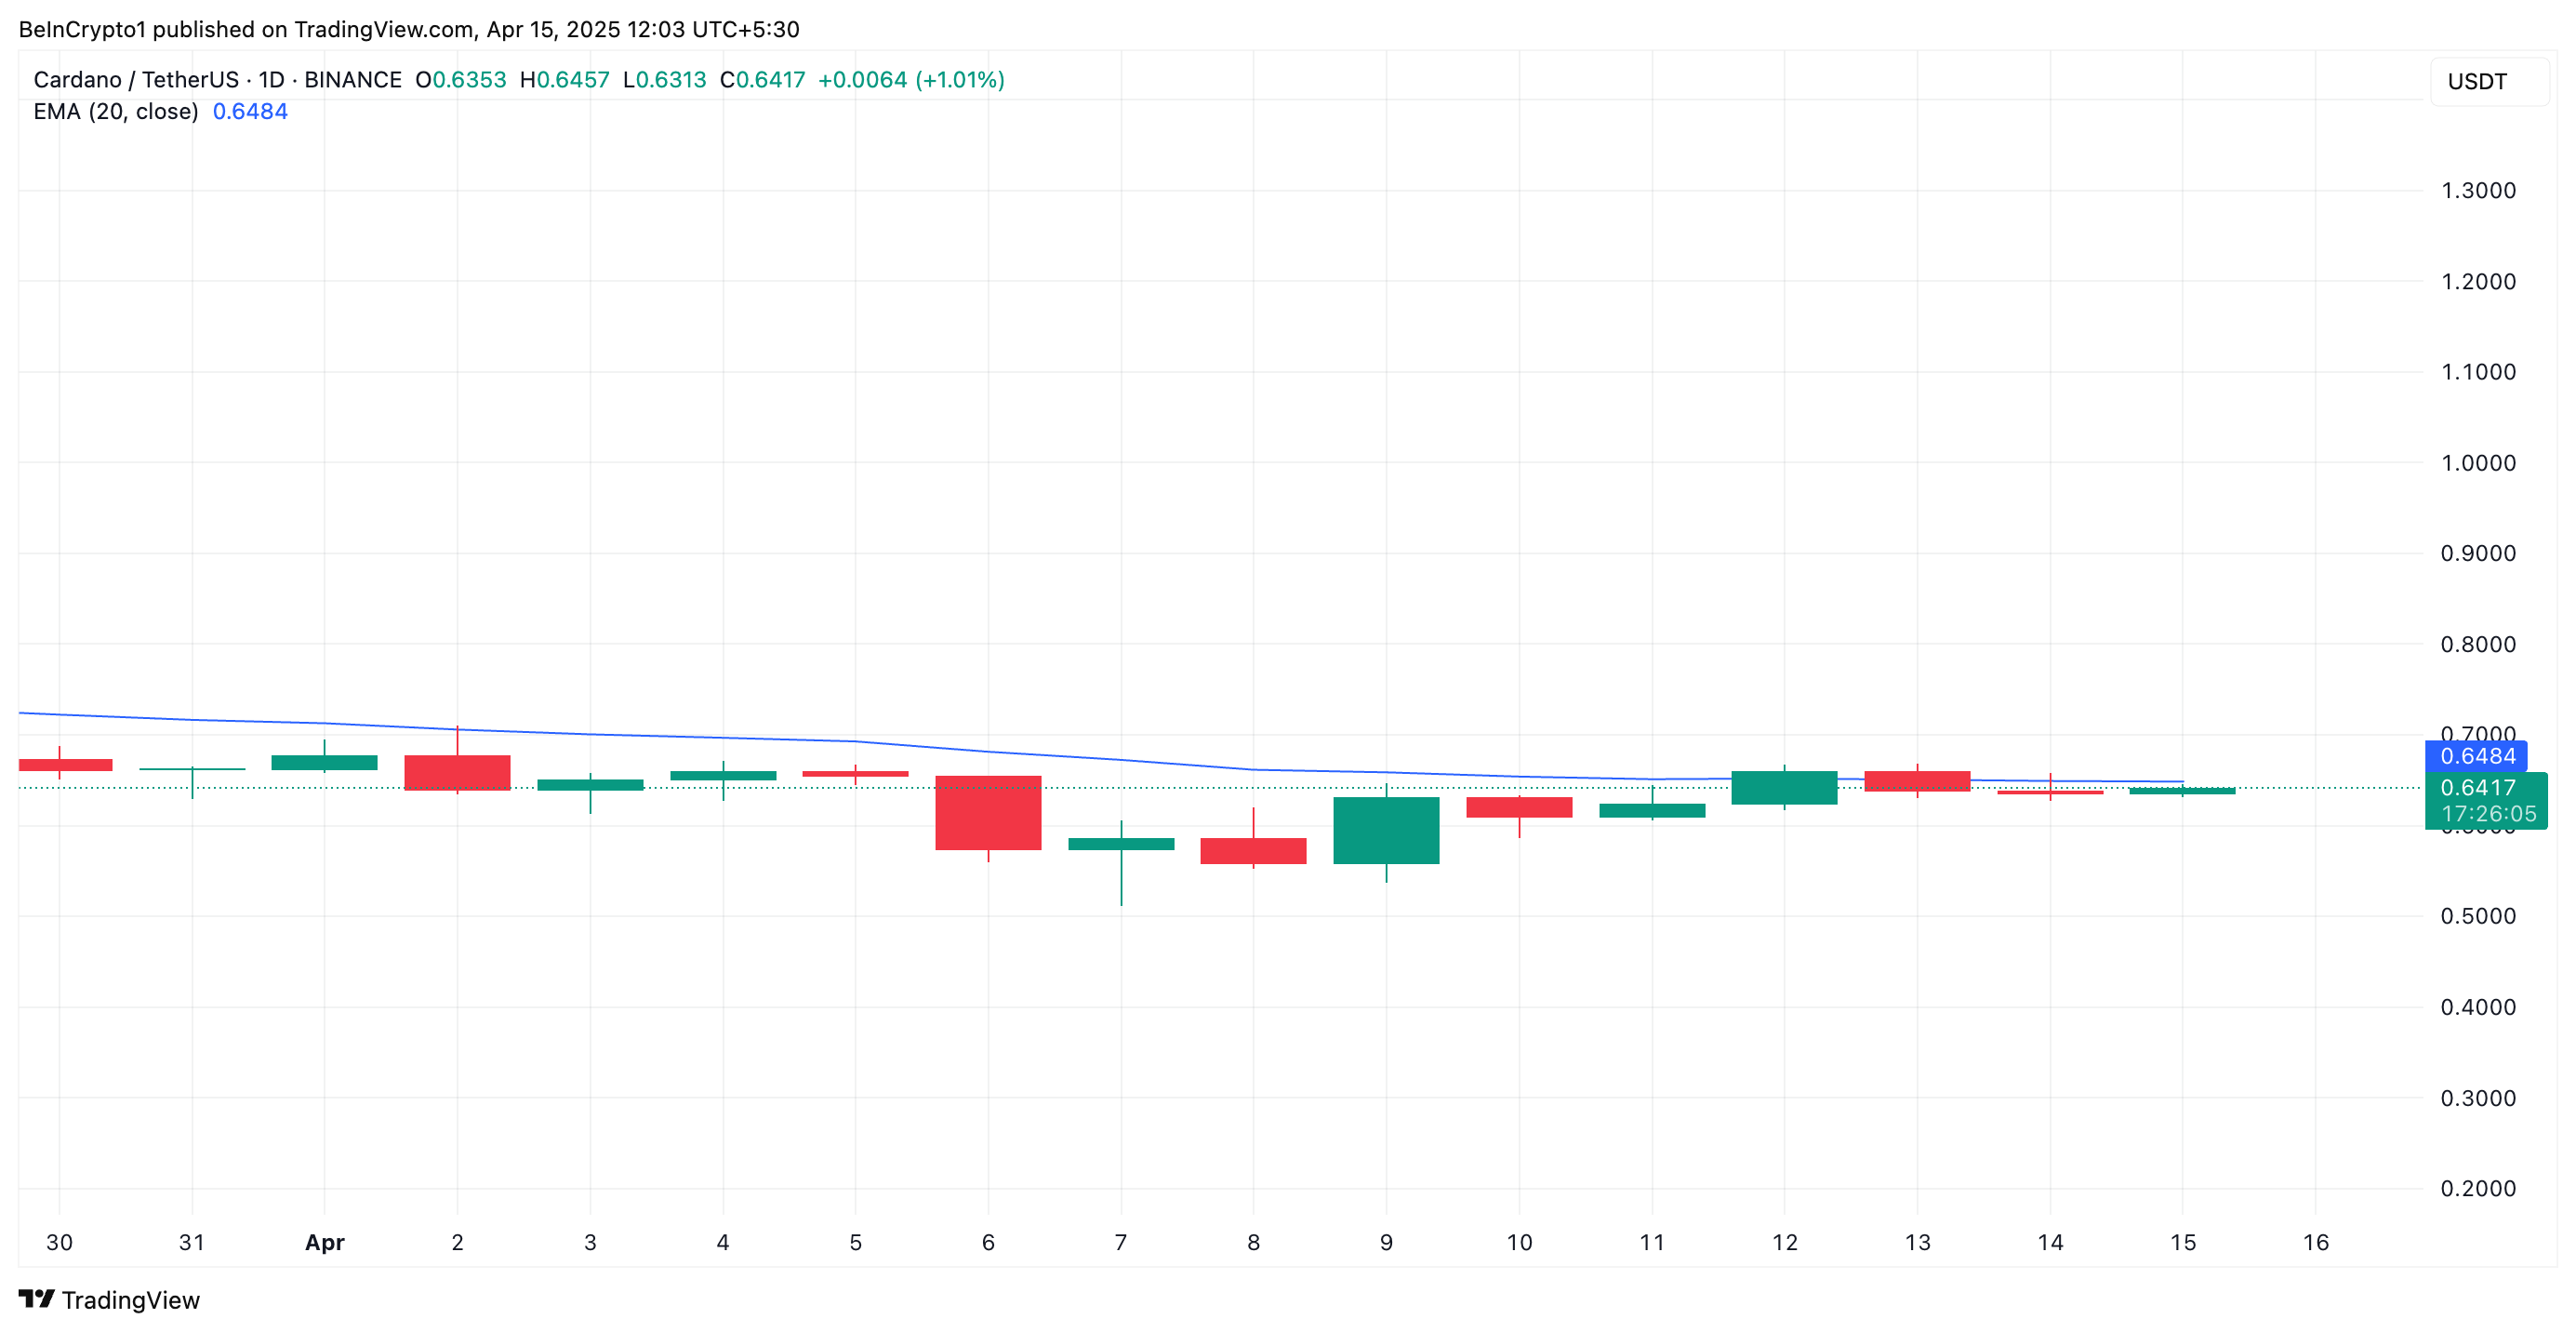
When an asset is about to rally above its 20-day EMA, it signals a shift in short-term momentum from bearish to bullish. This crossover signals that ADA buying pressure is increasing and confirms that the asset has entered an upward trend.
ADA’s successful break above the 20-day EMA would signal renewed momentum and act as a dynamic support level for the coin’s price, giving buyers more control.
On-chain metrics further support the bullish outlook. According to Santiment, ADA’s Network Realized Profit/Loss (NPL) has turned negative, indicating that most holders are currently at a loss.
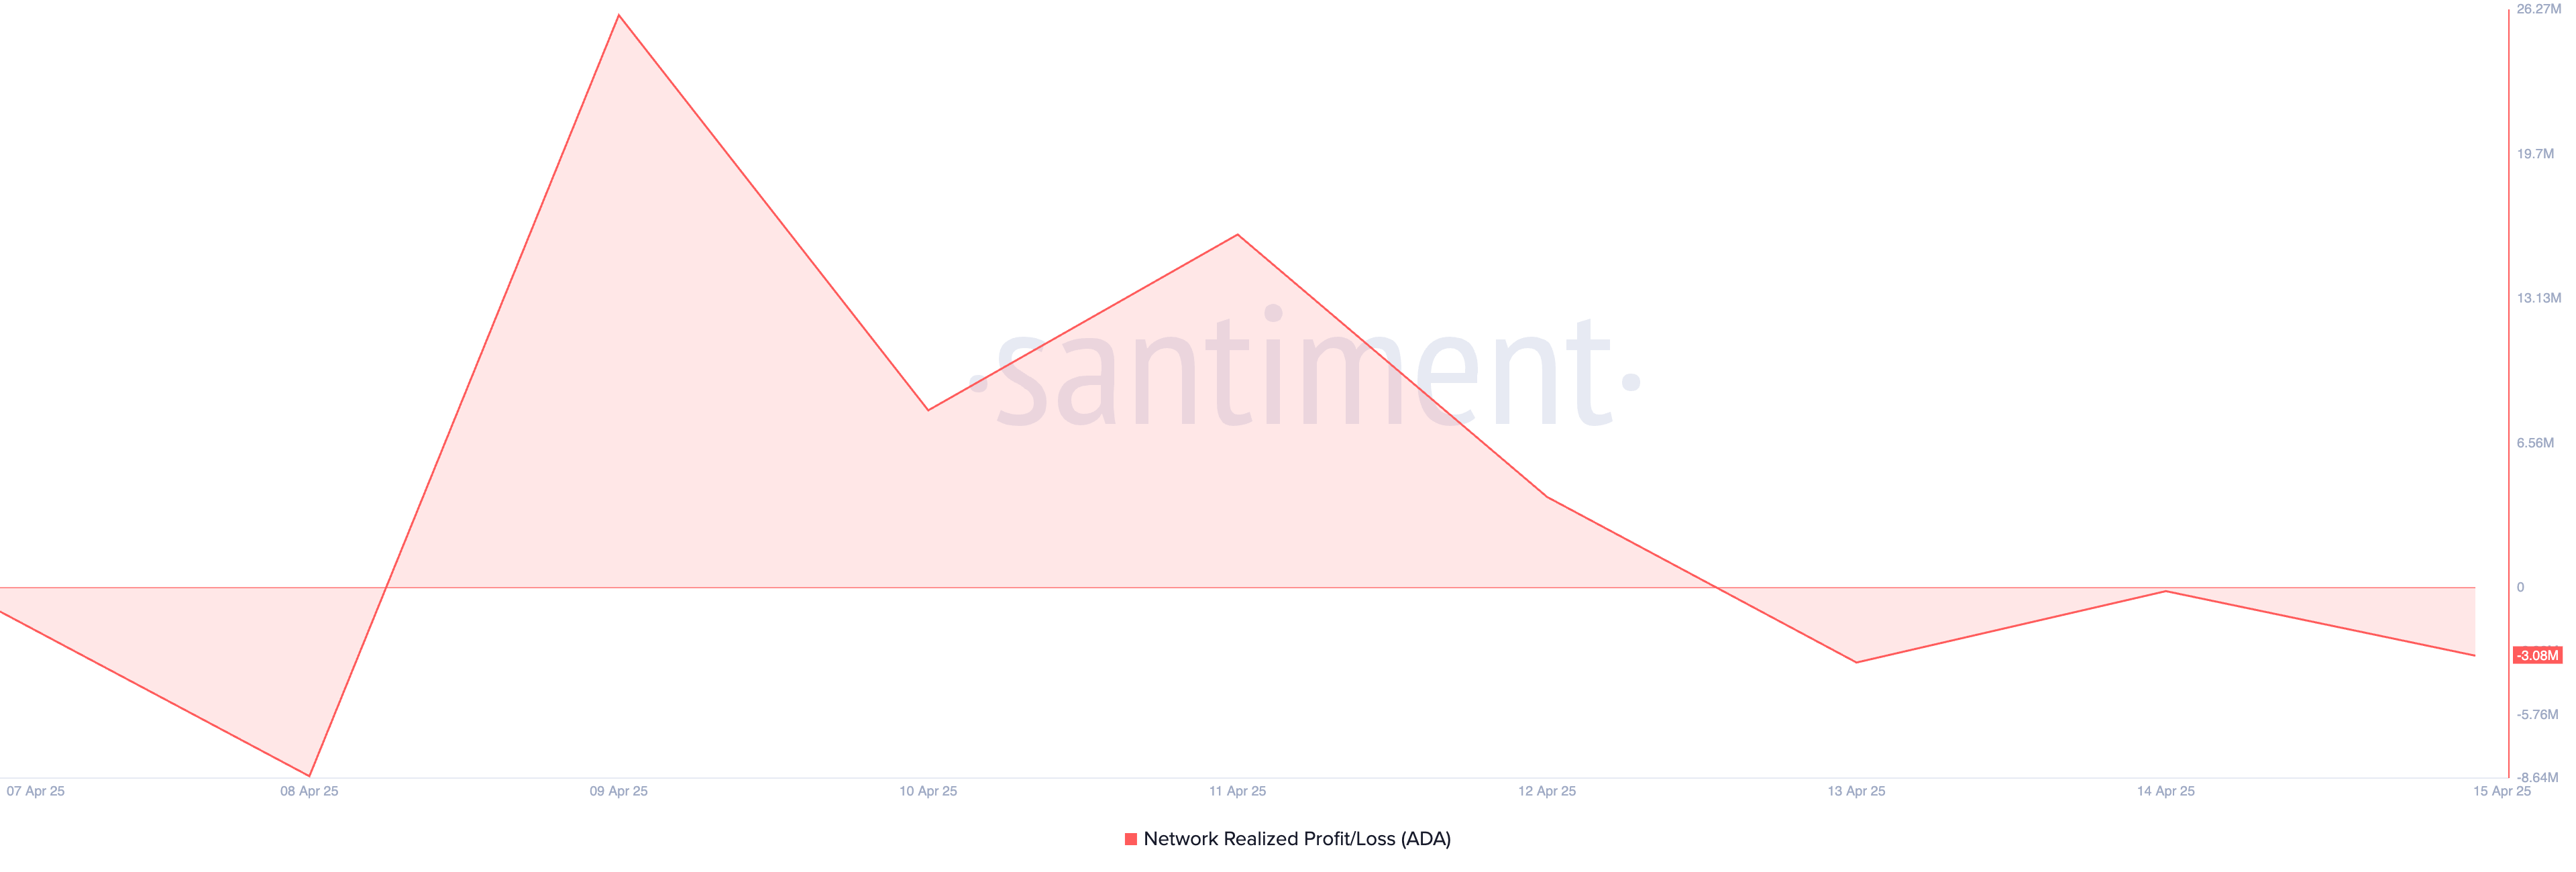
Historically, this discourages selling pressure as traders are less willing to part with their assets at a loss. This behavior encourages longer holding periods, which in turn tightens supply and can drive up ADA’s price in the short term.
Cardano Bulls in Control
On the ADA/USD one-day chart, the coin’s positive Chaikin Money Flow (CMF) reinforces this bullish outlook. At press time, this indicator, which measures how money flows into and out of an asset, is at 0.04.
A positive CMF reading like this indicates that buying pressure outweighs selling pressure. It reflects strong capital inflows into ADA, suggesting that its investors are accumulating rather than offloading their positions. ADA could extend its rally and climb to $0.70 if this trend persists.
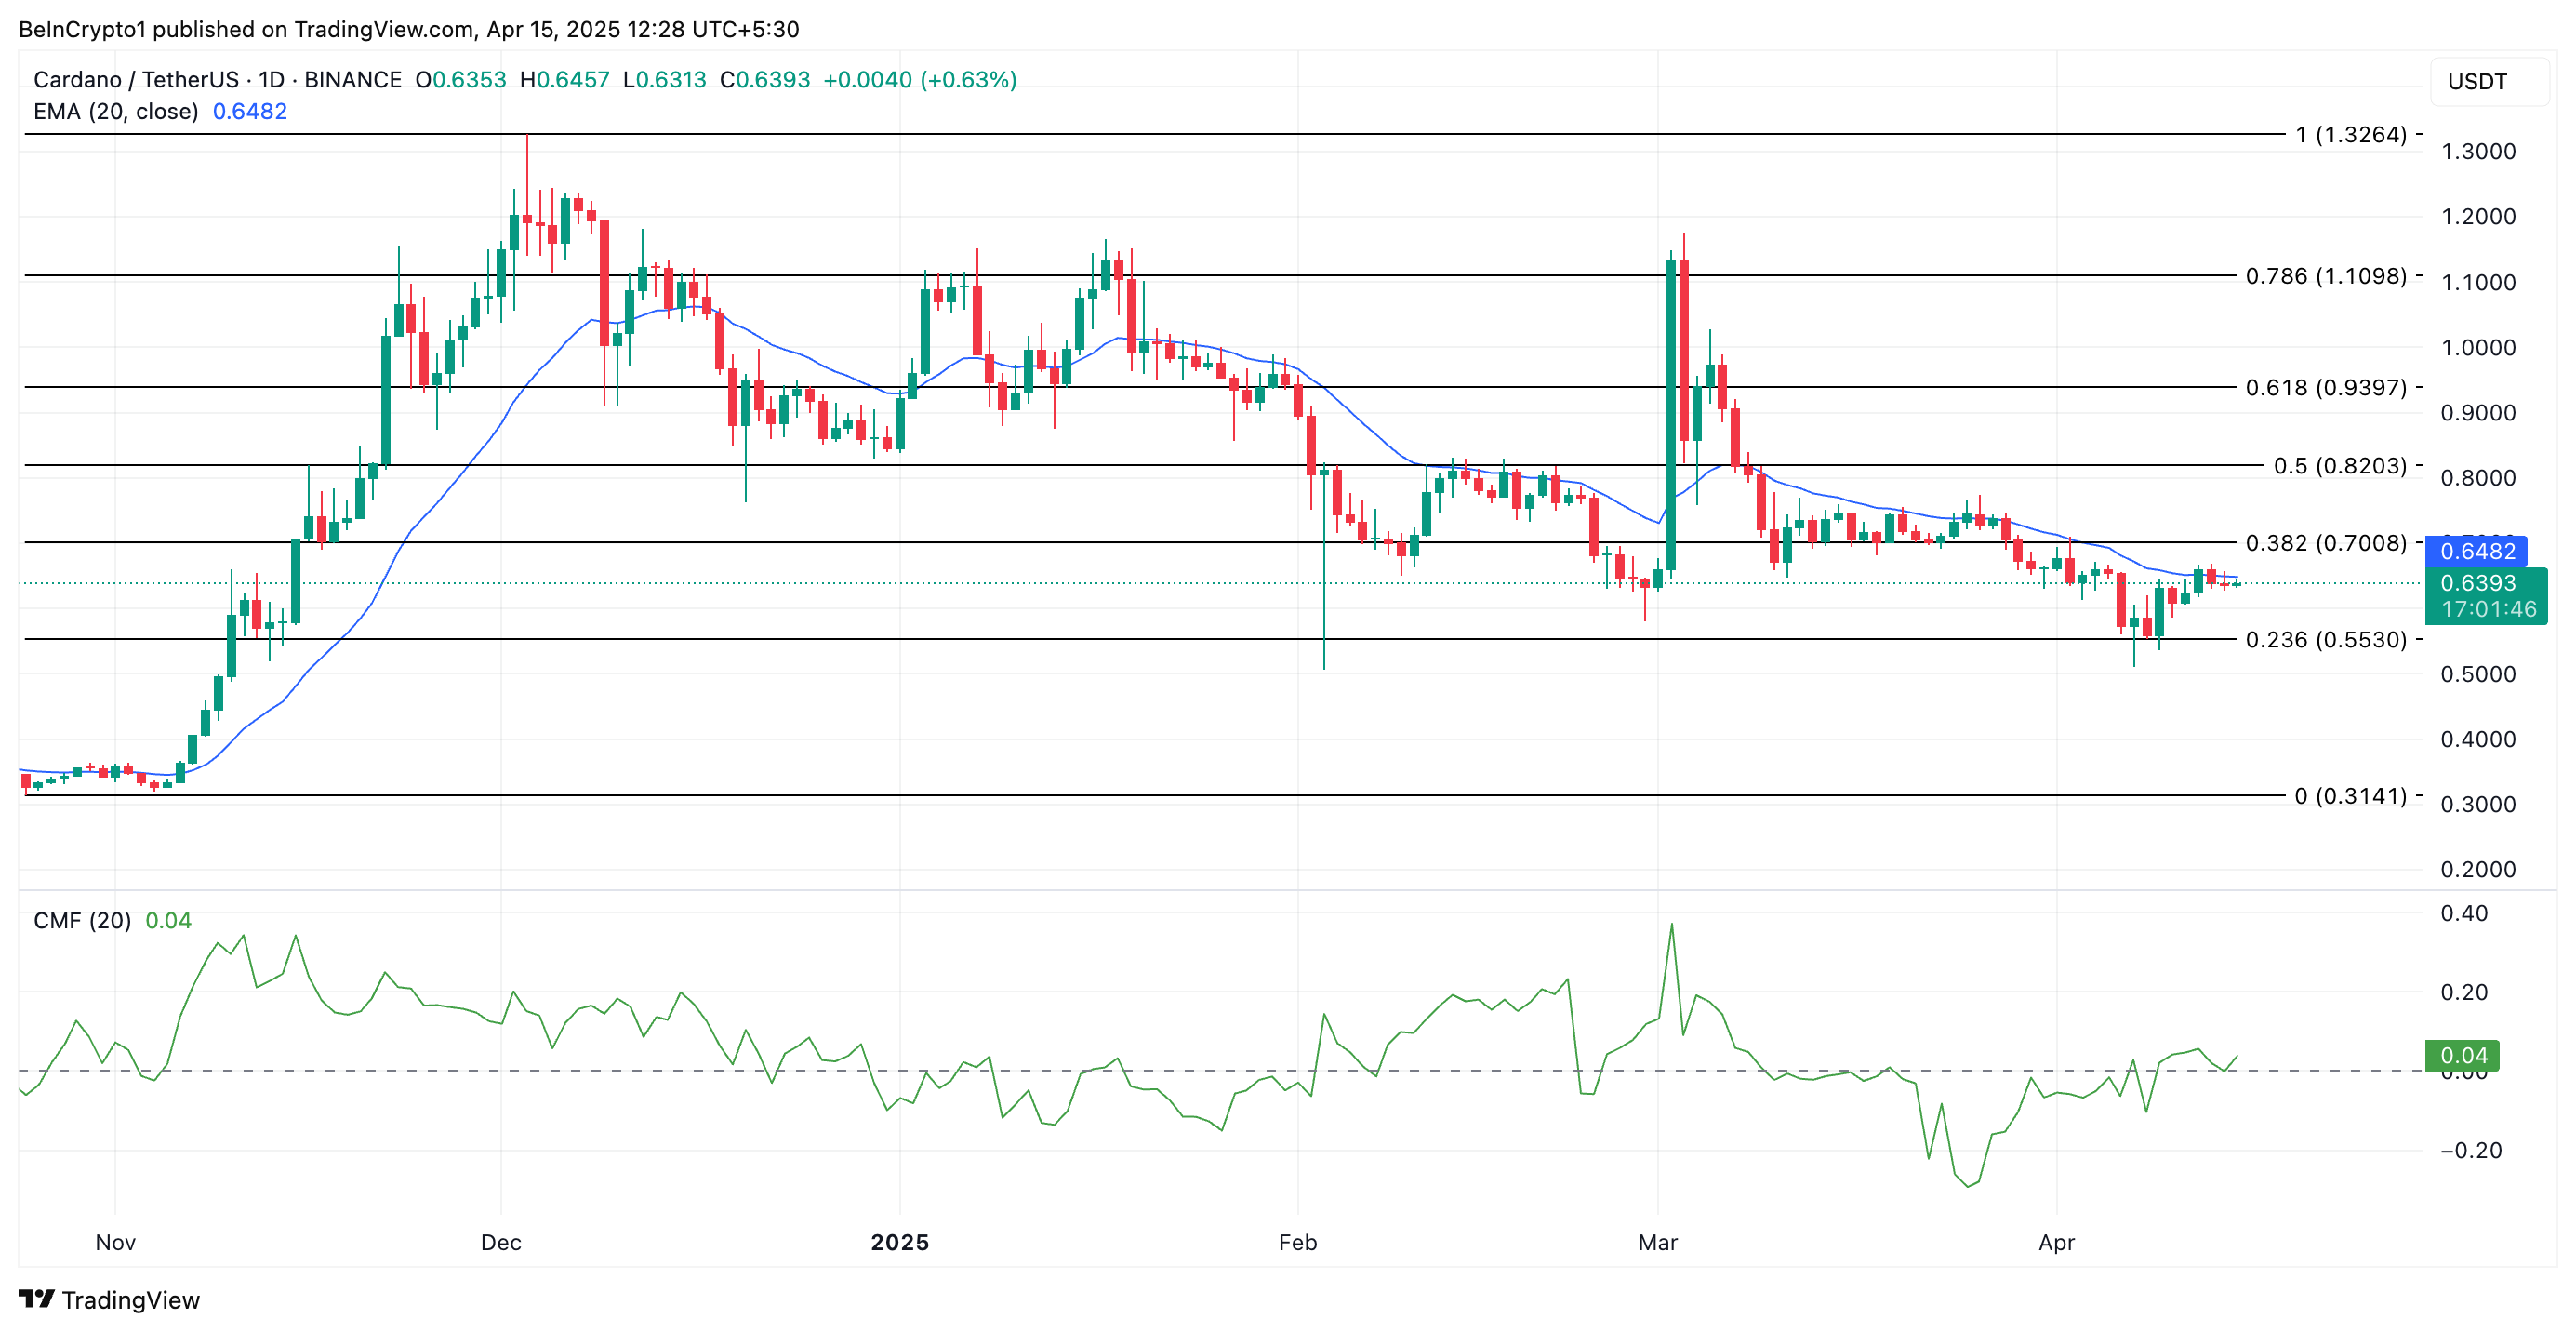
However, if profit-taking resumes, ADA could reverse its rally and fall to $0.55.
Disclaimer
In line with the Trust Project guidelines, this price analysis article is for informational purposes only and should not be considered financial or investment advice. BeInCrypto is committed to accurate, unbiased reporting, but market conditions are subject to change without notice. Always conduct your own research and consult with a professional before making any financial decisions. Please note that our Terms and Conditions, Privacy Policy, and Disclaimers have been updated.

Binance Delists This Crypto Causing 40% Price Crash, Here’s All

Can Pi Network Avoid a Similar Fate?

Dogecoin (DOGE) Derailed? Meme Coin Faces New Hurdles to Fresh Surge
Bitcoin Poised for Summer Rally as Gold Leads and Liquidity Peaks

Cardano Buyers Eye $0.70 as ADA Rallies 10%

XRP Price Could Regain Momentum—Is a Bullish Reversal in Sight?

2.52 Million Altcoins Are Ruining Crypto’s Future

Animoca Brands Valuation Tanks 75% In Two Years, Here’s Why

Crypto exchange BingX hacked for $43 million

Are The Big Players Losing Interest?

Hong Kong’s Securities Association Tips Authorities On Crypto Self-Regulation

Coinbase cbBTC Set to go Live on Solana
2.52 Million Altcoins Are Ruining Crypto’s Future
Animoca Brands Valuation Tanks 75% In Two Years, Here’s Why
Crypto exchange BingX hacked for $43 million
Are The Big Players Losing Interest?
Hong Kong’s Securities Association Tips Authorities On Crypto Self-Regulation
Coinbase cbBTC Set to go Live on Solana
-

 Market23 hours ago
Auto.fun Launchpad Set to Debut Amid Fierce Market Rivalry
-
 Altcoin23 hours ago
XRP Price Climbs Again, Will XRP Still Face a Death Cross?
-

 Market18 hours ago
MENAKI Leads Cat Themed Tokens
-
 Altcoin22 hours ago
Analyst Predicts Dogecoin Price Rally To $0.29 If This Level Holds
-

 Market17 hours ago
Tether Deploys Hashrate in OCEAN Bitcoin Mining Pool
-

 Bitcoin23 hours ago
Crypto Outflows Hit $795 Million On Trump’s Tariffs & Market Fear
-

 Market16 hours ago
3 Altcoins to Watch in the Third Week of April 2025
-

 Market13 hours ago
Binance Futures Causes a Brief Crash For Story (IP) and ACT