
Altcoin
Has The Dogecoin Price Bottomed Out? Analyst Points Out ‘Critical Decision Zone’

Dogecoin price action is at a critical decision zone, according to a new technical analysis shared by a crypto analyst on TradingView. This analysis comes as Dogecoin bulls accumulate in the $0.16 range to successfully defend this price level in the past 24 hours.
The price action has pushed the meme coin to currently retesting a historical support area, and the coming days will determine whether Dogecoin breaks lower or begins a recovery toward the $0.20 region.
Dogecoin Nears Support With Bearish Triangle Formation
The analyst noted that Dogecoin is trading within a descending triangle pattern, a typically bearish structure that could see the price continue downward if support is broken. This support is situated at the horizontal zone between $0.164 and $0.18, highlighted as an accumulation area where buyers have previously stepped in.
The Ichimoku Cloud indicates a persistent bearish trend, but the analyst flagged some early signs of exhaustion in downward momentum that suggests that Dogecoin might be bottoming at $0.16. However, confirmation is required before deciding about any bullish momentum. For instance, the Relative Strength Index (RSI) has fallen to around 32.98, nearing oversold territory but not yet showing strong divergence.
Simultaneously, the Wave Trend Oscillator (WTO) is also deep in the oversold zone, with its signal lines beginning to curl upward that shows a possible short-term bounce. On the other hand, the Moving Average Convergence Divergence (MACD) still hasn’t confirmed a reversal, as its signal line has yet to be crossed.
Selling Pressure Continues To Linger
Dogecoin has spent the larger part of the past seven days around $0.16. Interestingly, the analyst noted that the MACD histogram is shrinking on the negative side, showing bearish momentum is weakening. However, the formation of lower highs reveals that sellers are still exerting pressure, preventing any meaningful upward move.
The cluster algo, which tracks potential market inflection points, has not yet flashed a strong bullish signal. Still, the compression of its lines shows that a breakout either up or down may be very close. The analyst refers to this as a “critical decision zone,” where a firm defense of the $0.164 level could cause a move back toward $0.20 or even $0.21, coinciding with the 0.236 Fibonacci retracement level. Beyond that, a break above $0.21 and strong buying volume could push the Dogecoin price until it reaches strong further resistance at $0.28 and subsequently $0.455, according to the 0.786 Fibonacci level.
Should Dogecoin fail to hold the $0.164 support, the price could retrace further until it reaches the $0.11 to $0.12 zone seen in market lows. Such a move would essentially see Dogecoin returning to price levels it hasn’t traded in since Q4 2023.
At the time of writing, Dogecoin was trading at $0.1696.
Featured image from Technext, chart from TradingView
Editorial Process for bitcoinist is centered on delivering thoroughly researched, accurate, and unbiased content. We uphold strict sourcing standards, and each page undergoes diligent review by our team of top technology experts and seasoned editors. This process ensures the integrity, relevance, and value of our content for our readers.


Solana-based meme coin Fartcoin price is eyeing the next potential rally as per the latest analysis.
Despite currently trading well below its all-time high of $2.48 reached on January 19, 2025, Fartcoin has been forming a bullish pattern that could set the stage for upward movement.
Fartcoin Price Analysis Shows Potential Path To $1.29 Resistance
According to Rekt Capital’s analysis, Fartcoin has been following a predictable technical pattern that could lead to higher prices if key levels hold. The analyst notes that after identifying a potential path in mid-March, “FARTCOIN has progressively followed through on that path.”
The technical formation described includes the development of a “Bull Flag” pattern, with the price pulling back to the origin point of what the analyst calls “the blue path” for a successful retest via a downside wick. Following this retest, Fartcoin rallied over 140%.
The key resistance level to watch is $1.29, marked as “blue highs” in the analysis. However, reaching this target depends on Fartcoin’s ability to break and hold above the “black Range High” of approximately $0.82. The analyst notes that a “past Weekly Close above the ~$0.82 level has enabled upside in the past.” This analysis comes after Fartcoin slumped amid macroeconomic uncertainties.
Major Fartcoin support points to search for upward growth
Rekt Capital sees important price points Fartcoin needs to hold onto to remain strong. The report says if FARTCOIN is able to get a “Weekly Close within the black-black range, inside the orange circle, then it could allow for more buying within the range.”
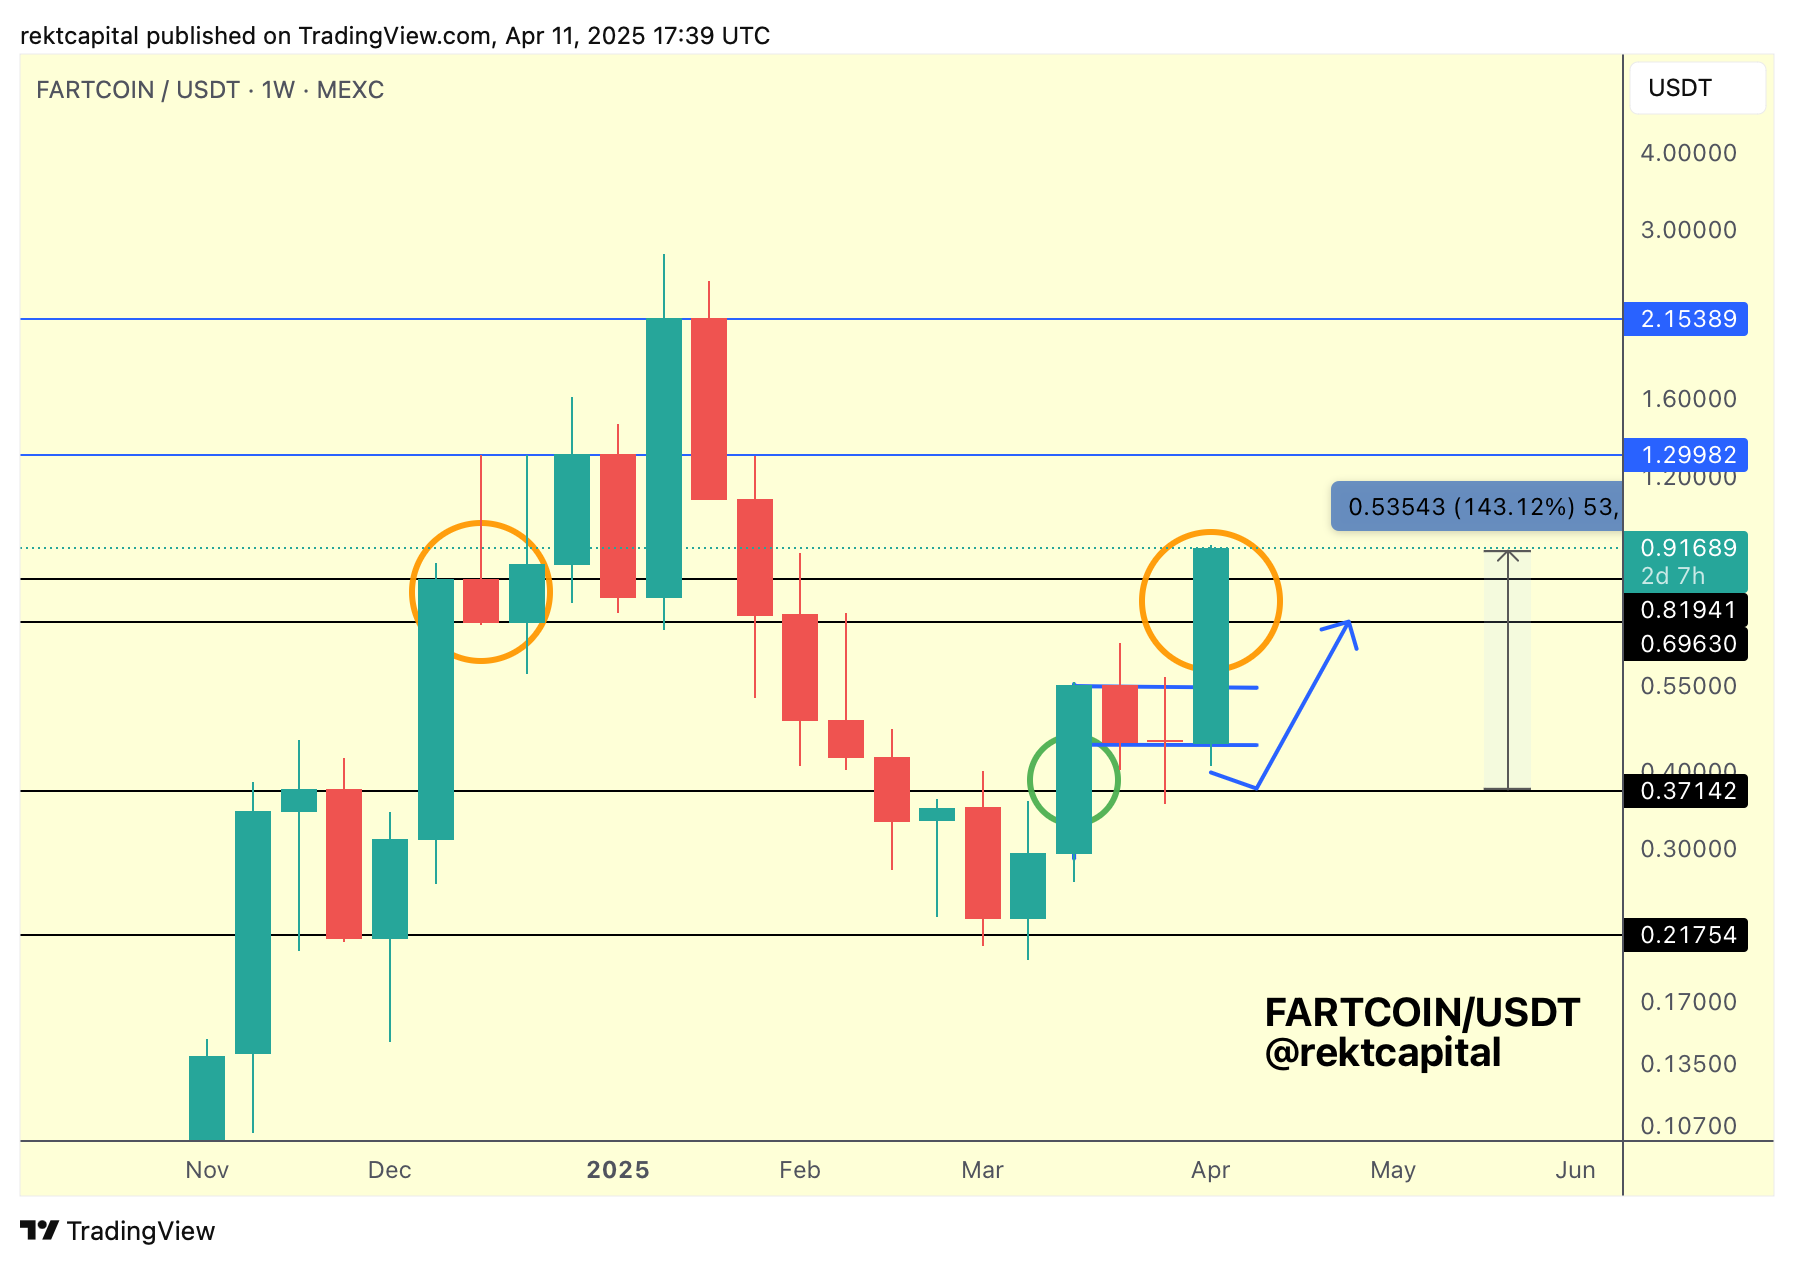
More significantly, a “Weekly Close above the black Range High of ~$0.82” might unlock further upside potential. Here, the analyst indicates that price might do a “post-breakout retest” of this level. This action might turn it new support and validate a trajectory towards the $1.29 resistance level.
The $0.37 is the uppermost of the current range and is the first barrier for Fartcoin to breach in order to achieve even greater prices. Breaking through this resistance would be the first sign of further positive action.
In short, the analyst states that “FARTCOIN just has to remain above either of the black levels if it does pull back, and satisfying this requirement would leave the price in position to return to $1.29 (blue highs) later.”
Solana Meme Coins’ Performance Mirrors Sustained High Market Interest
Fartcoin price performed amazingly well on various time frames. Statistics indicate the token rising by 75.7% over the past 7 days and a whopping 205.9% over the past 30 days. The Solana meme coin also jumped 20% on April 11 amidst the market crash.
Despite all this, Fartcoin is still 64.7% off its all-time high of $2.48. This means there could be a possibility of recovery if the market is still strong and technical support is upheld. While Fartcoin hasn’t shown any major spikes in 24 hours, Solana’s price is up over 5%.
Following what Rekt Capital calls a “successful retest,” the token has bounced over 140% from its recent low. This validates the technical pattern pointed out by the analyst. This sudden turnaround has piqued interest in the token’s potential to return to its previous highs.
Vignesh Karunanidhi
Vignesh Karunanidhi is a seasoned crypto journalist with nearly 7 years of experience in the cryptocurrency industry. He has contributed to numerous publications, including WatcherGuru, BeInCrypto, Milkroad, and authored over 10,000 articles
Disclaimer: The presented content may include the personal opinion of the author and is subject to market condition. Do your market research before investing in cryptocurrencies. The author or the publication does not hold any responsibility for your personal financial loss.
The latest update from crypto exchange titan Binance has left traders speculating over a potential price impact on 10 crypto assets. An official press release by the exchange on Saturday, April 12, revealed that the collateral ratio of 10 tokens under portfolio margin is being updated. These tokens include DENT, ENJ, NOT, DASH, CHZ, AXS, ENS, SAND, THETA, and QNT.
Binance Updates Collateral Ratio For 10 Crypto Under Portfolio Margin
According to a recent Binance announcement, collateral ratios for the abovementioned crypto tokens will primarily be reduced shortly ahead. The exchange revealed that the new ratios will be visible on the platform starting April 18 at 06:00 UTC. This phenomenon raises market concerns as lower collateral ratios mean reduced borrowing power.
Market participants can use less of these assets’ value as collateral. This also shrinks their margin buying power, limiting their ability to open or maintain trade positions. Broadly speaking, the impact could be forced portfolio adjustments as market participants look to mitigate potential losses.
Here Are The New Collateral Ratios

Binance added that the update will also affect the Unified Maintenance Margin Ratio (uniMMR). “Users should monitor uniMMR closely to avoid any potential liquidation or losses that may result from the change of collateral ratio,” the leading crypto exchange notified.
How Are The Crypto Performing?
As mentioned above, the new update ignited cautious investor sentiments about the assets’ prices due to the downsized market and trade offerings. Nevertheless, most of the mentioned crypto tokens have traded in the green against the backdrop of the broader crypto market trend.
DENT price was up by 3% and traded at $0.0006567. ENJ price also jumped over 2% and exchanged hands at $0.06690. NOT price witnessed a slight 1% increase in value, closing in at $0.001882. DASH price was also up nearly 2% to $20.69.
ENS price soared nearly 3% and exchanged hands at $14.37. SAND price likewise gained nearly 0.5% to reach $0.2609. Also, QNT price surged roughly 2.5% and is currently sitting at $65.77. On the other hand, tokens like CHZ, AXS, and THETA traded in red territory. Market watchers continue to thoroughly eye the tokens for price action shifts ahead.
It’s also worth mentioning that Binance has revealed plans to list ONDO, VIRTUAL, and BIGTIME tokens recently, further revolutionizing its trade offerings.
Coingape Staff
CoinGape comprises an experienced team of native content writers and editors working round the clock to cover news globally and present news as a fact rather than an opinion. CoinGape writers and reporters contributed to this article.
Disclaimer: The presented content may include the personal opinion of the author and is subject to market condition. Do your market research before investing in cryptocurrencies. The author or the publication does not hold any responsibility for your personal financial loss.
Shiba Inu burn rate continues to deal a massive blow to the meme coin’s circulating supply, surging nearly 1000% this Saturday. Recent statistics from the token’s official burn tracker revealed that almost 17 million coins were removed from the circulating supply in just a day.
As a result, crypto traders and investors anticipate a highly bullish price trajectory for the token ahead, abiding by economic principles. Simultaneously, SHIB Knight, a renowned community member, has further asserted that a $0.000015 price target for the token looms right over the horizon.
Shiba Inu Burn Rate Bursts 1000%, What’s Fueling The Surge?
According to the latest data from Shibburn on X, the Shiba Inu burn rate has surged 984.58% in the past 24 hours. As per the data, 16.94 million coins have been removed from the total supply over the past day.

Following the abovementioned burn chronicle, the total number of coins burnt to date was evaluated as 410.74 trillion tokens. Further, the total circulating supply shredded down to 584.37 trillion SHIB tokens at the time of reporting.
Notably, two separate wallet addresses were collectivelyggested that the responsible for boosting the Shiba Inu burn rate today. Shibburn’s data suwallet addresses “0xa9d1e08c7” and “0xa20833” burnt 10 million and 4.3 million SHIB tokens, respectively.
Traders and investors view this saga as bullish news, given that supply reduction could prompt a price upswing even if the demand for the asset remains the same.
SHIB Price Eyes $0.000015?
At the time of reporting, SHIB coin’s price jumped over 3% and exchanged hands at $0.00001220. The meme coin pumped from a low of $0.00001183 over the past day. This price upswing mirrors a bullish impact fueled via the recent SHIB burn rate surge.
Besides, the price upswing also falls in line with today’s broader market trend, signaling that a recovery-like trend is cooking. Bitcoin price regained a hold above $83K after slipping as low as $74K this week. Altcoins and meme coins have mainly mimicked this uptrend, with Shiba Inu recovering from a weekly low at the $0.000010 level.
In response, broader market sentiments orbiting the meme coin are already optimistic. Moreover, community member SHIB Knight has posted on X amid this upswing, revealing that $0.00001570 is the short-term price target. Market participants remain highly optimistic as the meme coin has shown the potential to achieve such a feat ahead.
Coingape Staff
CoinGape comprises an experienced team of native content writers and editors working round the clock to cover news globally and present news as a fact rather than an opinion. CoinGape writers and reporters contributed to this article.
Disclaimer: The presented content may include the personal opinion of the author and is subject to market condition. Do your market research before investing in cryptocurrencies. The author or the publication does not hold any responsibility for your personal financial loss.
Solana Meme Coin Fartcoin Price Could Hit $1.29 If It Holds This Key Level

Binance Reportedly Seeks Reentry Into American Market
Binance Reportedly Seeks Reentry Into American Market

Binance Issues Important Update On 10 Crypto, Here’s All

Dogecoin and D.O.G.E – Elon Musk’s Billionaire Crypto Experiment

Arthur Hayes Expects Bitcoin Surge if Fed Injects Liquidity


-

 Market24 hours ago
HBAR Buyers Fuel Surge with Golden Cross, Suggesting Upside
-

 Market23 hours ago
China Raises Tariffs on US to 125%, Crypto Markets Steady
-

 Altcoin24 hours ago
Sonic Surges to $1 Billion TVL in 66 Days Amid DeFi Market Slump
-

 Bitcoin23 hours ago
Is Bitcoin Ready for Another Surge?
-

 Market14 hours ago
This is Why The Federal Reserve Might Not Cutting Interest Rates
-
 Market22 hours ago
Binance, Trade Wars, Ripple and SEC
-

 Regulation18 hours ago
US Senators Reintroduce PROOF Act To Set Reserve Standards for Crypto Firms
-

 Market18 hours ago
3 Altcoins to Watch for Binance Listing This April
 Arabic
 Chinese (Simplified)
 Dutch
Dutch English
 French
 German
 Italian
 Portuguese
 Russian
 Spanish
 Vietnamese
✓ Share: