
Market
IMX Price Nears All-Time Low After 30 Million Token Sell-Off

Immutable’s (IMX) price has been on a significant downtrend recently, falling to multi-year lows. The token has suffered a sharp decline, and its price is currently hovering around $0.433.
If the current trend continues, there is a possibility that IMX could form a new all-time low (ATL).
Immutable Investors Are Giving Up
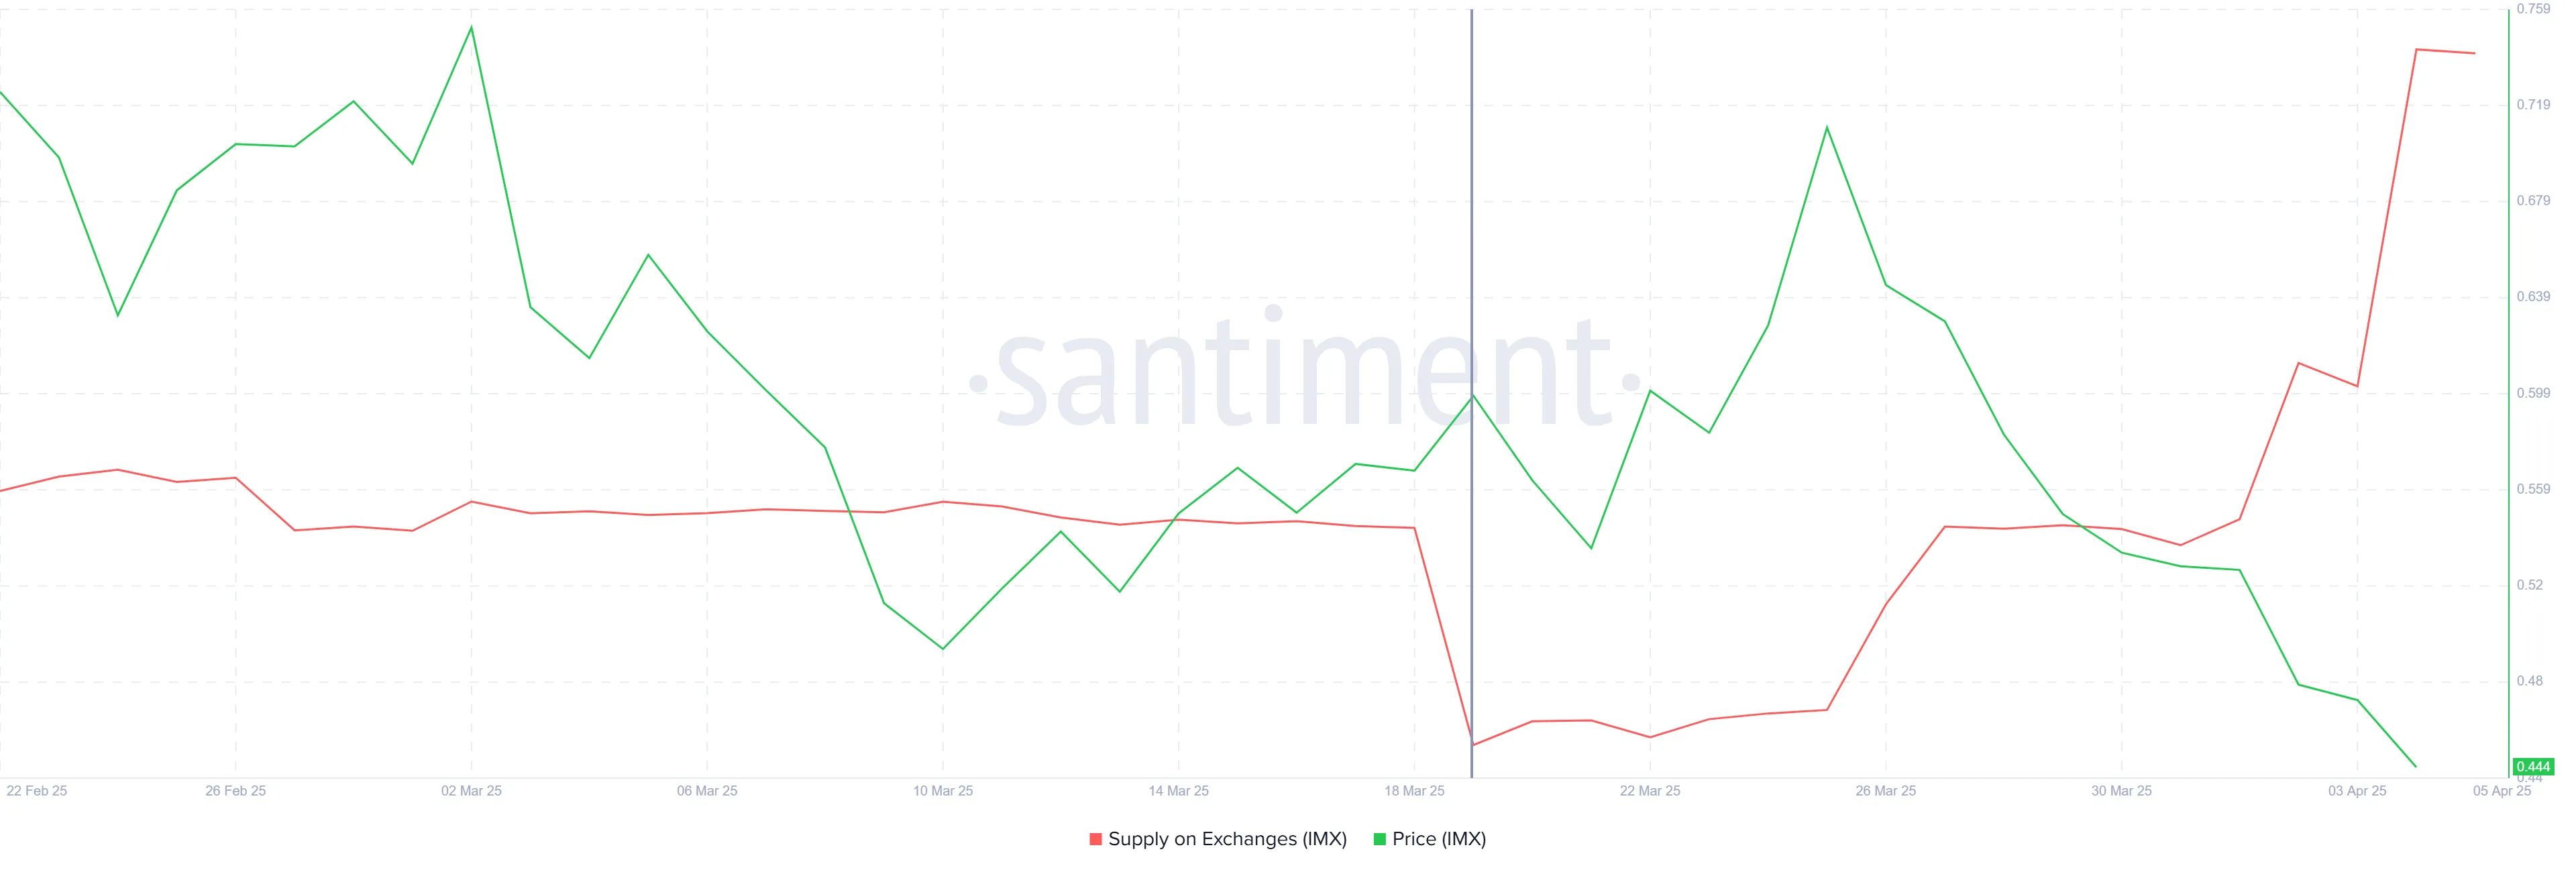
The supply of Immutable on exchanges has risen dramatically in the past two weeks. A total of 30 million IMX tokens have been added, increasing the overall supply to 165 million IMX. This surge in supply is worth approximately $13 million and indicates a shift in investor sentiment.
As investors begin to sell off their holdings, this suggests growing skepticism about the token’s future prospects. The trend has led to an increase in selling pressure, which further exacerbates the current price decline.
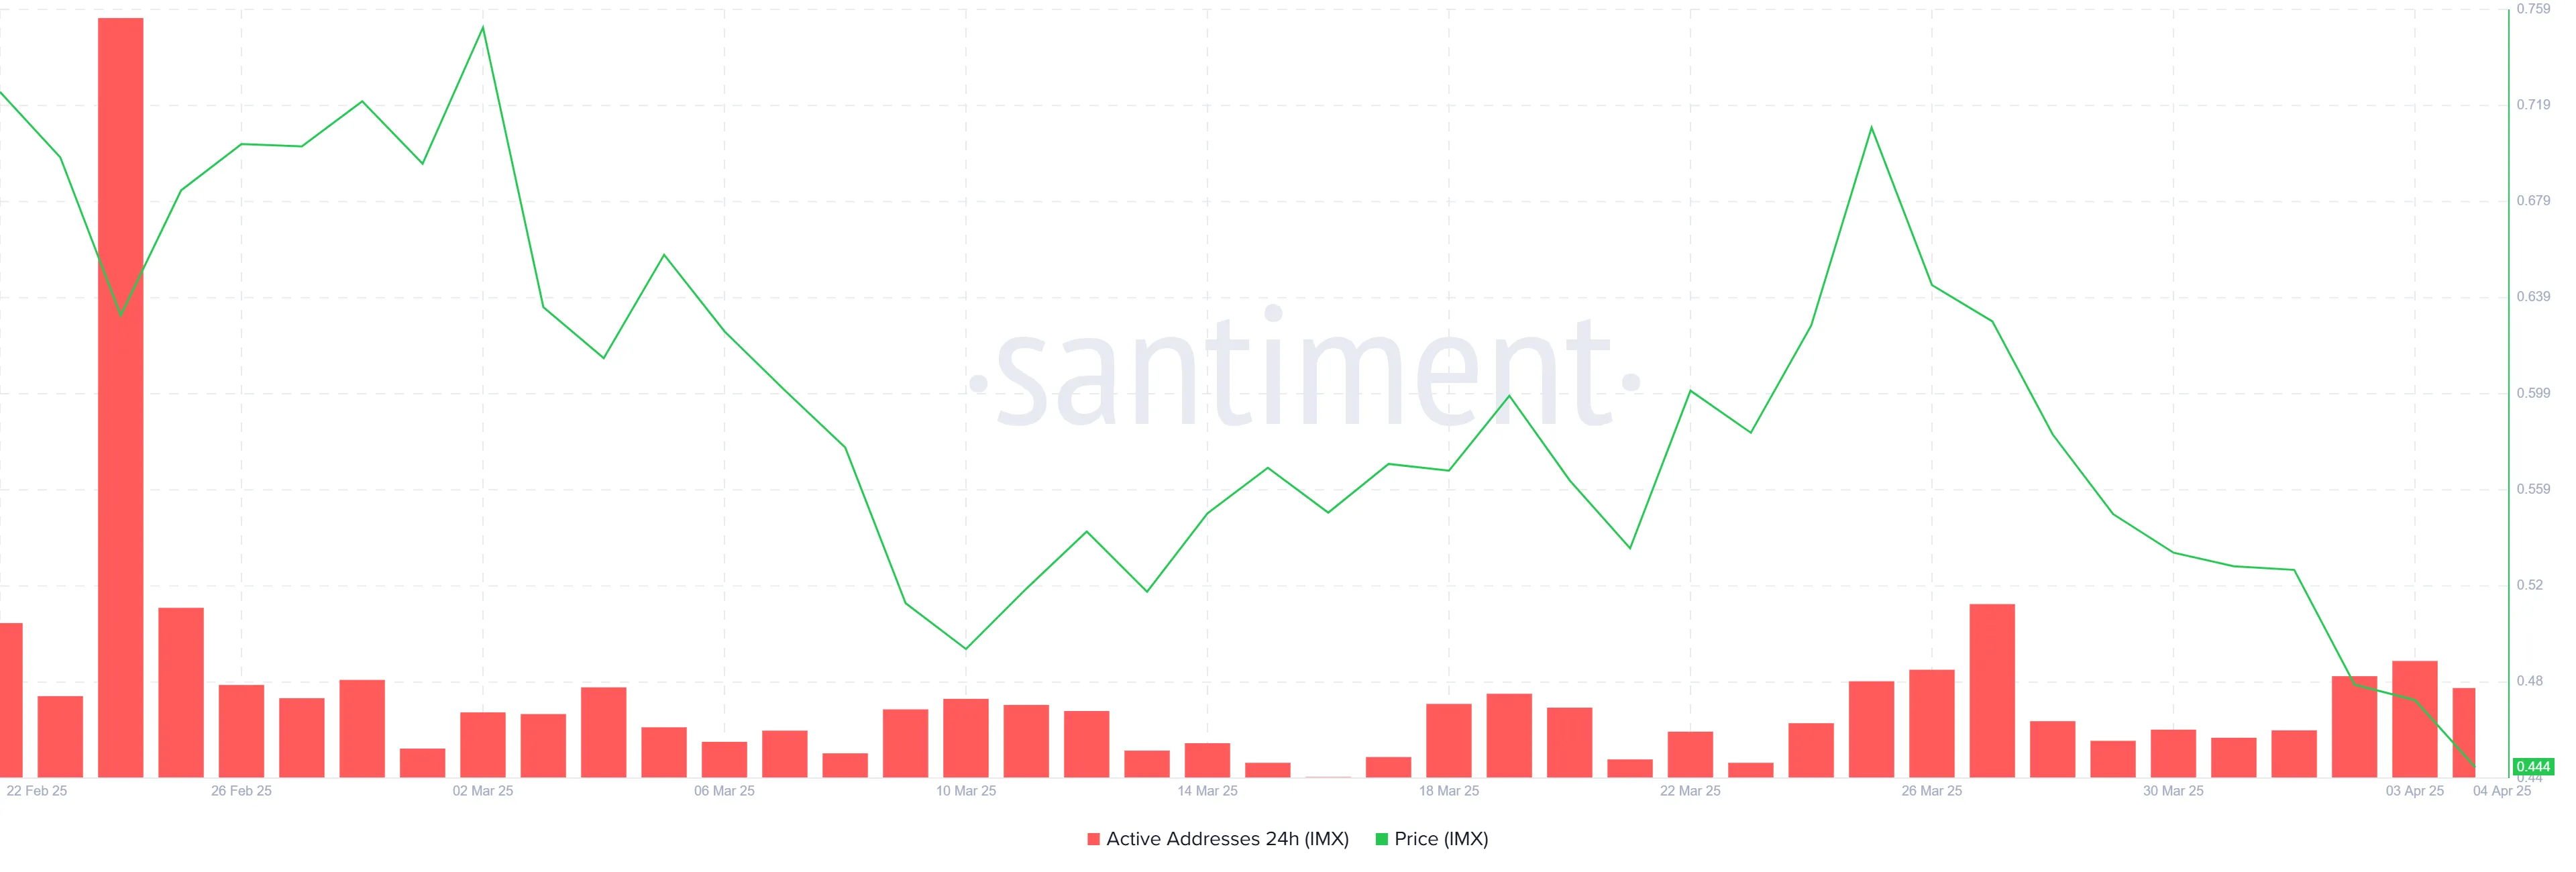
The overall macro momentum for Immutable appears to be unfavorable at this point. Active addresses, which measure the number of unique addresses engaging with the network, are at a low level. The lack of participation reflects investor hesitation and reduced confidence in the token’s potential.
When fewer addresses are interacting with the network, it generally indicates a lack of new capital entering the market. As a result, this decline in activity has contributed to the negative sentiment surrounding IMX.
IMX Price Needs A Reversal
IMX price is down nearly 40% over the past two weeks, with the 30 million token sell-off playing a significant role in the decline. At the time of writing, the price is at $0.433, holding just above the critical support level of $0.400. If this support is broken, the price could fall further, potentially reaching $0.375 or below, resulting in a new all-time low.
The continued drawdown suggests that the token may not see a recovery soon unless the market conditions improve. If IMX manages to hold above $0.400, there is a slim chance it could stabilize before testing further resistance levels. However, breaking through the $0.400 support would likely lead to more losses.

For a more optimistic scenario, IMX would need to reclaim the support level of $0.508. This could pave the way for a potential recovery, allowing the price to rise toward $0.684.
A successful breach of these levels could invalidate the bearish outlook and offer some hope for reversing recent losses.
Disclaimer
In line with the Trust Project guidelines, this price analysis article is for informational purposes only and should not be considered financial or investment advice. BeInCrypto is committed to accurate, unbiased reporting, but market conditions are subject to change without notice. Always conduct your own research and consult with a professional before making any financial decisions. Please note that our Terms and Conditions, Privacy Policy, and Disclaimers have been updated.


Cardano (ADA) has faced a sharp price decline amid heightened volatility and widespread liquidations across the broader crypto market. Over the past 24 hours, ADA has shed more than 10% of its value, marking one of its steepest single-day losses in recent months.
ADA is now trading at $0.52, levels last seen in November 2024. This reinforces the growing bearish sentiment against the altcoin.
Death Cross and Heavy Outflows Weigh on ADA
ADA’s downturn in the past day has pushed its price into precarious territory, with a death cross now appearing on its daily chart. This marks the first time the pattern will appear on ADA charts since May 2024.
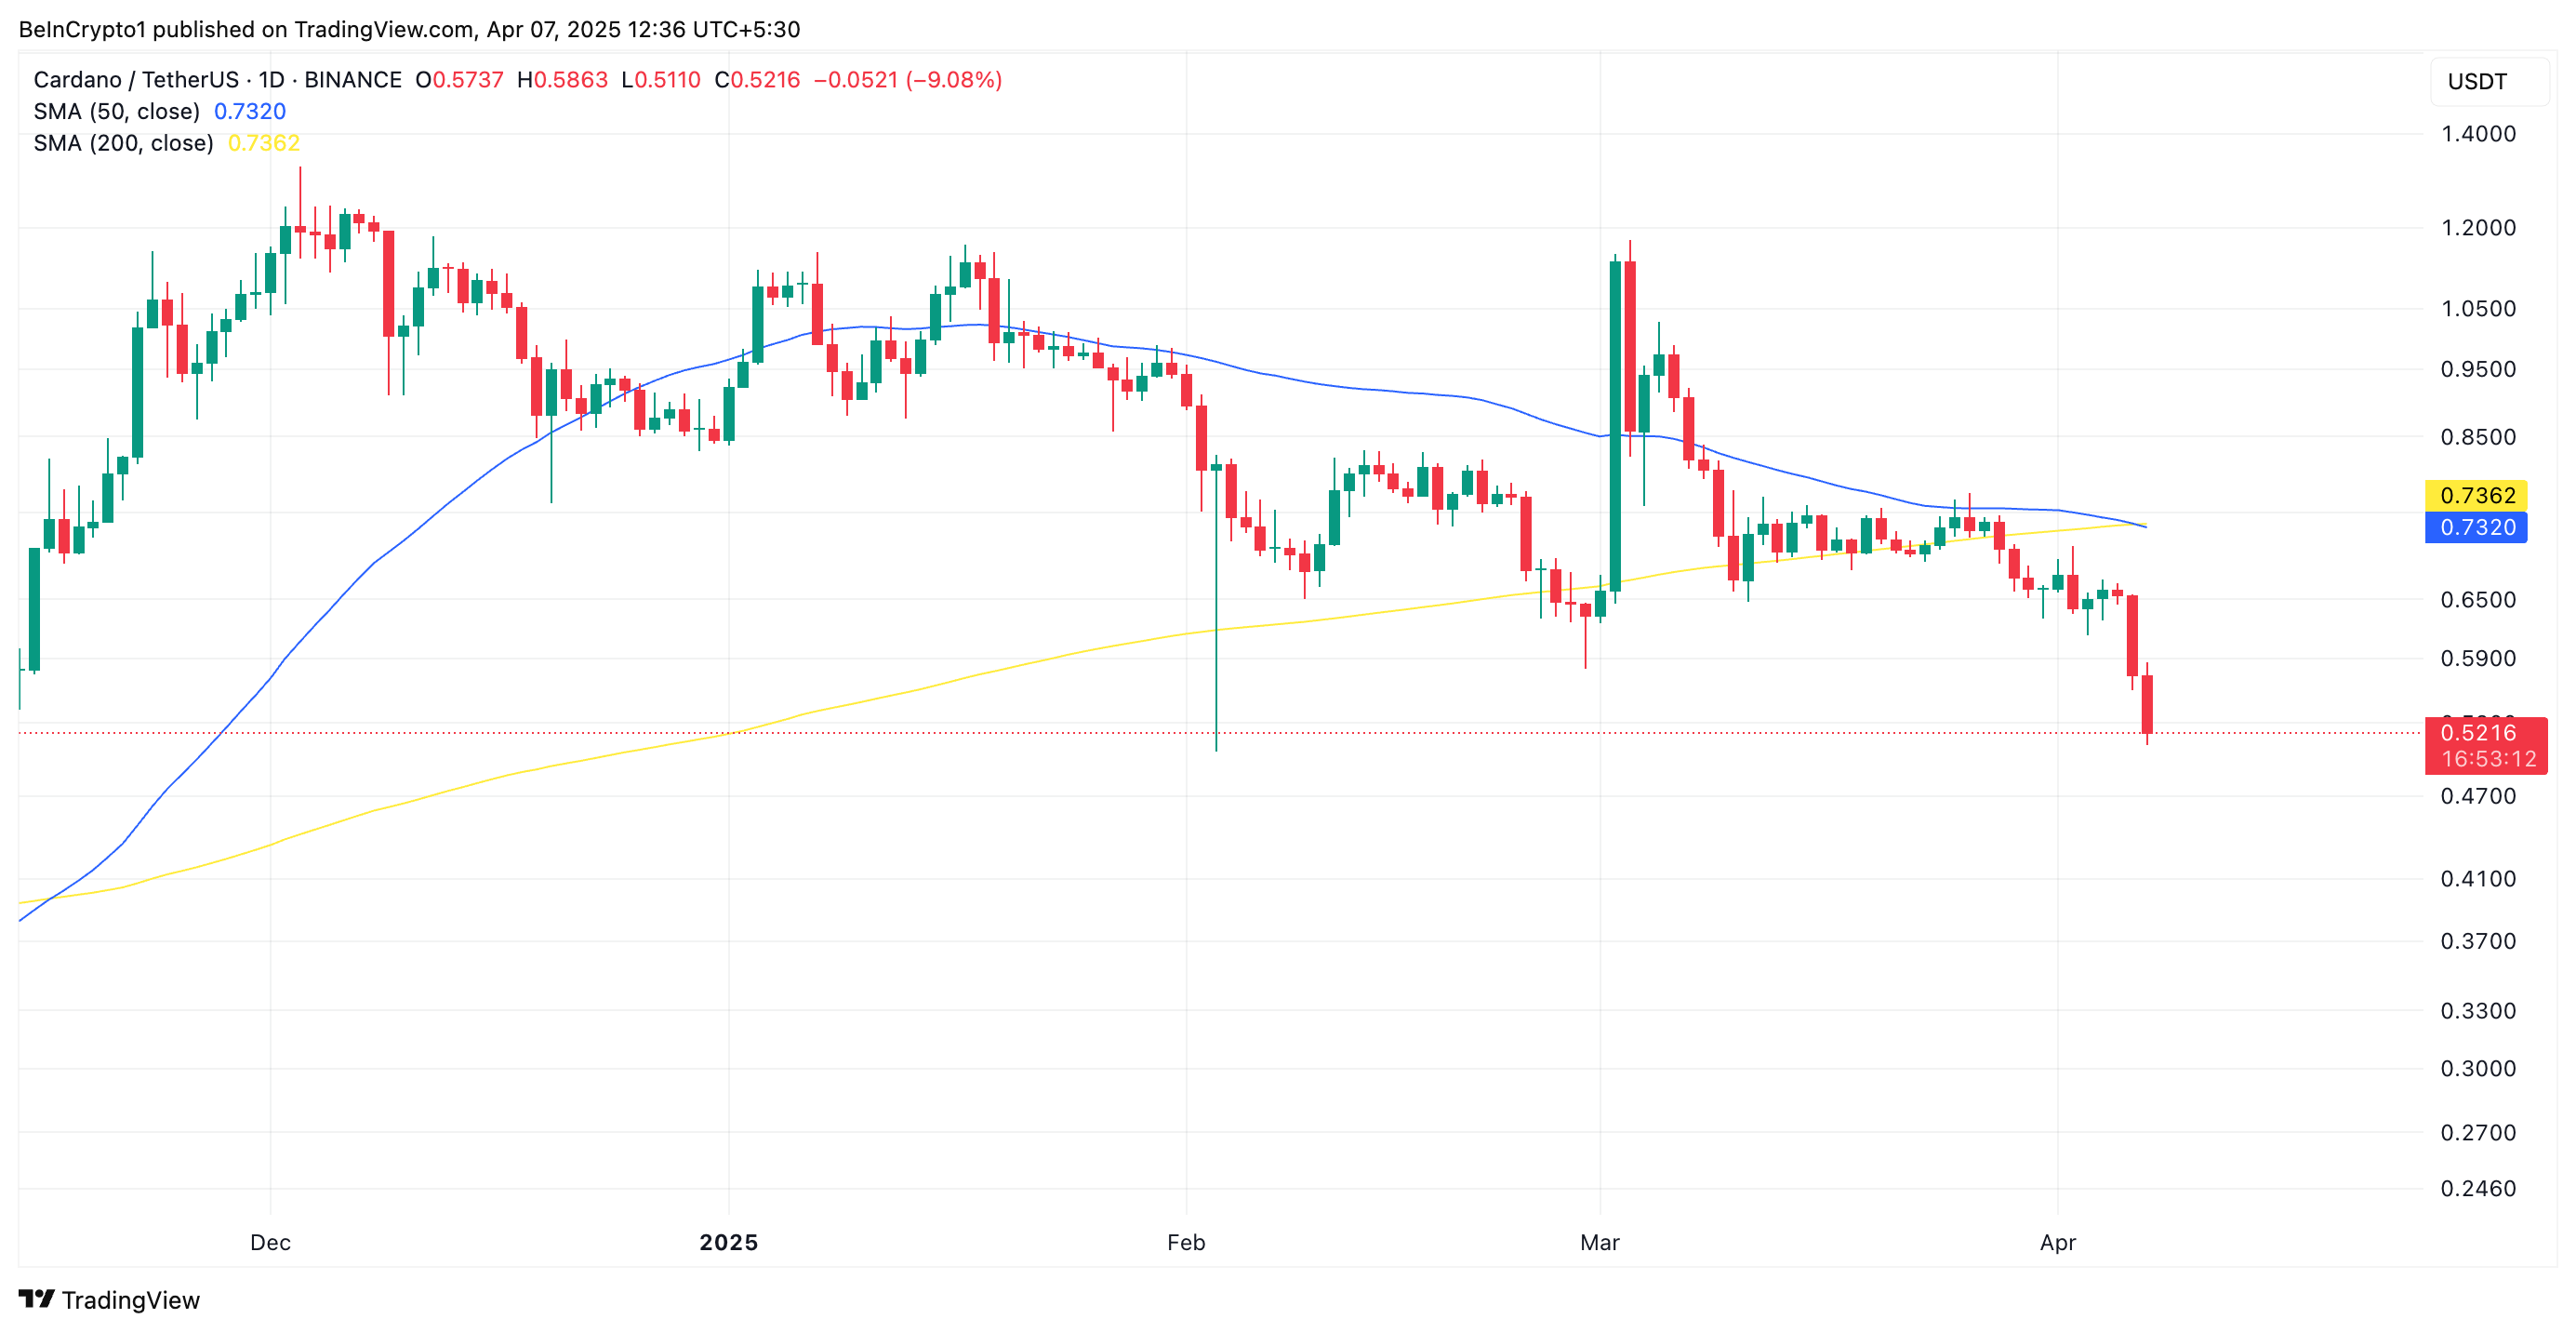
The death cross pattern—where the 50-day moving average falls below the 200-day moving average—is viewed as a long-term bearish signal, often preceding extended periods of price weakness.
When a death cross is formed, it indicates a definitive shift in market sentiment from bullish to bearish, leading to increased selling pressure and a possible further decline in price. This suggests ADA could face continued downward pressure in the near term if the bulls remain in the shadows.
Moreover, the steady outflows from the ADA spot markets add to the downward pressure on its price. According to Coinglass, ADA spot outflows have totaled $12 million so far today.
Over the past month, capital exit from the ADA spot markets has exceeded $150 million.
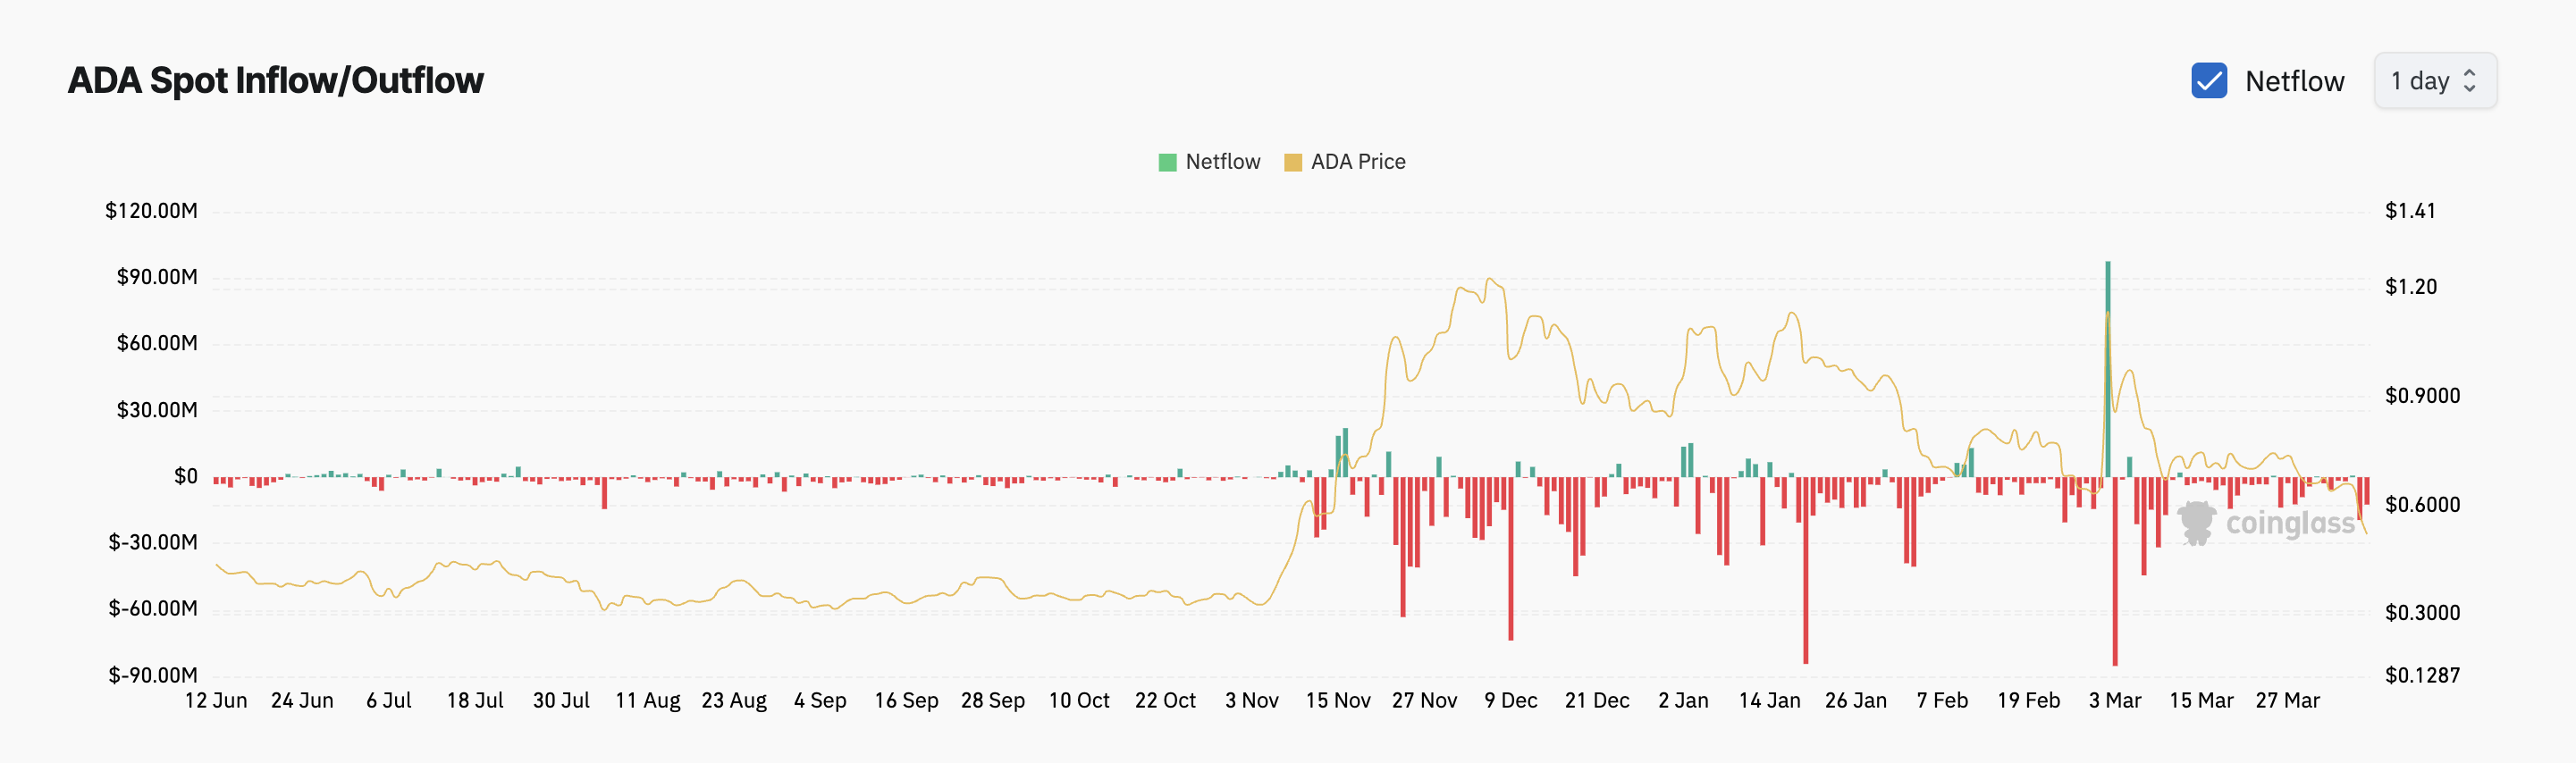
Spot outflows like this indicate bearish sentiment, as they suggest that investors are pulling their capital in anticipation of further price drops or moving funds into other assets.
This persistent trend signals a loss of confidence among ADA traders as they continuously liquidate their positions. This has worsened the market’s selling pressure and contributed significantly to ADA’s price troubles.
Cardano’s Downward Trend Deepens: Death Cross Threatens More Drop
While broader market instability has impacted many altcoins, ADA’s price drop is notable due to the formation of the Death Cross. The emergence of this technical indicator, combined with a multi-month price low as buying activity falls, suggests ADA could face continued downward pressure in the near term.
In this scenario, its value could dip to $0.44, marking a 14% decline from its current value.
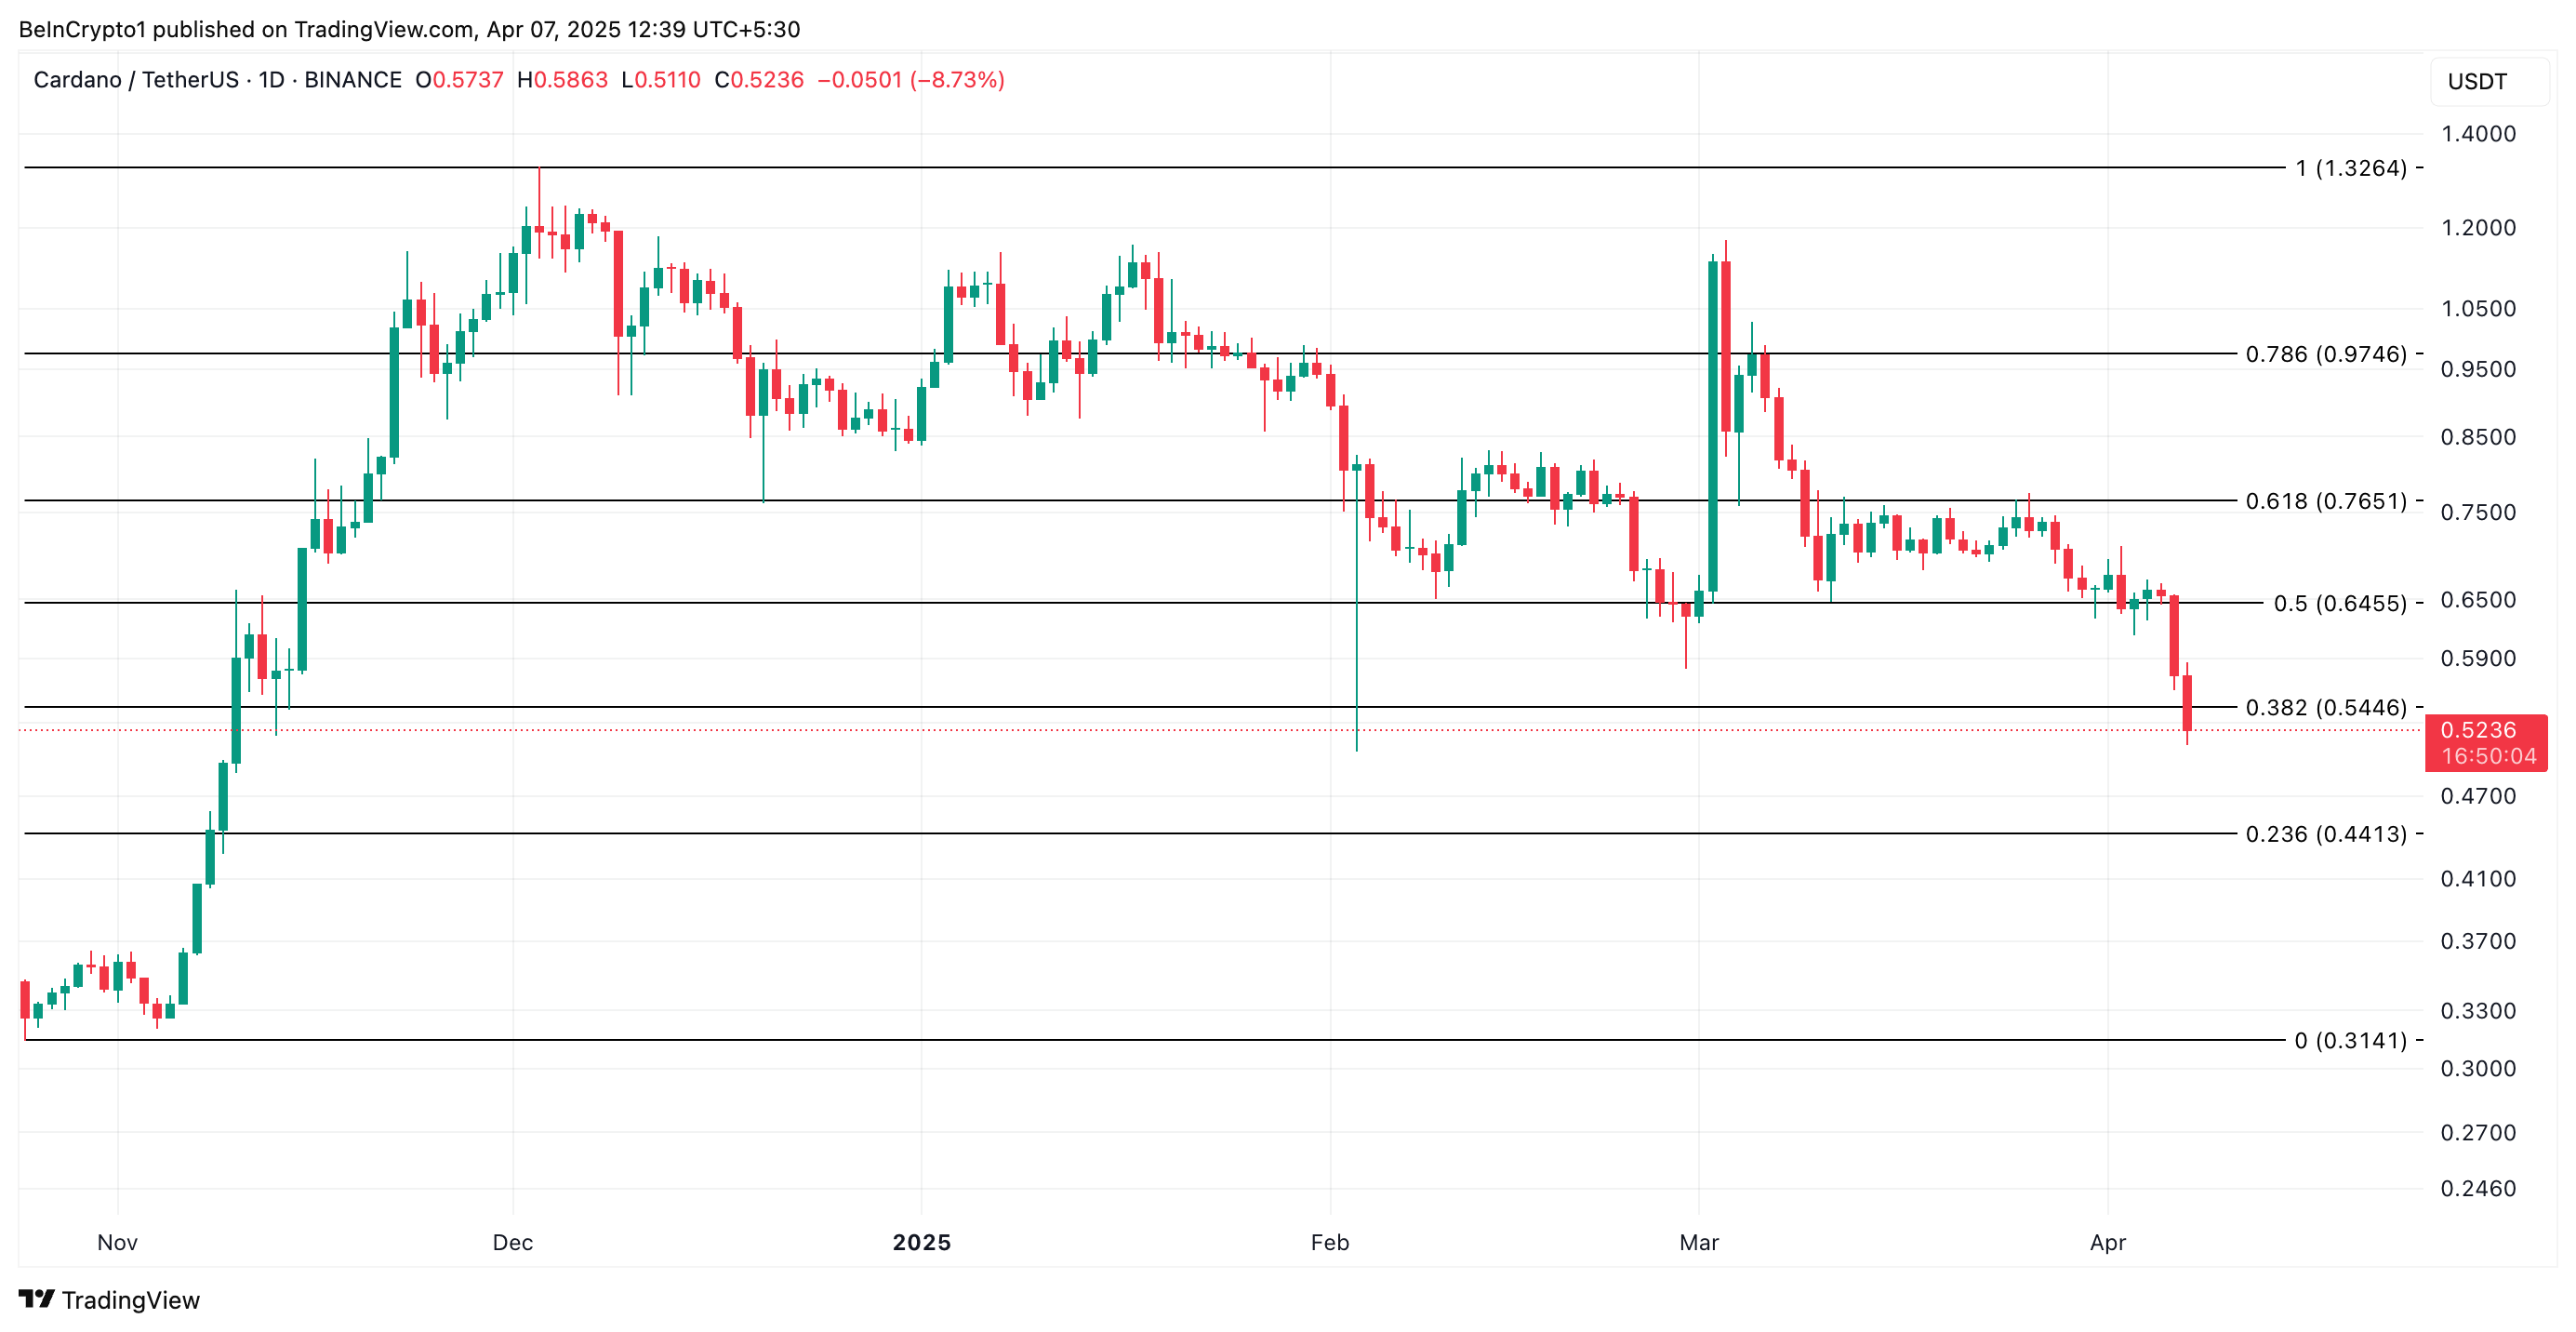
On the other hand, a resurgence in new demand for the altcoin will invalidate this bearish outlook. In that scenario, ADA’s price could regain its losses and attempt to break above resistance at $0.54.
If successful, it could extend its gains to $0.64.
Disclaimer
In line with the Trust Project guidelines, this price analysis article is for informational purposes only and should not be considered financial or investment advice. BeInCrypto is committed to accurate, unbiased reporting, but market conditions are subject to change without notice. Always conduct your own research and consult with a professional before making any financial decisions. Please note that our Terms and Conditions, Privacy Policy, and Disclaimers have been updated.

Reason to trust
![]()
Strict editorial policy that focuses on accuracy, relevance, and impartiality
Created by industry experts and meticulously reviewed
The highest standards in reporting and publishing
Strict editorial policy that focuses on accuracy, relevance, and impartiality
Morbi pretium leo et nisl aliquam mollis. Quisque arcu lorem, ultricies quis pellentesque nec, ullamcorper eu odio.
Ethereum price failed to recover above $1,820 and dropped below $1,650. ETH is now consolidating losses and might face resistance near the $1,675 zone.
- Ethereum failed to stay above the $1,650 and $1,620 levels.
- The price is trading below $1,650 and the 100-hourly Simple Moving Average.
- There was a break below a connecting bullish trend line with support at $1,775 on the hourly chart of ETH/USD (data feed via Kraken).
- The pair remains at risk of more losses below the $1,550 support zone.
Ethereum Price Dips Further
Ethereum price failed to stay above the $1,800 support zone and extended losses, like Bitcoin. ETH declined heavily below the $1,750 and $1,700 levels.
There was a break below a connecting bullish trend line with support at $1,775 on the hourly chart of ETH/USD. The bears even pushed the price below the $1,600 level. A low was formed at $1,537 and the price recently corrected some losses.
There was a move above the $1,580 level. The price tested the 23.6% Fib retracement level of the downward move from the $1,815 swing high to the $1,537 low. However, the bears are active near the $1,600 zone. The price is now consolidating and facing many hurdles.
Ethereum price is now trading below $1,650 and the 100-hourly Simple Moving Average. On the upside, the price seems to be facing hurdles near the $1,600 level.
The next key resistance is near the $1,675 level or the 50% Fib retracement level of the downward move from the $1,815 swing high to the $1,537 low. The first major resistance is near the $1,710 level. A clear move above the $1,710 resistance might send the price toward the $1,820 resistance.

An upside break above the $1,820 resistance might call for more gains in the coming sessions. In the stated case, Ether could rise toward the $1,880 resistance zone or even $1,920 in the near term.
Another Decline In ETH?
If Ethereum fails to clear the $1,600 resistance, it could start another decline. Initial support on the downside is near the $1,550 level. The first major support sits near the $1,535 zone.
A clear move below the $1,535 support might push the price toward the $1,420 support. Any more losses might send the price toward the $1,400 support level in the near term. The next key support sits at $1,350.
Technical Indicators
Hourly MACD – The MACD for ETH/USD is gaining momentum in the bearish zone.
Hourly RSI – The RSI for ETH/USD is now below the 50 zone.
Major Support Level – $1,550
Major Resistance Level – $1,600

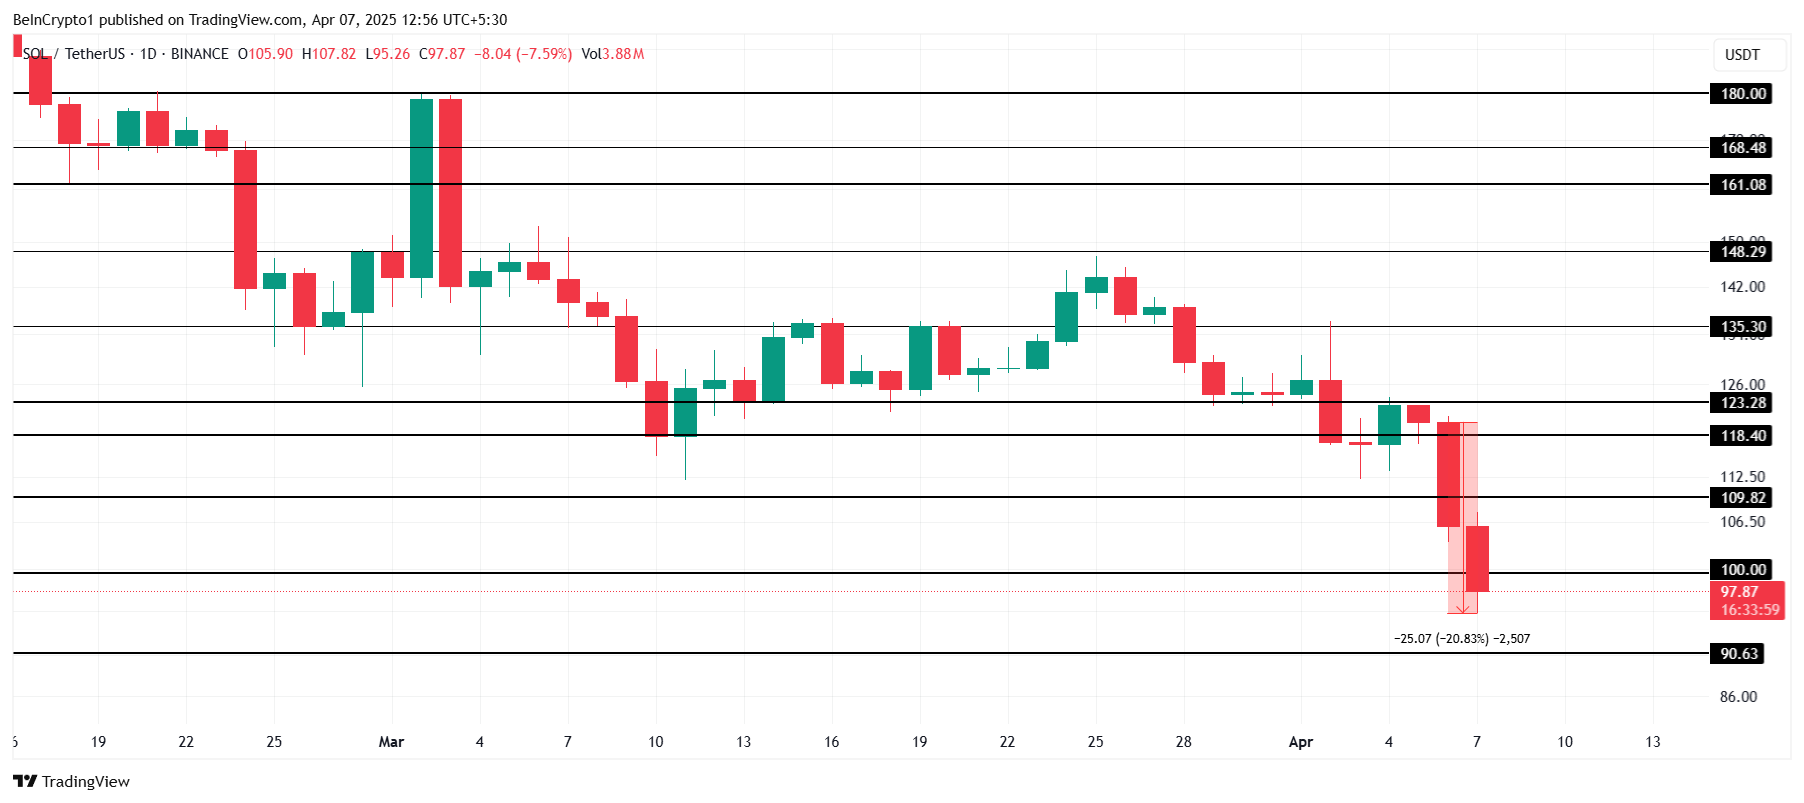
Solana (SOL) has faced significant price declines recently, falling below the $100 mark and reaching a 14-month low.
This drop is attributed to broader market bearishness, largely driven by ongoing trade tensions and fears of a financial crisis, often likened to the 1987 “Black Monday.” Despite these challenges, there is potential for SOL to stabilize and recover in the near future.
Solana Investors Stand Strong
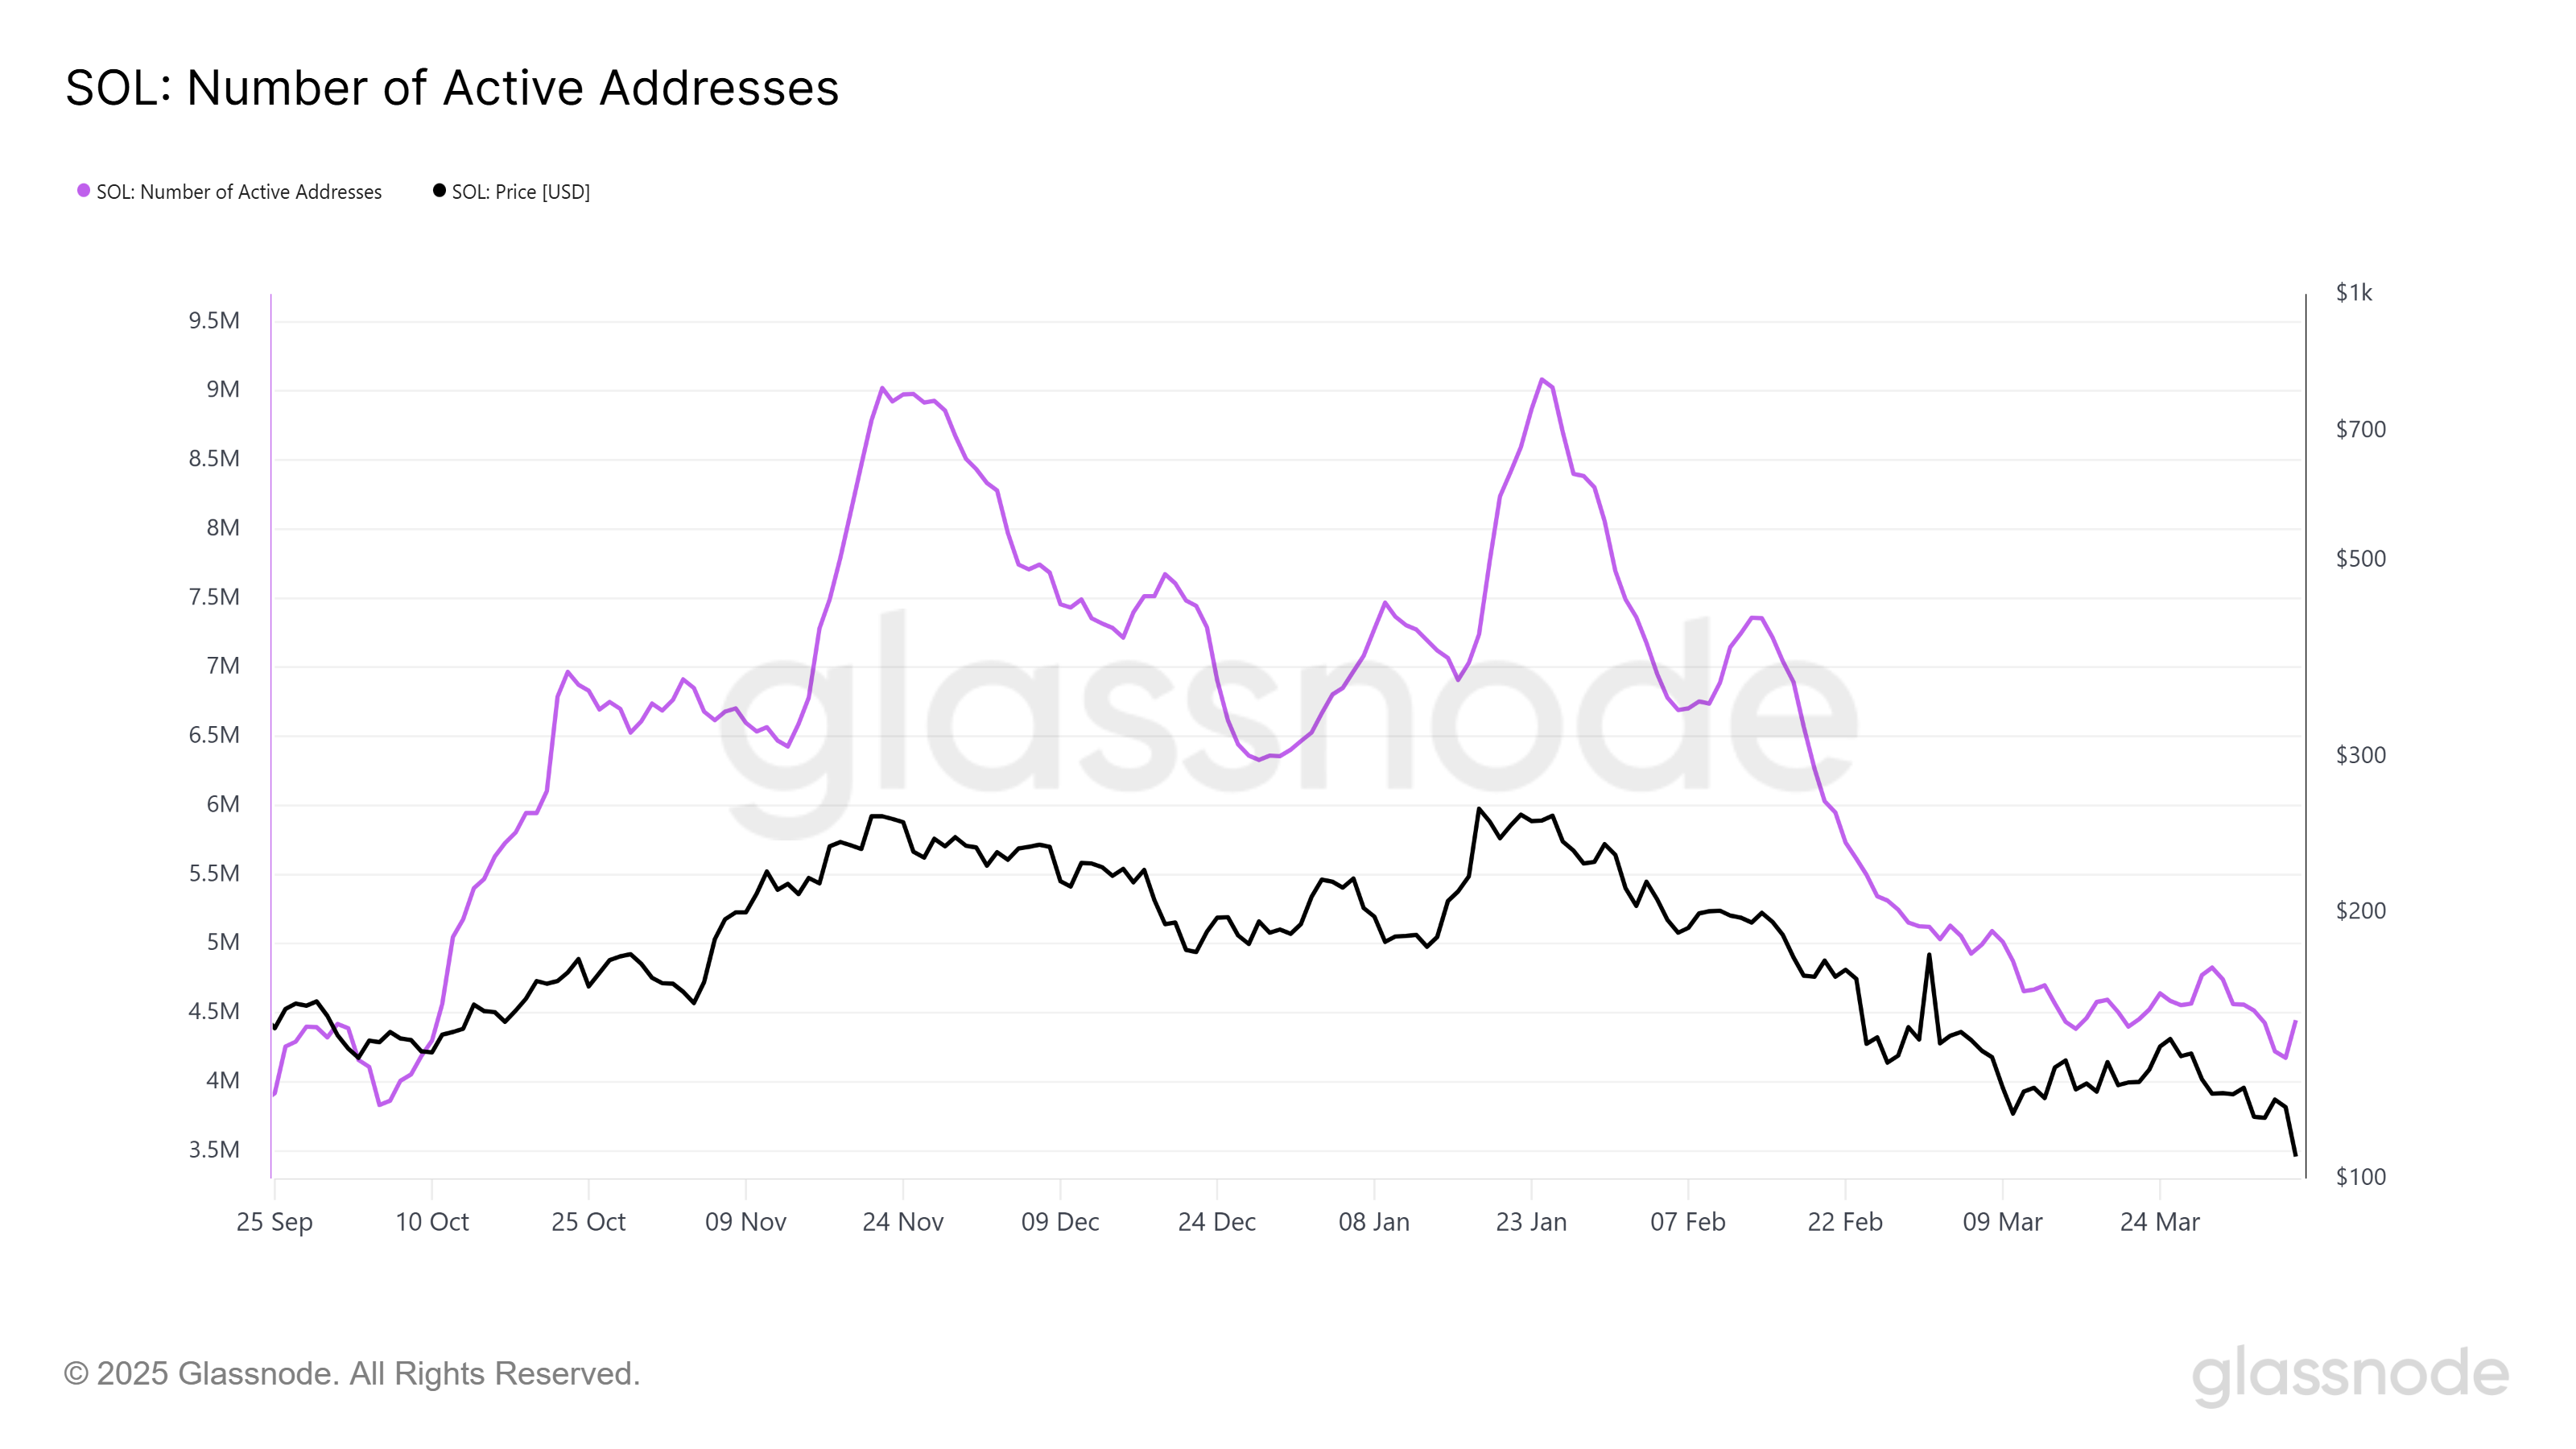
The number of active addresses on the Solana network has recently hit a 6-month low, with around 4.44 million addresses engaging on the platform. While the decline from January’s peak of 9 million addresses might seem concerning, it also indicates that investors are likely waiting for a strong recovery before being more active on the network.
Despite the price downturn, Solana’s loyal investor base continues to hold their positions, signaling potential support that could prevent further price declines. Solana’s investors remain hopeful for a rebound, particularly given the network’s history of bouncing back after downturns.
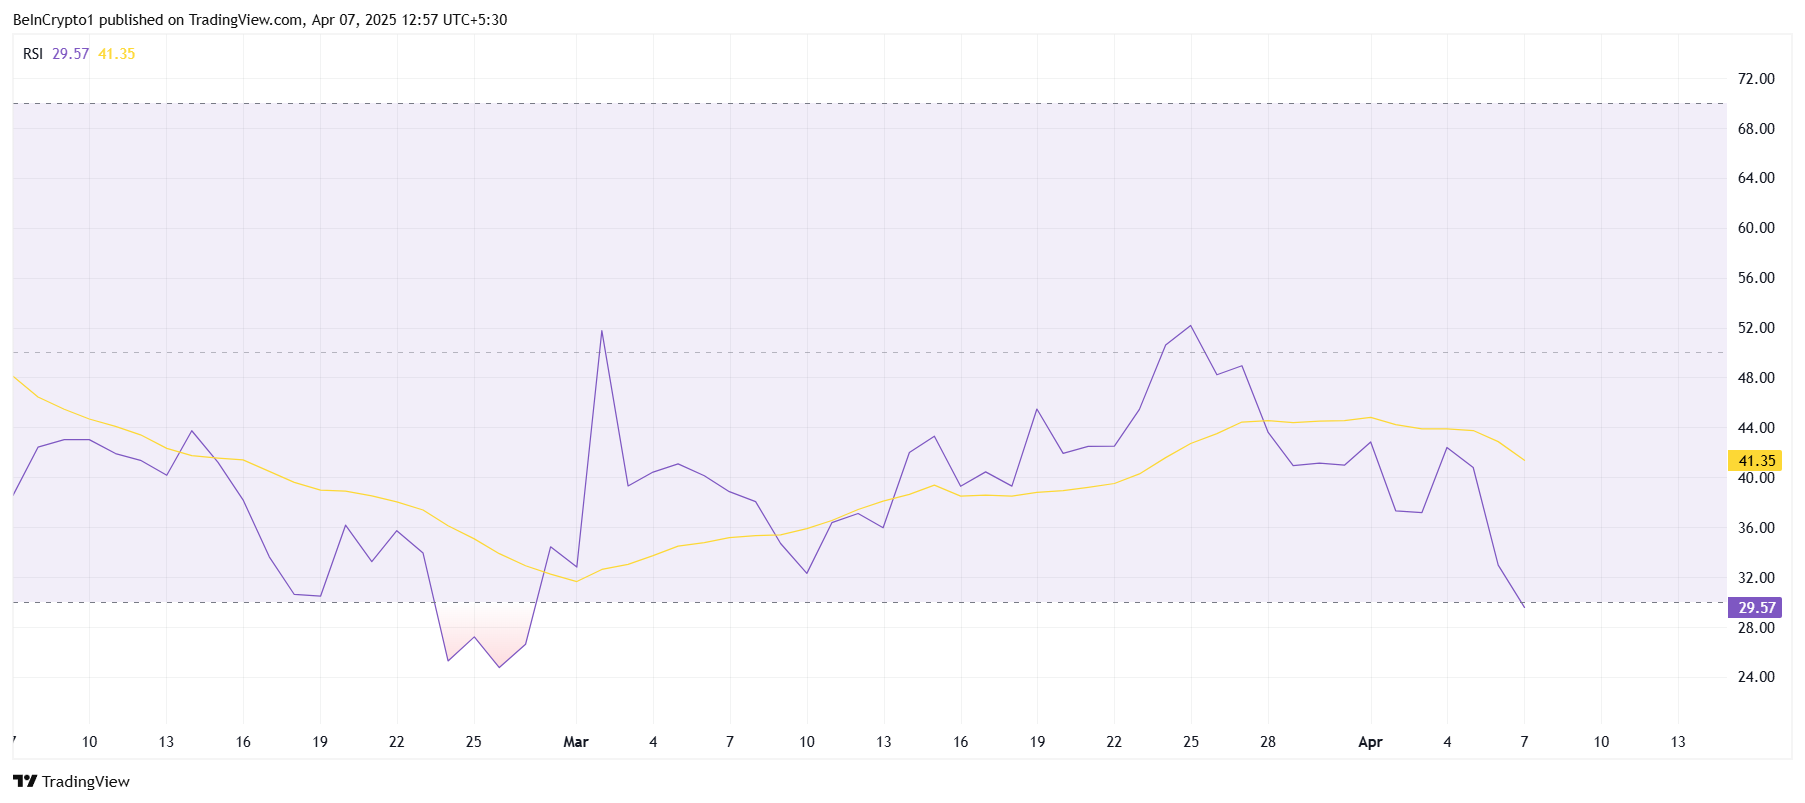
Looking at technical indicators, the Relative Strength Index (RSI) for Solana is currently sitting in the oversold zone, below the critical 30.0 mark. This suggests that the bearish momentum may be nearing its saturation point, with the potential for a reversal in the near future. Historically, when SOL has dipped into the oversold region, the price has rebounded.
The RSI reading suggests that the market may be poised for a short-term recovery if the broader market conditions stabilize. While the global financial climate remains uncertain, the RSI signals that Solana could be on the brink of a price rebound, provided the bearish forces start to subside.
SOL Price May Recover Soon
Solana’s price has dropped 20.8% during the intra-day trading session, reaching $97. The price fall below $100 marks a new low for the asset, driven by a surge in bearish sentiment across the market. As a result, many investors are watching closely to see if Solana can reclaim its previous support levels.
Despite the recent declines, Solana’s recovery potential remains strong. If the price manages to break above the $100 mark and hold it as support, the positive momentum could return. Investors are likely to capitalize on the current 14-month low, injecting new capital into the network and helping to stabilize the price.
However, if the broader market conditions fail to improve, Solana’s price may continue to struggle. A drop below the $90 support level would invalidate the bullish outlook and extend losses. As a result, SOL may face further downward pressure, especially if negative market trends persist.
Disclaimer
In line with the Trust Project guidelines, this price analysis article is for informational purposes only and should not be considered financial or investment advice. BeInCrypto is committed to accurate, unbiased reporting, but market conditions are subject to change without notice. Always conduct your own research and consult with a professional before making any financial decisions. Please note that our Terms and Conditions, Privacy Policy, and Disclaimers have been updated.

Will ADA Drop to $0.44?

Will 2025’s Crypto Market Mirror 2020’s Rebound? Analysts Predict

Ethereum Price Tanks Hard—Can It Survive the $1,500 Test?

Solana (SOL) Price Falls Below $100, Crashes To 14-Month Low
$1 Billion in Liquidations Over the Weekend

XRP Price Dives Below $2—Is This the Start of a Bigger Breakdown?

2.52 Million Altcoins Are Ruining Crypto’s Future

Animoca Brands Valuation Tanks 75% In Two Years, Here’s Why

Crypto exchange BingX hacked for $43 million

Are The Big Players Losing Interest?

Hong Kong’s Securities Association Tips Authorities On Crypto Self-Regulation

Coinbase cbBTC Set to go Live on Solana
2.52 Million Altcoins Are Ruining Crypto’s Future
Animoca Brands Valuation Tanks 75% In Two Years, Here’s Why
Crypto exchange BingX hacked for $43 million
Are The Big Players Losing Interest?
Hong Kong’s Securities Association Tips Authorities On Crypto Self-Regulation
Coinbase cbBTC Set to go Live on Solana
-

 Market23 hours ago
HBAR Could Avoid $30 Million Liquidation Thanks to Death Cross
-

 Bitcoin18 hours ago
US Macro Setup To Favour New Bitcoin ATH In The Long Run
-
 Market24 hours ago
SEC Reconsiders Howey Test Use in Crypto Oversight
-

 Bitcoin23 hours ago
Altseason Dead On Arrival? Data Shows Bitcoin Outperforming All Categories
-
 Altcoin16 hours ago
Expert Reveals Decentralized Strategy To Stabilize Pi Network Price
-

 Market22 hours ago
Conor McGregor’s Crypto Token REAL Tanks After Launch
-

 Market21 hours ago
Celestia (TIA) Price’s 30% Crash Prolonging Could Bring Recovery
-

 Market20 hours ago
Ripple Highlights UK’s Potential to Become Global Crypto Hub