Market
Bitcoin Hovers Over $80,000 as Whale Activity Drops
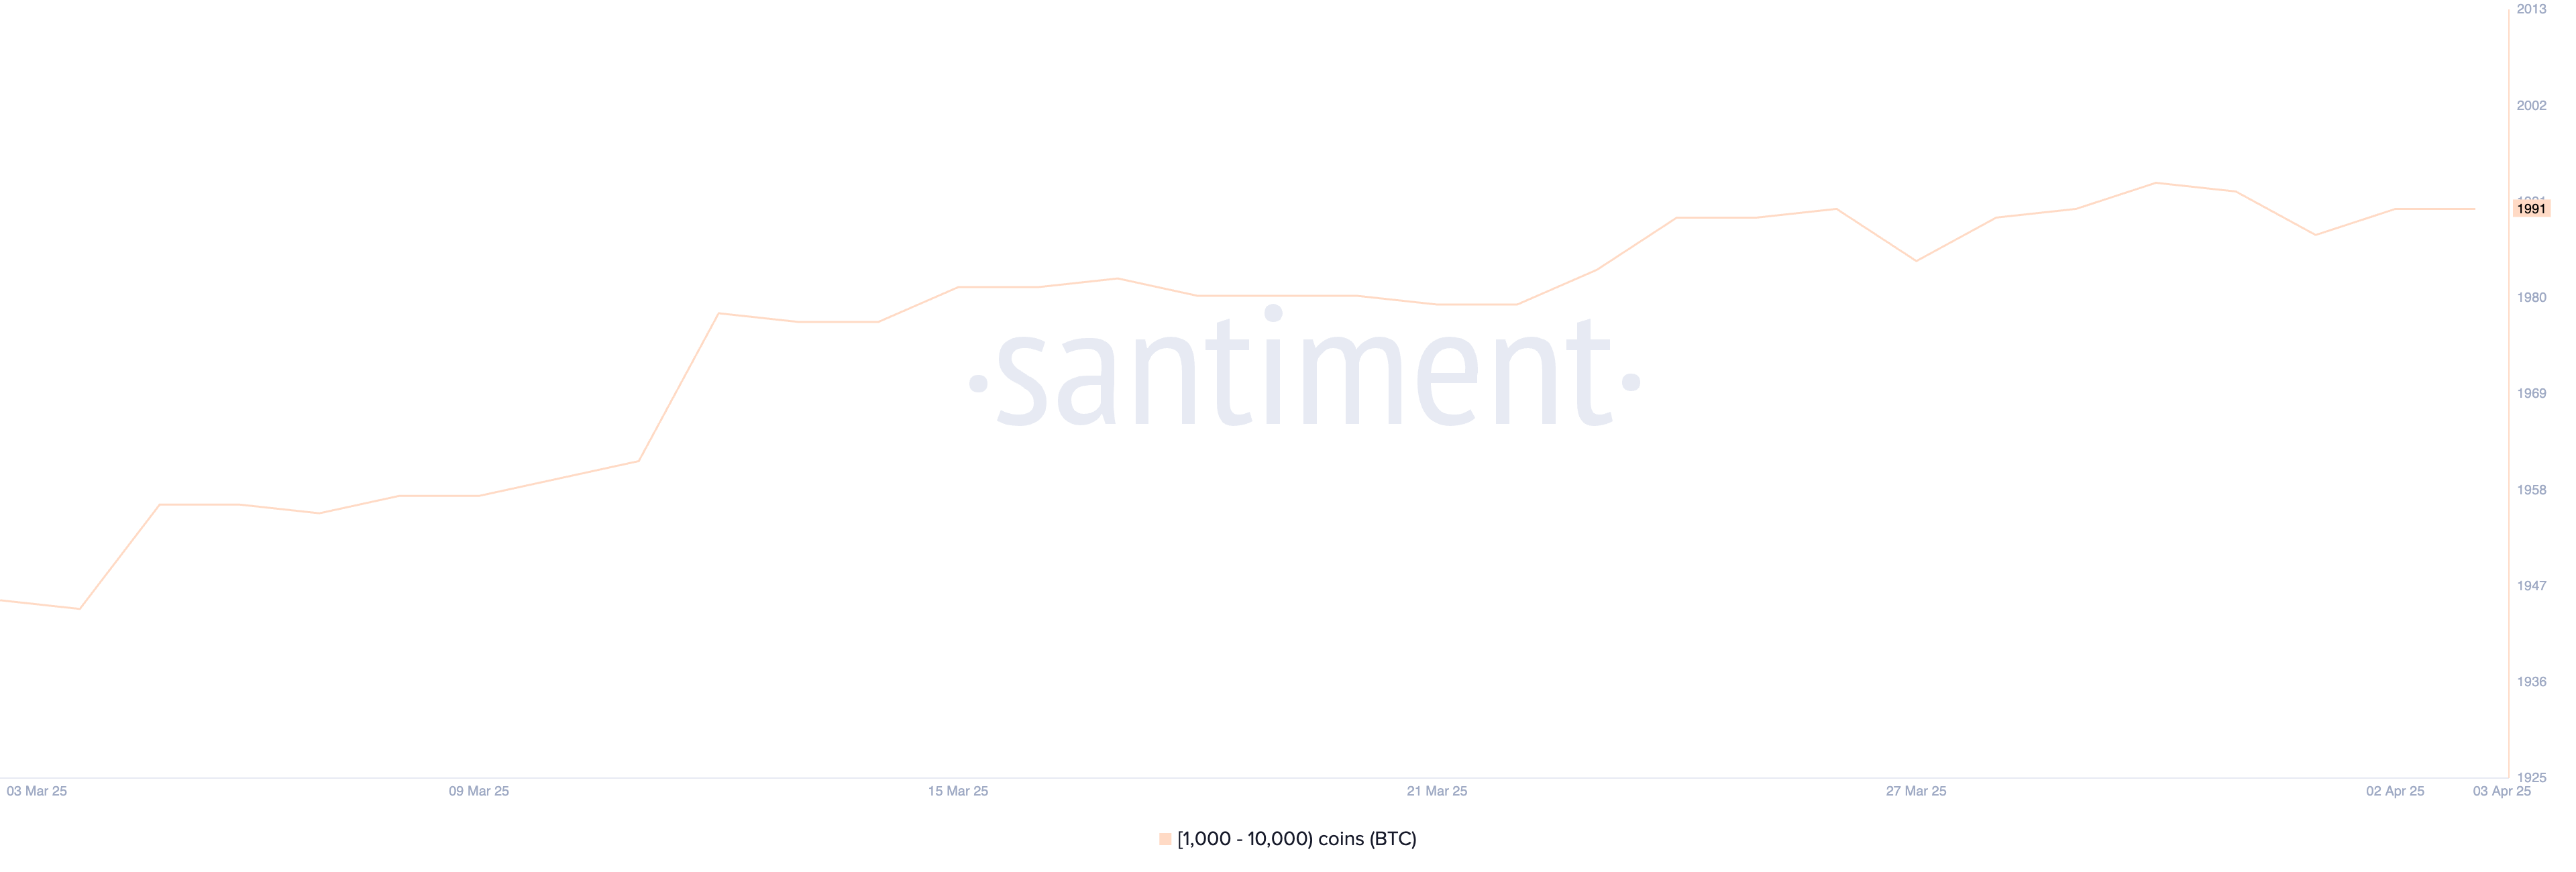
Bitcoin (BTC) continues to hover in a state of uncertainty as both whale activity and technical indicators point to a market lacking strong conviction. Large holders have remained inactive for over a week, with the number of whale wallets holding between 1,000 and 10,000 BTC steady at 1,991 since March 24.
Meanwhile, technical charts like the Ichimoku Cloud and EMA lines offer a mixed outlook, reflecting hesitation in both bullish and bearish directions. As BTC trades near key support and resistance levels, the coming days could determine whether April brings a breakout or deeper correction.
Bitcoin Whales Aren’t Accumulating
The number of Bitcoin whales—wallets holding between 1,000 and 10,000 BTC—currently stands at 1,991, a figure that has remained remarkably steady since March 24.
This level of consistency in large holder activity suggests that major players are neither aggressively accumulating nor offloading their positions.
Given the size of these holdings, even minor shifts in whale behavior can significantly impact the market. This stability is particularly noteworthy given recent volatility across the broader crypto market.
Tracking Bitcoin whales is crucial because these large holders often have the power to influence price action through their buying or selling decisions.
When whales accumulate BTC, it can signal confidence in future price appreciation, while large-scale selling can indicate upcoming downward pressure. The fact that the number of whales has remained stable for the last 11 days may suggest a period of consolidation, where big investors are waiting for a clearer macro or market signal before making their next move.
This could imply that major players see the current BTC price as fair value, potentially leading to a tightening of price action in the short term before a breakout in either direction.
BTC Ichimoku Cloud Shows A Mixed Picture
The current Ichimoku Cloud setup for Bitcoin shows a mixed but slightly cautious sentiment.
The price recently dipped below the red baseline (Kijun-sen), and despite a brief push into the cloud, it was rejected and fell back below it—indicating that bullish momentum lacked follow-through.
The blue conversion line (Tenkan-sen) is now trending downward and has crossed below the baseline, which often reflects short-term bearish momentum. Meanwhile, the Leading Span A (green cloud boundary) is starting to flatten, while Leading Span B (red boundary) remains relatively horizontal, forming a thin and neutral cloud ahead.
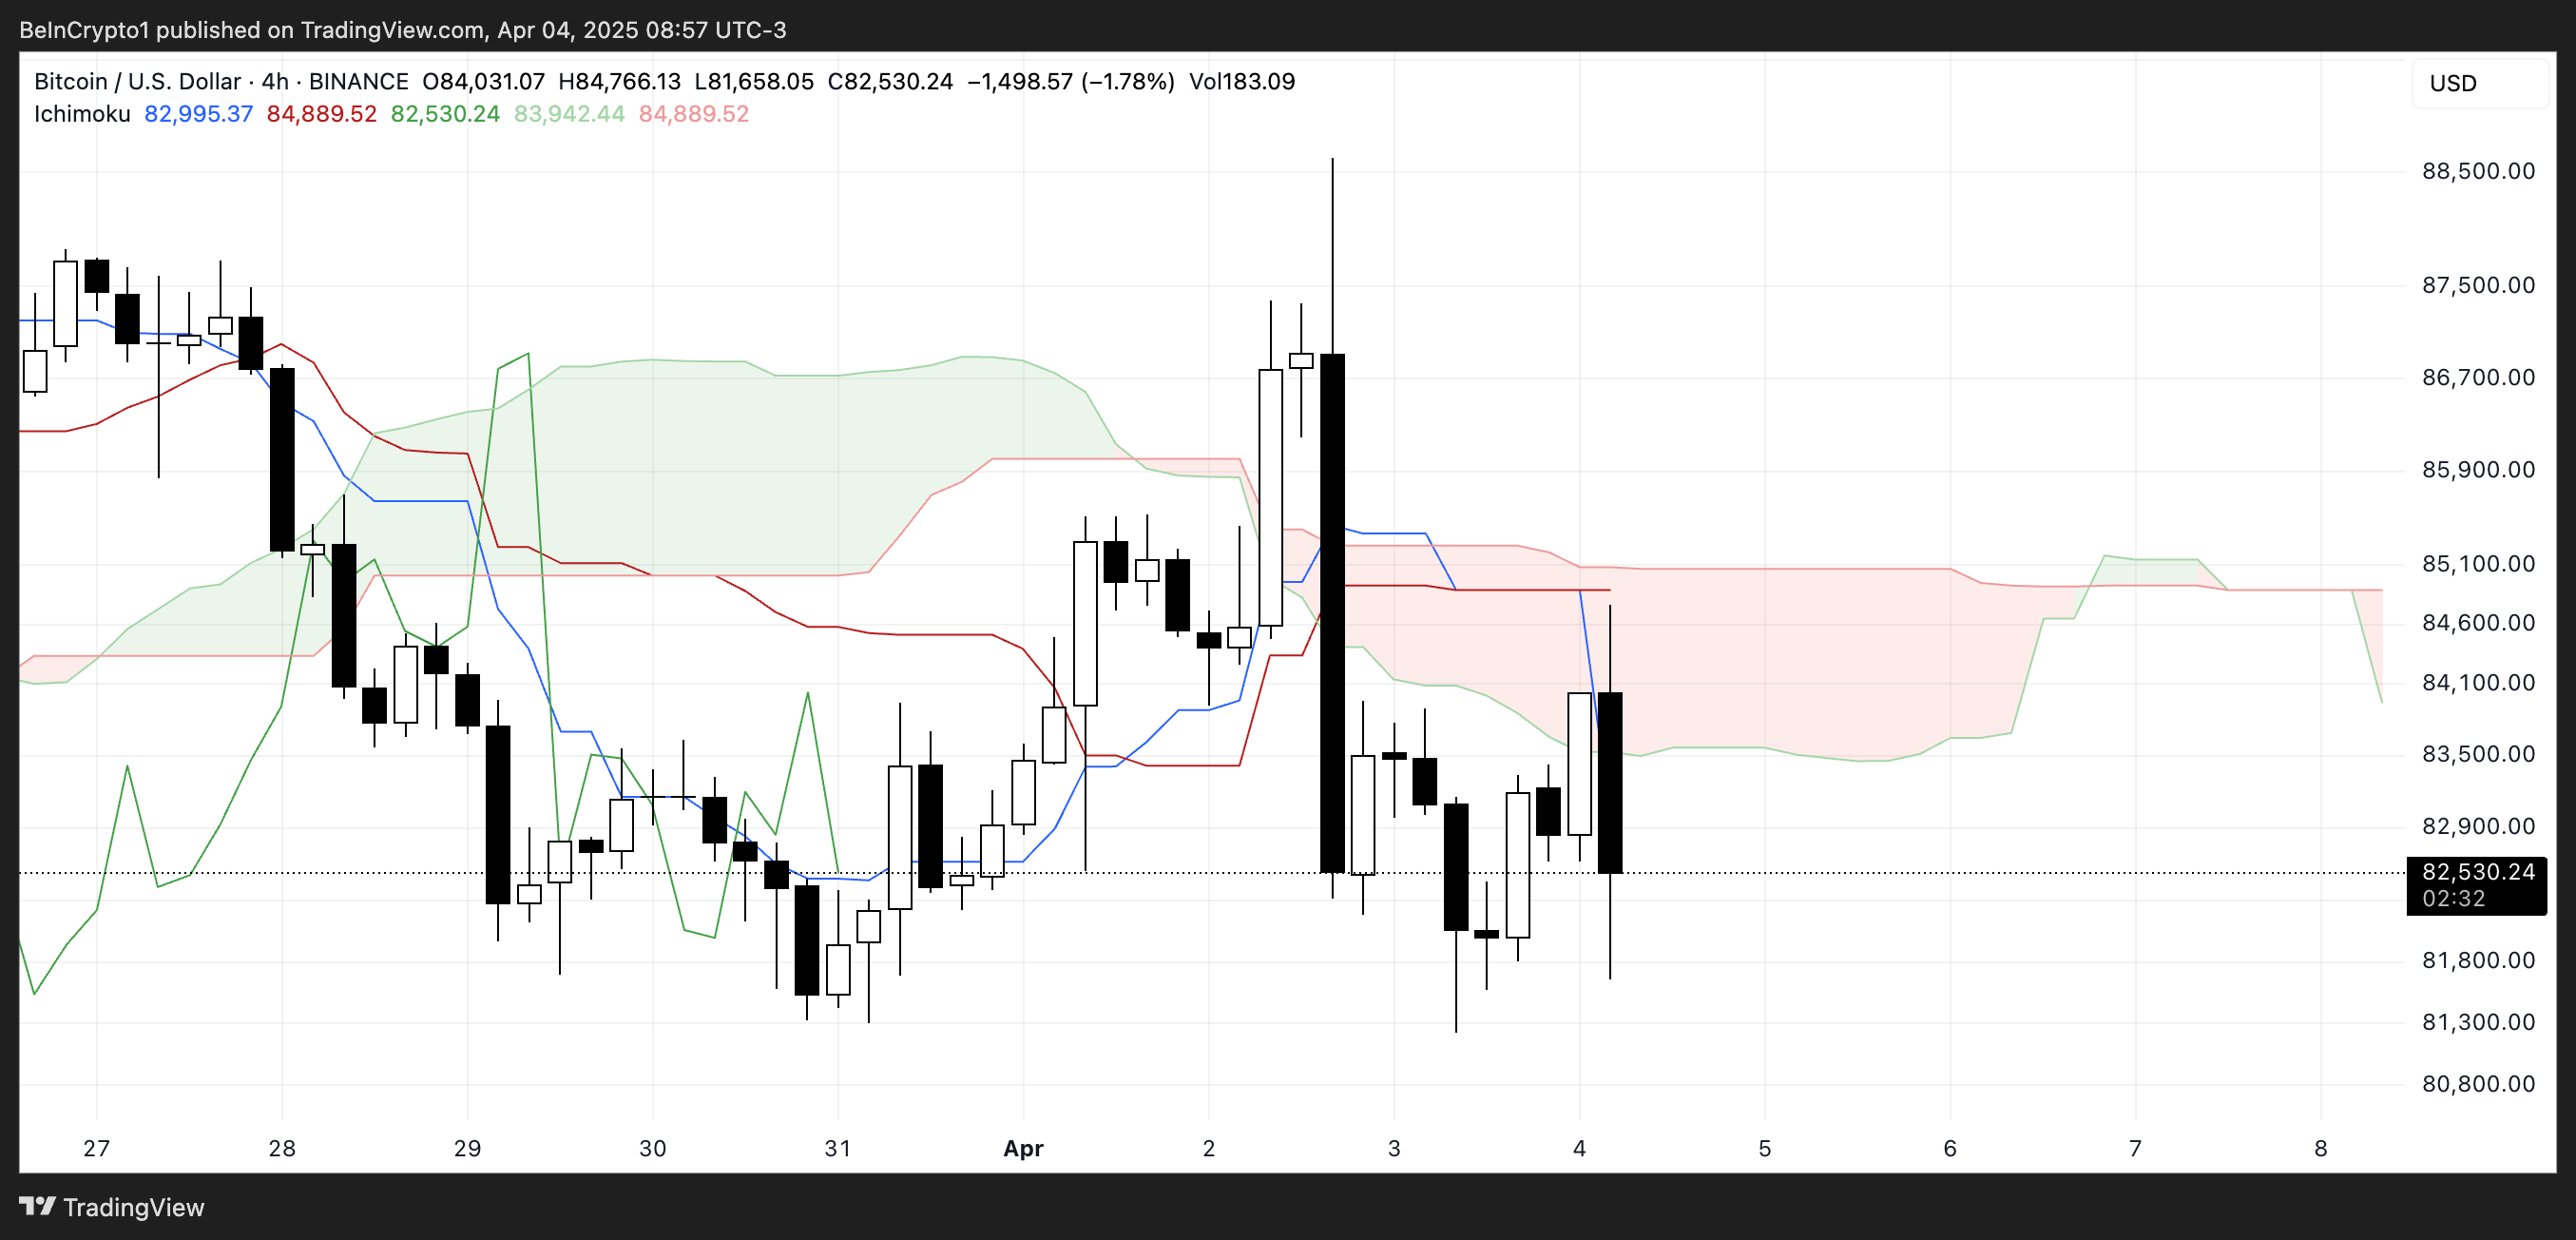
This type of thin, flat cloud suggests indecision in the market and a lack of strong trending momentum. The price hovering just below the cloud further reinforces the idea that BTC is in a consolidation phase rather than a clear trend.
If the price can break back above the cloud and maintain that level, it could signal renewed bullish strength.
However, continued rejection at the cloud and pressure from the falling Tenkan-sen could keep BTC in a corrective or sideways structure. For now, the Ichimoku setup reflects uncertainty, with no dominant trend confirmed in either direction.
Will Bitcoin Rise Back To $88,000 In April?
Bitcoin’s EMA structure still leans bearish overall, with longer-term EMAs positioned above the shorter-term ones. However, the recent upward movement in the short-term EMAs suggests that a rebound could be forming.
If this short-term strength develops into a sustained move, Bitcoin could first test the resistance at $85,103. A successful break above this level may signal a shift in momentum, opening the door to higher targets at $87,489. Recently, Standard Chartered predicted that BTC is likely to break $88,500 this weekend.
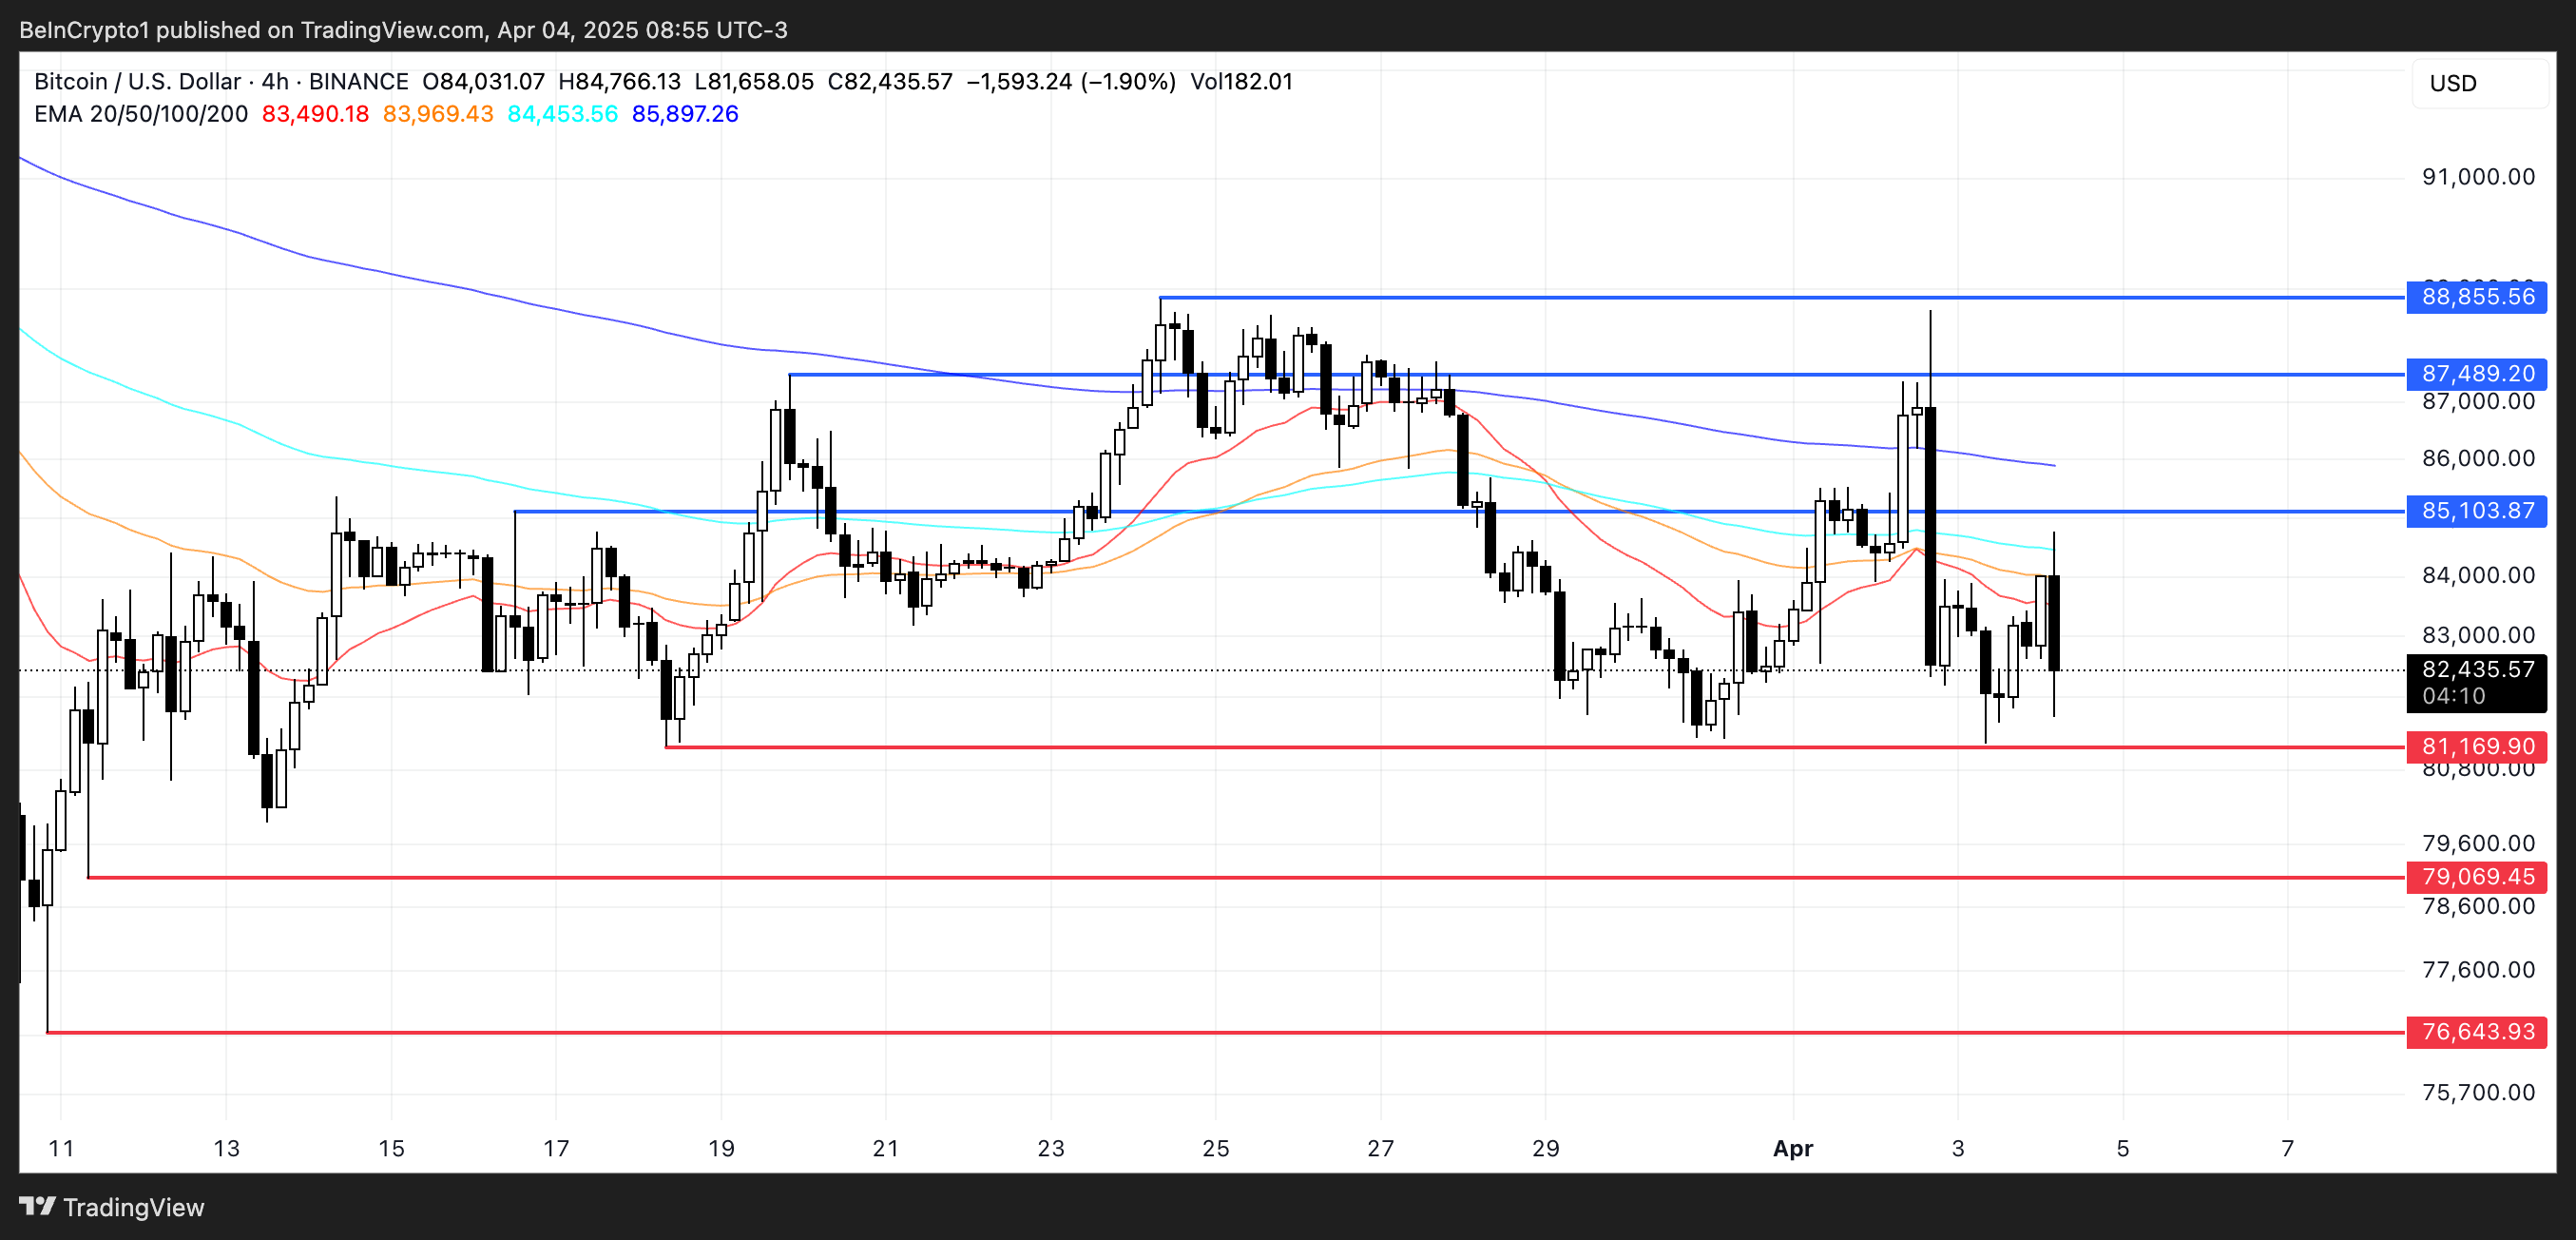
If bullish pressure remains strong beyond that point, Bitcoin price could push even further to challenge $88,855, a level that would mark a more convincing recovery from the recent pullback.
“(…) After Wednesday’s volatility, BTC has rebounded more than 4% and remains firmly above $79,000, with a key support level forming at $80,000 and slightly higher daily exchange volumes, which is a positive sign. On top of this, Bitcoin ETF flows suggest sentiment remains strong, with $220 million inflows on “Tariff Day”, April 2.,” Nic Puckrin, crypto analyst, investor, and founder of The Coin Bureau, told BeInCrypto.
However, if Bitcoin fails to build enough momentum for this rebound, downside risks remain. The first key level to watch is the support at $81,169.
As the trade war between China and the US escalates, a drop below this level could see BTC falling under the psychological $80,000 mark, with the next target around $79,069. If this zone is also lost, the bearish trend could intensify, sending BTC further down toward $76,643.
Disclaimer
In line with the Trust Project guidelines, this price analysis article is for informational purposes only and should not be considered financial or investment advice. BeInCrypto is committed to accurate, unbiased reporting, but market conditions are subject to change without notice. Always conduct your own research and consult with a professional before making any financial decisions. Please note that our Terms and Conditions, Privacy Policy, and Disclaimers have been updated.
Market
Celestia (TIA) Price’s 30% Crash Prolonging Could Bring Recovery

Celestia (TIA) has recently experienced a significant drawdown, losing nearly 30% of its value in the past two weeks. This decline has been attributed to the broader bearish market conditions, which caused panic among investors.
As a result, many TIA holders decided to pull their funds, adding to the downward pressure on the price.
Celestia Holders Opt To Back Out
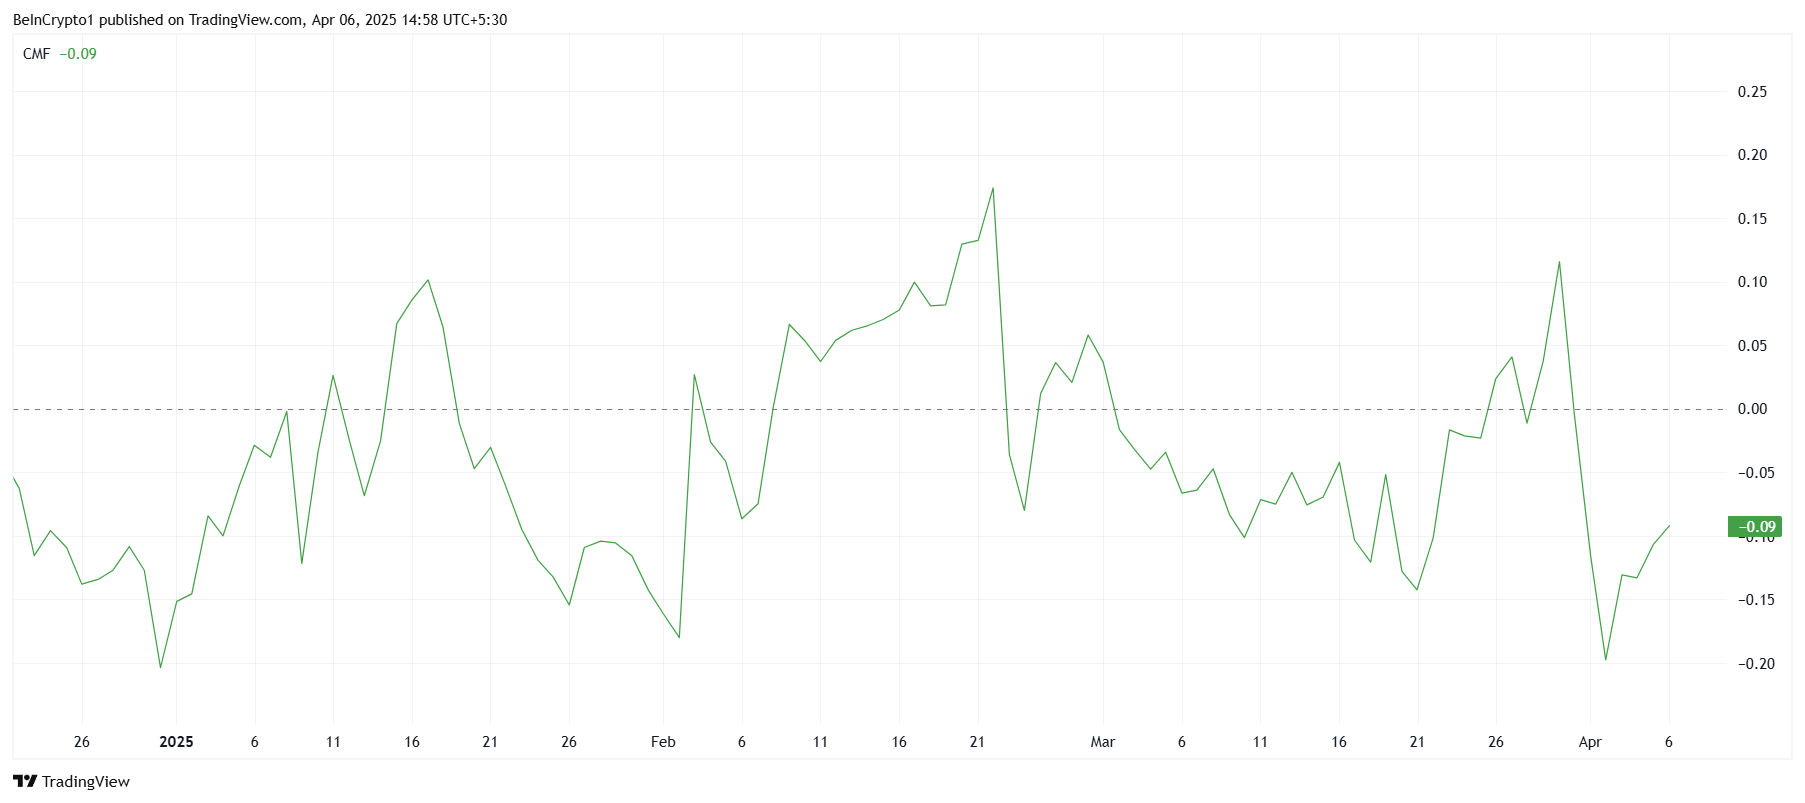
The Chaikin Money Flow (CMF) indicator has shown significant outflows from Celestia, marking the largest selling activity since the beginning of 2025. This reflects the growing fear among investors after the 30% price correction.
However, despite the negative sentiment, there has been an uptick in the CMF recently, indicating that some new investors are beginning to see value in the low prices. These inflows could potentially help stabilize the price and set the stage for a recovery.
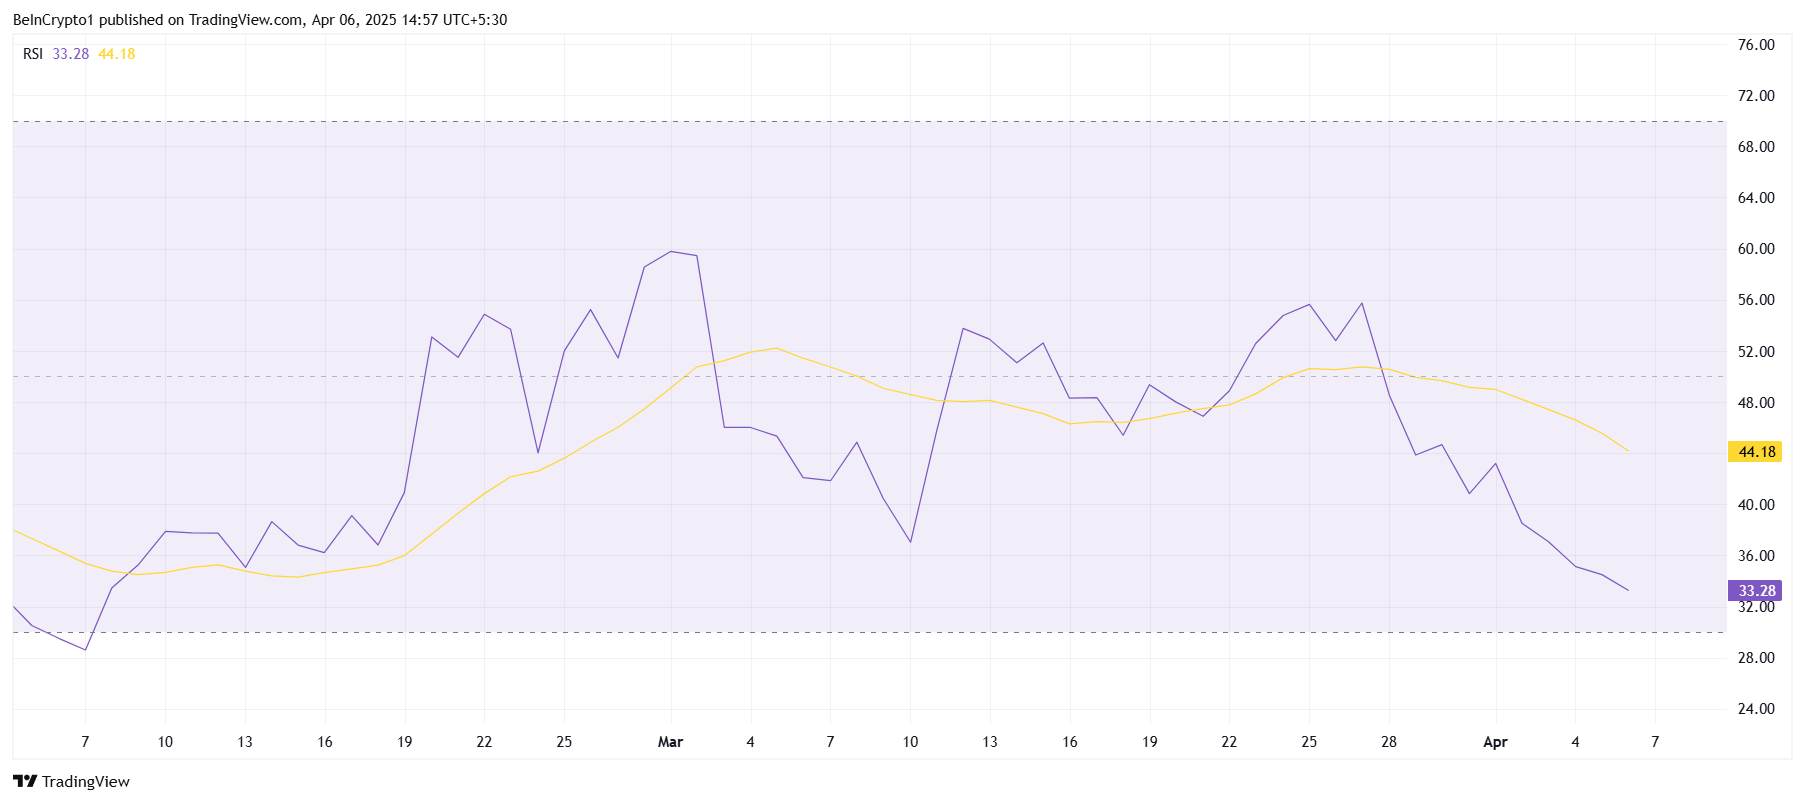
The Relative Strength Index (RSI) for Celestia shows that cryptocurrency is currently on a bearish trend. Stuck below the neutral line at 50.0, the RSI is moving closer to the oversold threshold of 30.0. Historically, when an asset reaches this level, it is considered a signal for a potential reversal, as selling typically slows, and accumulation begins.
If the RSI falls below 30, it could trigger buying interest, as many traders may view the low prices as an opportunity to enter the market.
The current state of the RSI suggests that while bearish momentum is still strong, the conditions are ripe for a reversal. If the selling pressure wanes and buyers begin to step in, Celestia’s price could find support and begin an upward move.
TIA Price Could Be Looking At Recovery
Celestia is currently priced at $2.62, reflecting a nearly 30% decline over the past two weeks. It is holding just above the critical support level of $2.53. If the market sentiment improves and the RSI hits the oversold zone, there is potential for a recovery.
The influx of new investors could provide the momentum needed to drive the price higher.
A successful bounce from the $2.53 support level could see Celestia pushing through $2.73 and heading towards $2.99. This would signal the beginning of a recovery rally and possibly set the stage for further price appreciation as market conditions improve.
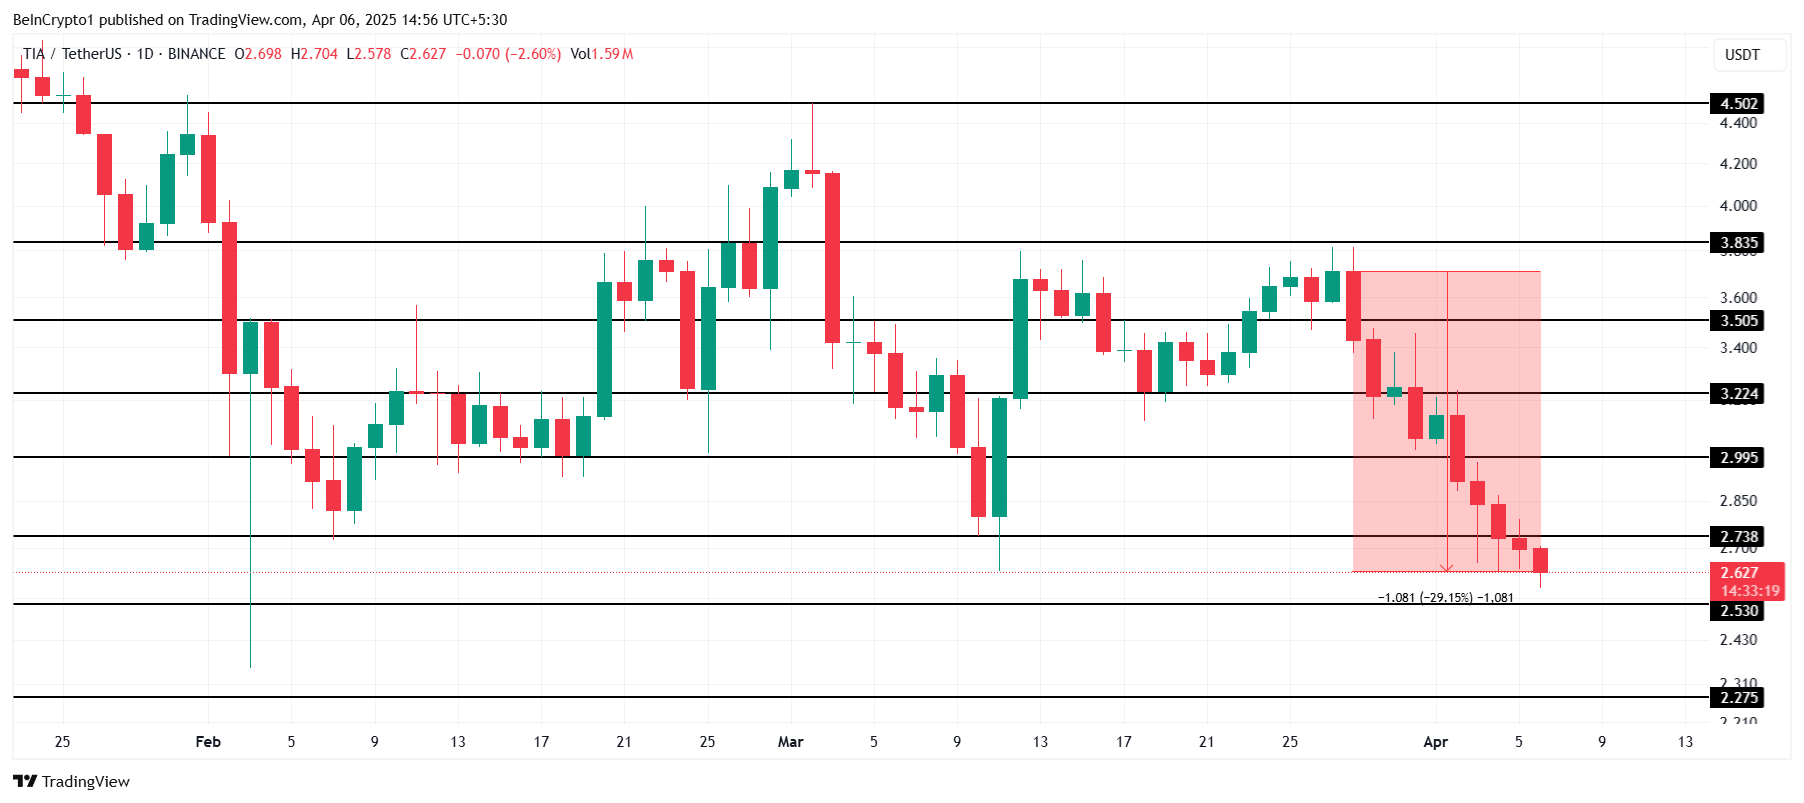
However, if Celestia fails to hold the $2.53 support, it could trigger a further decline towards $2.27. This would invalidate the bullish outlook, prolonging the downtrend and extending investors’ losses.
Disclaimer
In line with the Trust Project guidelines, this price analysis article is for informational purposes only and should not be considered financial or investment advice. BeInCrypto is committed to accurate, unbiased reporting, but market conditions are subject to change without notice. Always conduct your own research and consult with a professional before making any financial decisions. Please note that our Terms and Conditions, Privacy Policy, and Disclaimers have been updated.
Market
Conor McGregor’s Crypto Token REAL Tanks After Launch

Conor McGregor, the former UFC champion, has entered the crypto scene with the launch of a new memecoin dubbed REAL.
Despite the star power behind it, REAL is off to a sluggish start, struggling to attract investor interest in a memecoin market that is still reeling from recent scandals.
Conor McGregor’s REAL Token Raises Just $218,000
Announced on April 5, McGregor unveiled his plans to disrupt the digital asset space, claiming he had already changed the fight, whiskey, and stout industries.
“I changed the FIGHT game. I changed the WHISKEY game. I changed the STOUT game. Now it’s time to change the CRYPTO game. This is just the beginning. This is REAL,” McGregor announced on X.
His latest move involves a partnership with Real World Gaming DAO to launch REAL. The token promises staking rewards and governance rights through a decentralized autonomous organization.
According to the project’s website, the team opted for a sealed-bid auction model to launch the token, aiming to prevent bot manipulation and create fairer pricing.
Under this system, participants submitted bids using USDC. Successful bidders would receive REAL tokens based on a clearing price, while those who didn’t meet the mark would be refunded.
“The auction will be open for 28 hours, after which a single clearing price will be determined. Tokens will be locked for 12 hours after auction close to facilitate a snipe-free deployment of on-chain liquidity. Proceeds from the auction will seed this pool and fund the DAO treasury,” the project added.
However, the community’s response to the project has been underwhelming. The team aimed to raise $3.6 million, with a minimum threshold of $1 million. As of press time, the auction has raised just $218,000, far below expectations.

Several issues appear to be fueling investor hesitation. Critics have called out the token’s short unlock window, warning that it creates ideal conditions for rapid sell-offs.
Others raised concerns about the project’s use of third-party logos on its site, hinting at misleading promotional tactics.
Moreover, community feedback about the project has also been overwhelmingly negative. Many users labeled the tokenomics as flawed and accused the team of focusing on short-term hype rather than sustainable value.
“If you’re buying REAL token, prepare to get dumped on. The tokenomics are absolute trash, and the unlock cliff is only 12 hours. You’re essentially giving your money away if you buy this token,” Crypto Rug Muncher wrote.

Meanwhile, the dismal launch reflects broader exhaustion in the meme coin sector, which has been rattled by recent scandals involving other celebrity-backed tokens.
Tokens tied to Donald Trump and Melania, for instance, have seen sharp declines that have caused investors significant losses.
“Celebrity coins like McGregor’s REAL and Trumps’ are toxic for crypto! Driven by hype, they lack utility, $Trump crashed 81%, $Melania 92%. These [tokens] hurt investors and crypto’s reputation. We need utility tokens for real value and growth,” Maragkos Petros, the founder of MetadudesX said on social media platform X.
Disclaimer
In adherence to the Trust Project guidelines, BeInCrypto is committed to unbiased, transparent reporting. This news article aims to provide accurate, timely information. However, readers are advised to verify facts independently and consult with a professional before making any decisions based on this content. Please note that our Terms and Conditions, Privacy Policy, and Disclaimers have been updated.
Market
HBAR Could Avoid $30 Million Liquidation Thanks to Death Cross

HBAR has recently experienced a significant price correction, pulling the altcoin to a critical support level. As the market conditions continue to show weakness, the price action has left HBAR vulnerable.
However, this downside movement might be offering short traders a chance to avoid heavy liquidation losses.
Hedera Traders Stand To Lose A Lot
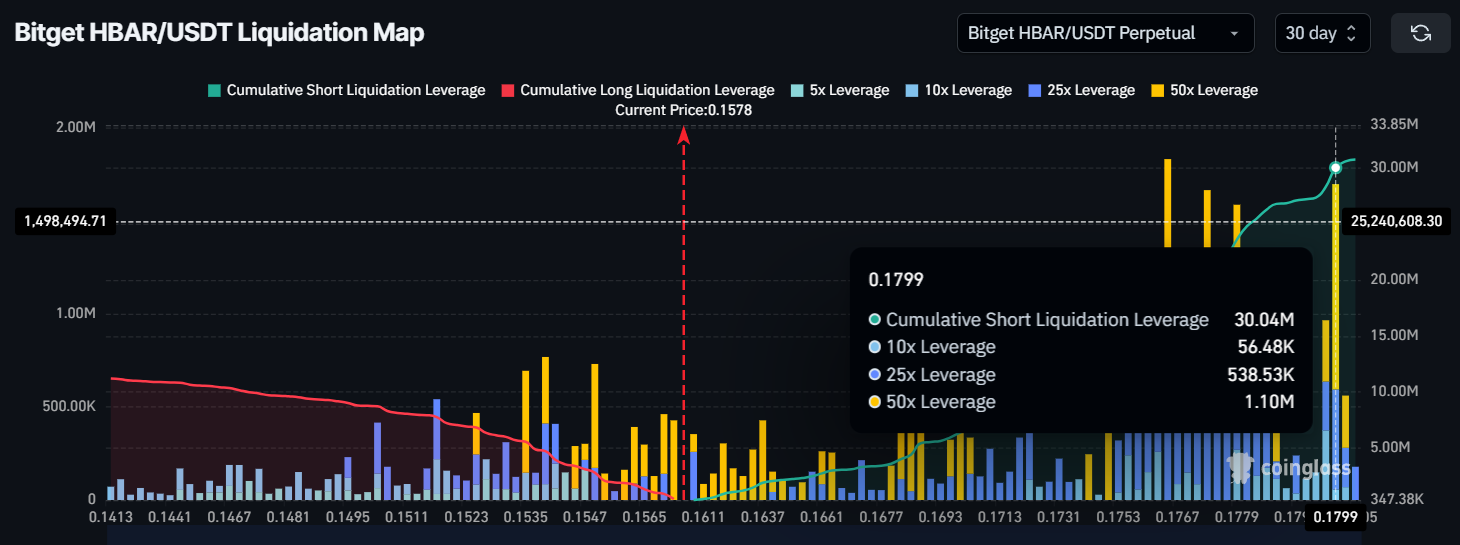
The liquidation map indicates a situation of concern for short traders. Approximately $30 million worth of short contracts are poised for liquidation if the HBAR price rises to $0.18. This could cause massive losses for traders who are betting against the asset. However, the current price range near $0.157 has provided some relief as the market struggles to breach lower support levels.
If HBAR maintains its position above key levels, these traders may be spared the liquidation risk for now. Despite the challenging market conditions, this scenario actually provides a buffer for traders, helping them avoid significant losses.
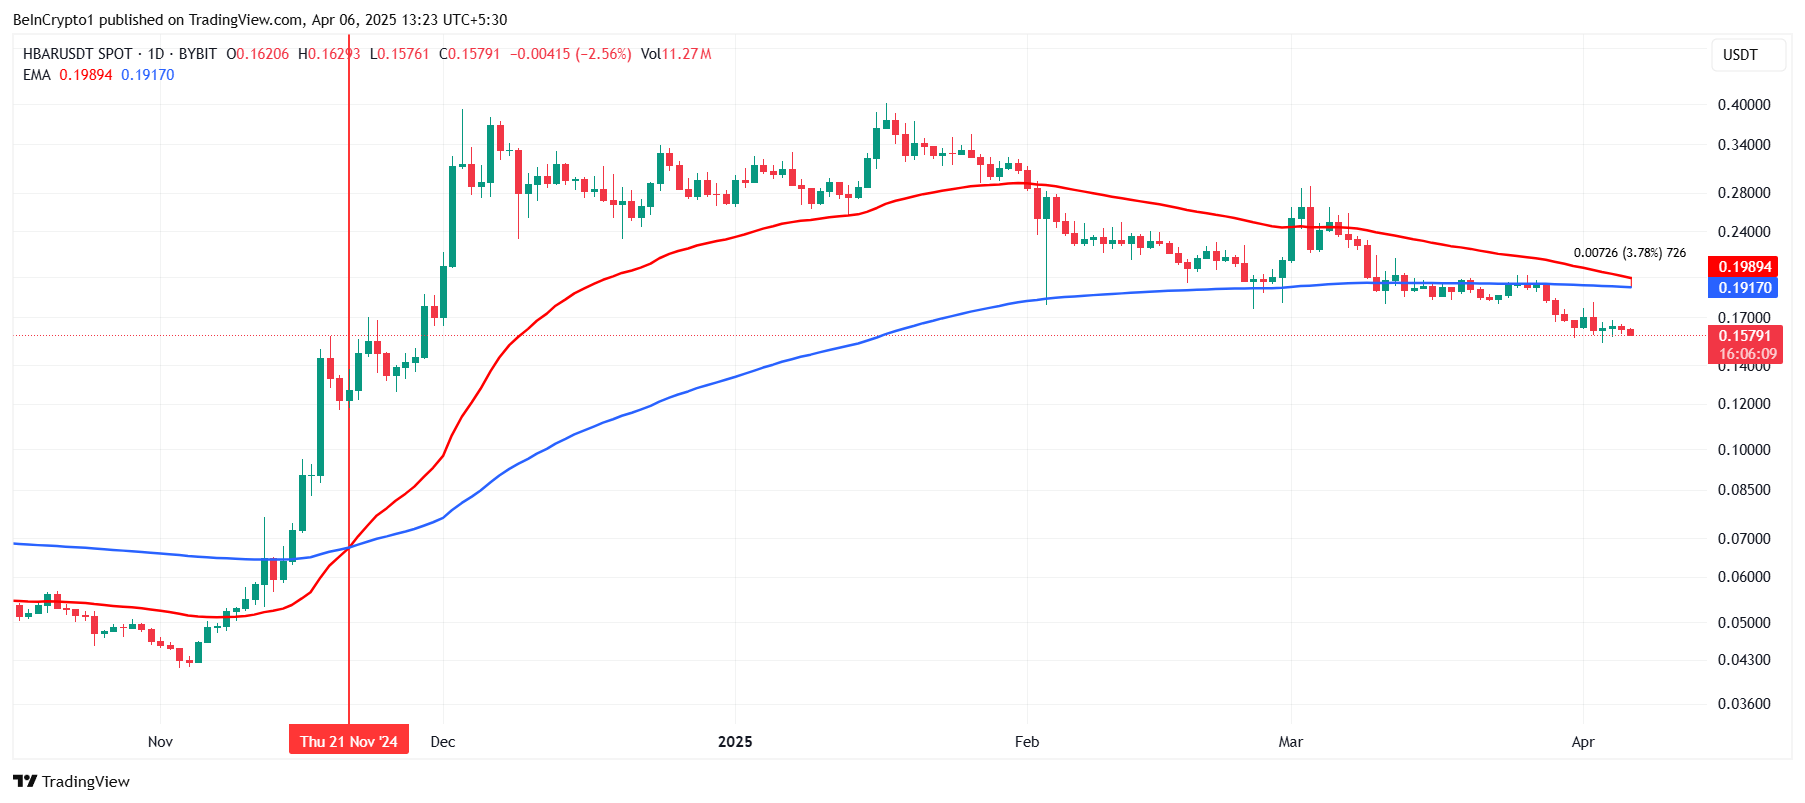
The overall macro momentum for HBAR shows signs of potential downside pressure as the cryptocurrency approaches a Death Cross. The 200-day exponential moving average (EMA) is just over 3% away from crossing the 50-day EMA.
This technical formation, when confirmed, signals a possible continuation of the bearish trend and could push HBAR further down in the coming days.
The close proximity of these two EMAs has increased the chances of the Death Cross, which could result in further losses for HBAR holders. The market’s lack of substantial improvement and the growing uncertainty surrounding price action contribute to the likelihood of the Death Cross forming.
HBAR Price Holds Above Support
HBAR is currently trading at $0.157, holding just above the critical support level of $0.154. While it has managed to stay above this support for now, it remains vulnerable to falling through it if bearish sentiment intensifies. A break below $0.154 would likely trigger a deeper decline, with the next support level at $0.143.
If HBAR fails to hold the $0.154 support, a further drop could confirm the Death Cross formation. Should this scenario unfold, the price might continue downward toward $0.143, and further declines could follow, pushing HBAR toward $0.12 or lower.
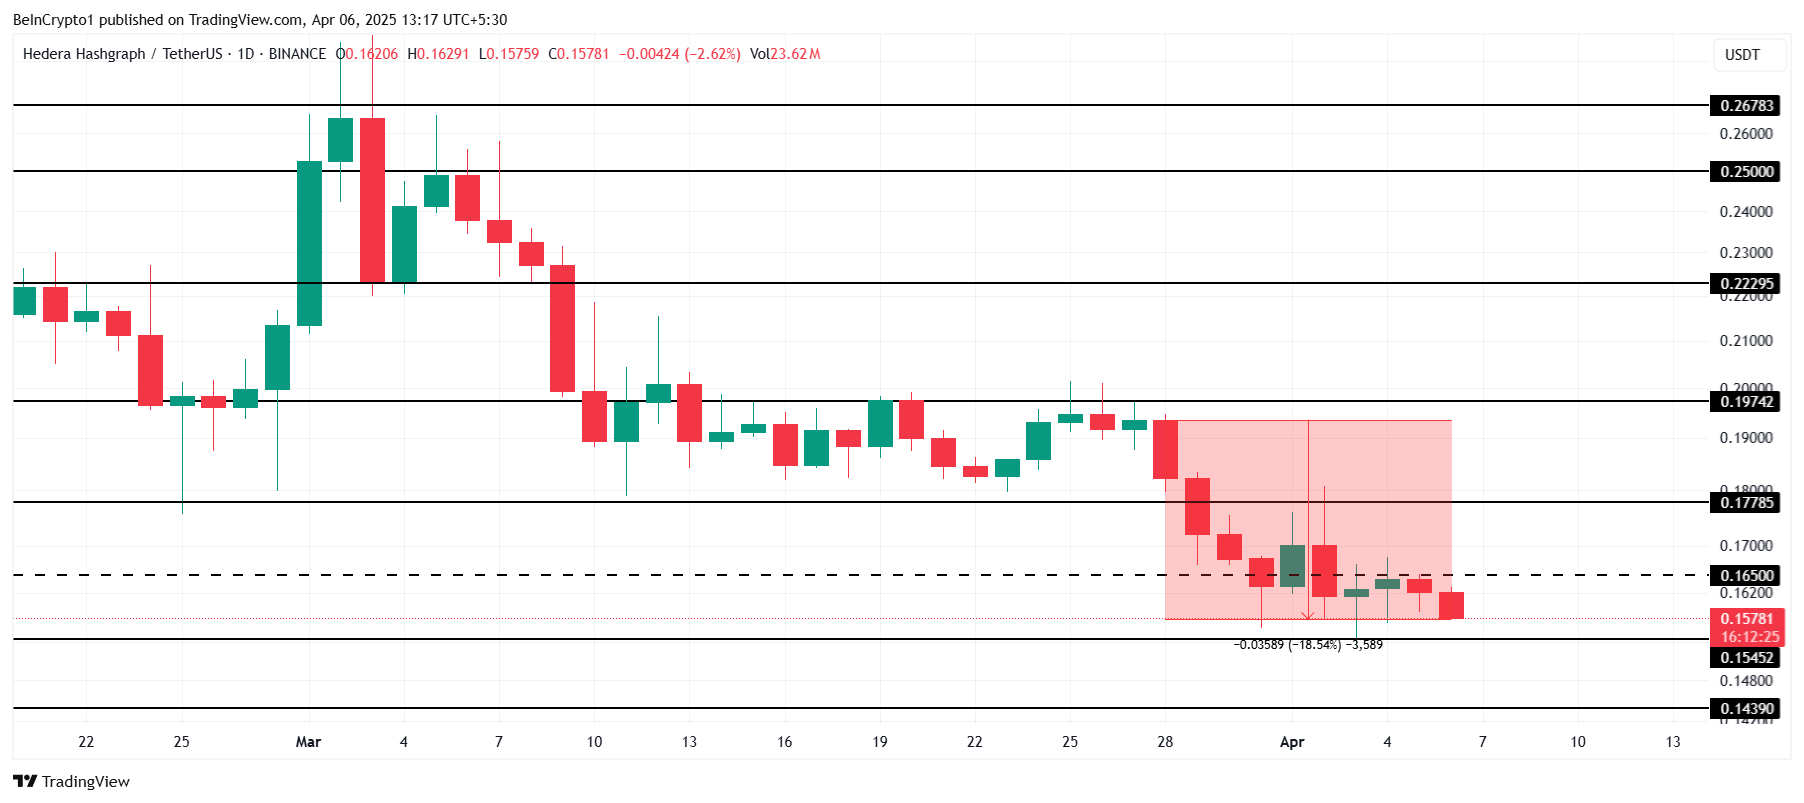
On the other hand, if HBAR can bounce back from $0.154, a recovery rally is possible. Successfully flipping the $0.165 resistance into support could push the price toward $0.177. This movement would bring the liquidation scenario closer to reality, as short traders could face significant losses in a reversal.
Disclaimer
In line with the Trust Project guidelines, this price analysis article is for informational purposes only and should not be considered financial or investment advice. BeInCrypto is committed to accurate, unbiased reporting, but market conditions are subject to change without notice. Always conduct your own research and consult with a professional before making any financial decisions. Please note that our Terms and Conditions, Privacy Policy, and Disclaimers have been updated.
-

 Bitcoin22 hours ago
Arthur Hayes Sees Tariff War Pushing Bitcoin Toward $1 Million
-

 Market22 hours ago
Dogecoin Faces $200 Million Liquidation If It Slips To This Price
-

 Altcoin22 hours ago
Expert Calls On Pi Network To Burn Tokens To Revive Pi Coin Price
-

 Ethereum22 hours ago
Crypto Analyst Who Called Ethereum Price Dump Says ETH Is Now Undervalued, Time To Buy?
-

 Market20 hours ago
IMX Price Nears All-Time Low After 30 Million Token Sell-Off
-

 Market23 hours ago
SEC’s Crypto War Fades as Ripple, Coinbase Lawsuits Drop
-

 Market19 hours ago
Key Levels To Watch For Potential Breakout
-

 Market18 hours ago
Solana Altcoin Saros Rallies 1000% Since March, Hits New High


