
Market
Solana Price Falls 19%; Losses Push Investors To Sell And Exit

Solana has faced significant price corrections recently, erasing gains made in mid-March. The altcoin is currently trading at $116, reflecting a 19% loss over the past ten days.
As the price continues to struggle, many investors are losing patience, pushing them to sell their holdings and exit the market.
Solana Losses Mount
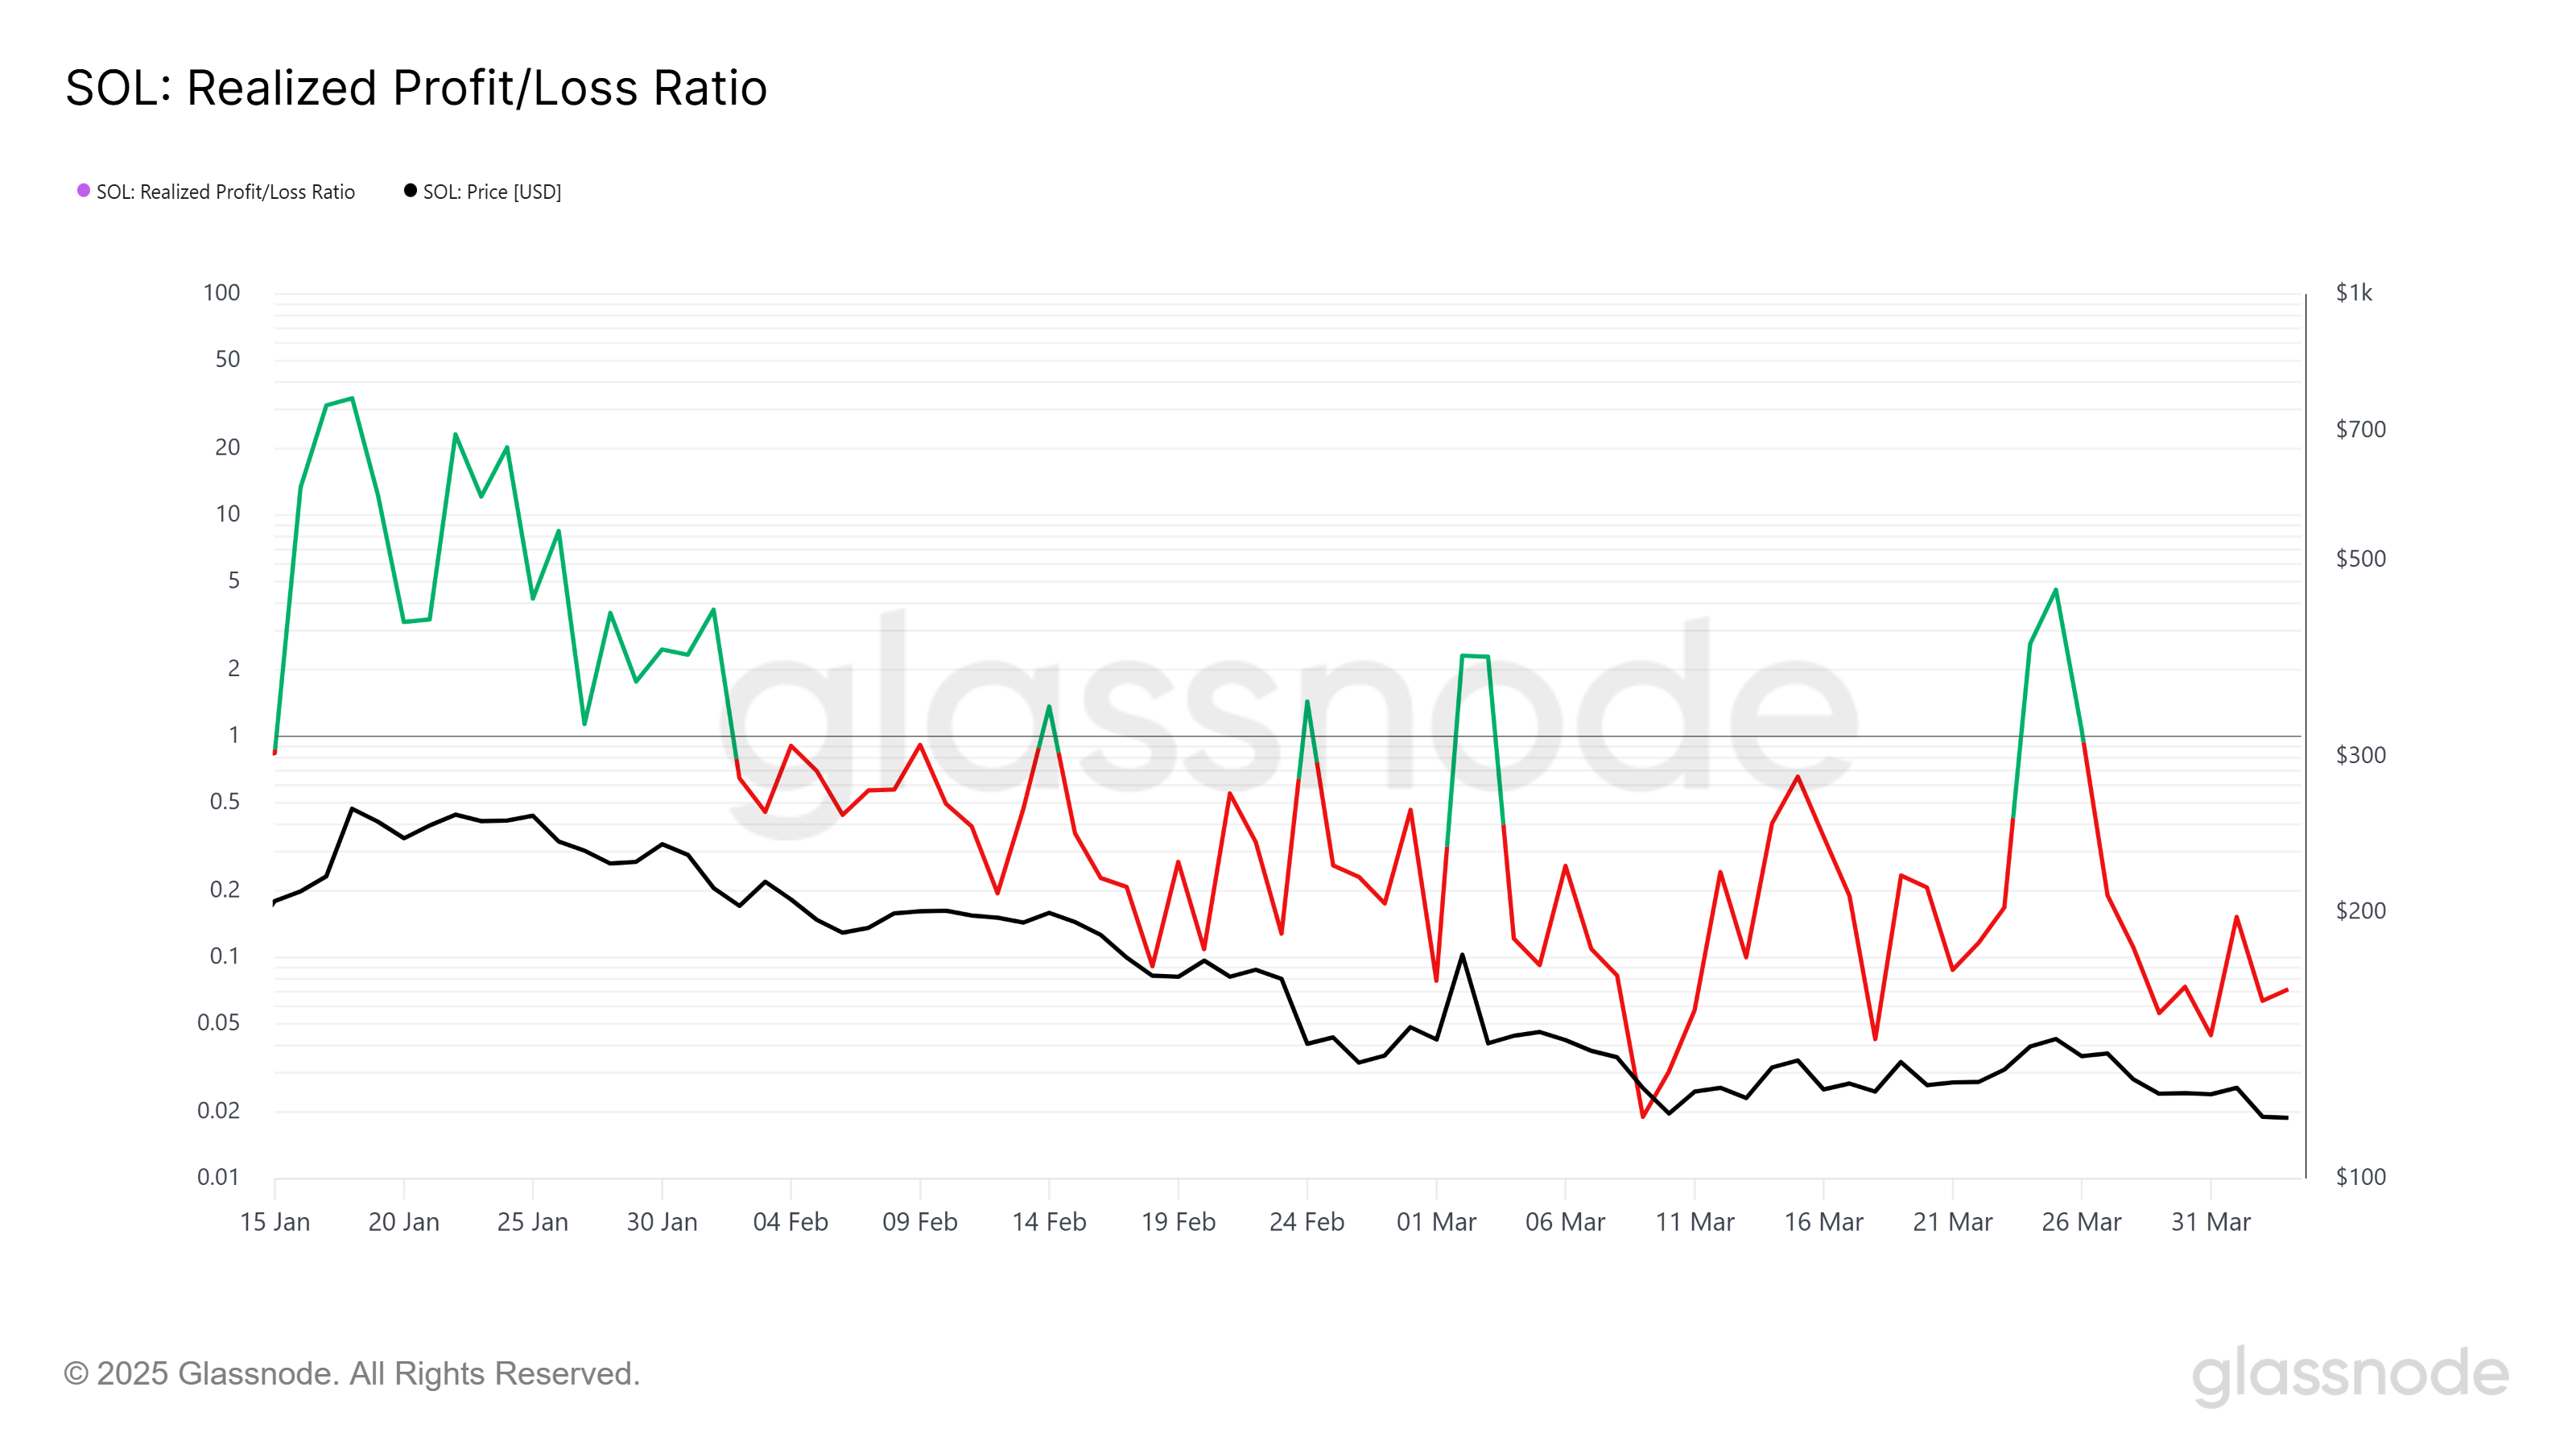
The Realized Profit/Loss (RPL) indicator shows that Solana has been underperforming for most of February and March. While there were brief moments of profit for short-term holders (STHs), the overall trend has been bearish.
These losses have contributed to mounting frustration among investors, leading many to consider selling their positions. The selling pressure is keeping the market from recovering as more and more investors choose to cut their losses.
As a result, investor sentiment has weakened, with many unwilling to hold onto their positions in the face of continued price declines. The Realized Profit/Loss data indicates that, in addition to the selling pressure from STHs, the broader market is also showing signs of caution.
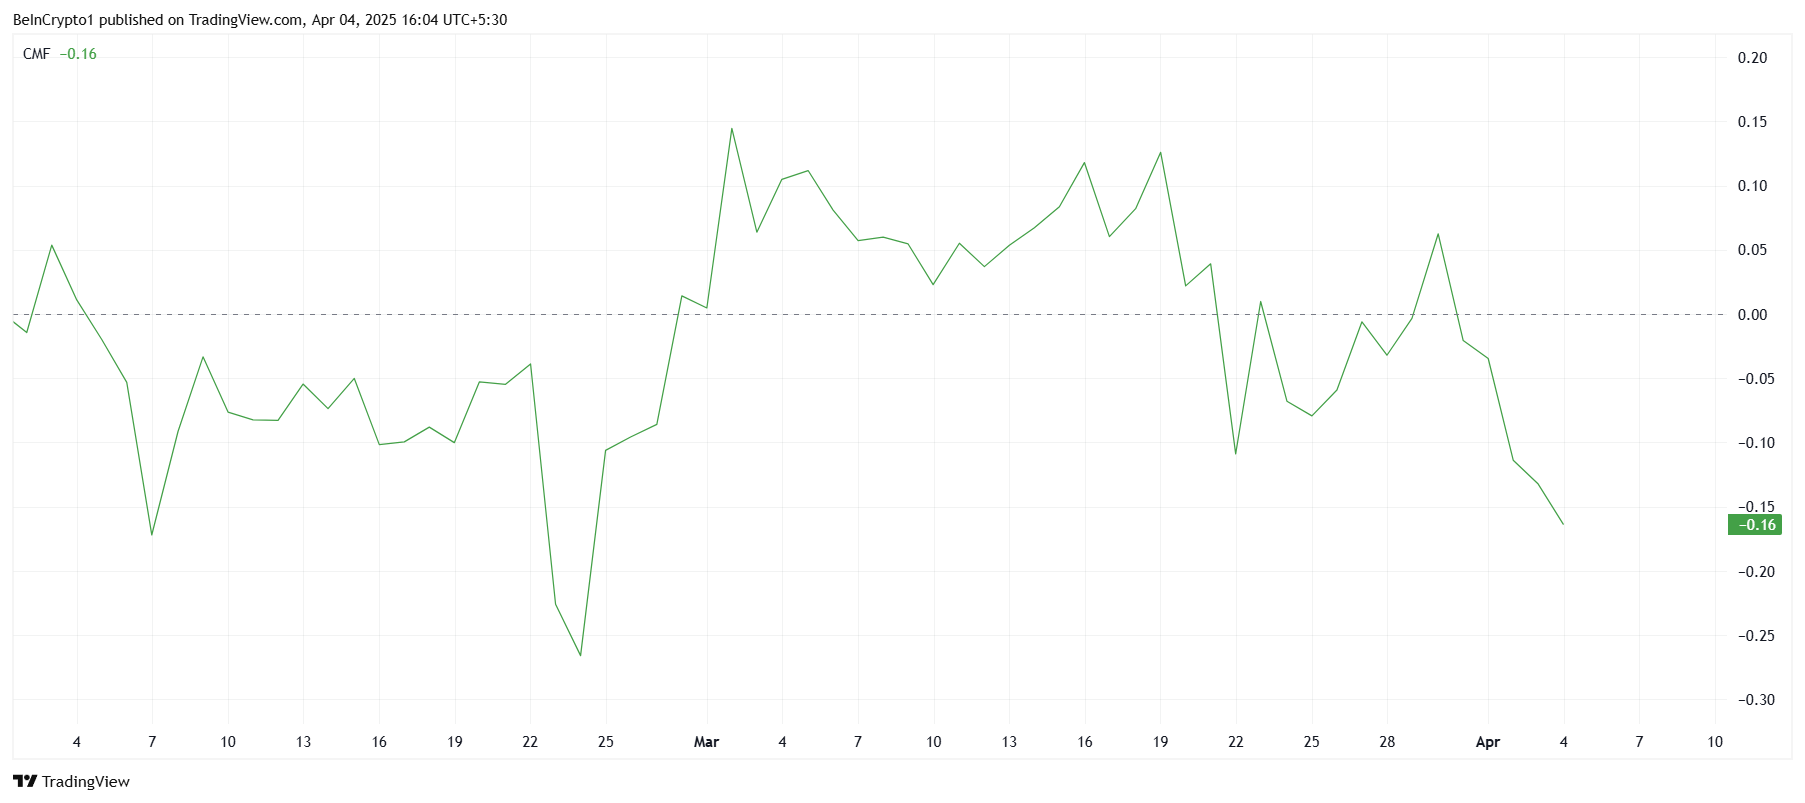
The Chaikin Money Flow (CMF) indicator also shows a concerning trend for Solana. Currently, at a monthly low, the CMF reflects that outflows are exceeding inflows, indicating that investors are pulling their money out of Solana. This lack of buying pressure is detrimental to the altcoin’s recovery prospects, as the outflows signal reduced confidence in the asset.
With the CMF in negative territory, Solana’s ability to rally appears limited, as the overall market sentiment remains subdued. The lack of investor conviction is further exacerbating the downward momentum.
SOL Price Could Witness Further Decline
At the time of writing, Solana’s price is at $116, and it is struggling to recover from the recent losses. Despite the slight uptick observed in the past 24 hours, the altcoin’s recovery remains uncertain. With investor confidence at a low, the price may continue to struggle in the short term.
The aforementioned factors suggest that Solana could dip further to $109, extending investors’ losses. If the bearish trend continues, SOL could test this support level before any potential signs of recovery emerge. This price action would keep investors on edge and delay any sustained rally.

However, if Solana can reclaim $118 as a support floor, it could spark a reversal. A breach of this level would push the altcoin toward $123, and flipping it into support would significantly bolster the bullish thesis. In this scenario, Solana could break through resistance levels and rise toward $135.
Disclaimer
In line with the Trust Project guidelines, this price analysis article is for informational purposes only and should not be considered financial or investment advice. BeInCrypto is committed to accurate, unbiased reporting, but market conditions are subject to change without notice. Always conduct your own research and consult with a professional before making any financial decisions. Please note that our Terms and Conditions, Privacy Policy, and Disclaimers have been updated.


Reason to trust
![]()
Strict editorial policy that focuses on accuracy, relevance, and impartiality
Created by industry experts and meticulously reviewed
The highest standards in reporting and publishing
Strict editorial policy that focuses on accuracy, relevance, and impartiality
Morbi pretium leo et nisl aliquam mollis. Quisque arcu lorem, ultricies quis pellentesque nec, ullamcorper eu odio.
Bitcoin price started a fresh decline below the $85,500 zone. BTC is now consolidating and might attempt to clear the $85,200 resistance zone.
- Bitcoin started a fresh decline below the $85,500 zone.
- The price is trading below $85,000 and the 100 hourly Simple moving average.
- There is a connecting bearish trend line forming with resistance at $84,800 on the hourly chart of the BTC/USD pair (data feed from Kraken).
- The pair could start another increase if it clears the $85,000 zone.
Bitcoin Price Eyes Fresh Increase
Bitcoin price struggled near the $86,500 zone and started a fresh decline. BTC declined below the $85,500 and $85,000 levels to enter a short-term bearish zone.
The price tested the $83,200 support. A low was formed at $83,171 and the price recently corrected some losses. There was a move above the $83,800 level. The price surpassed the 50% Fib retracement level of the downward move from the $86,401 swing high to the $83,171 low.
Bitcoin price is now trading below $85,000 and the 100 hourly Simple moving average. On the upside, immediate resistance is near the $84,750 level. There is also a connecting bearish trend line forming with resistance at $84,800 on the hourly chart of the BTC/USD pair.
The first key resistance is near the $85,150 level or the 61.8% Fib retracement level of the downward move from the $86,401 swing high to the $83,171 low. The next key resistance could be $85,500.

A close above the $85,500 resistance might send the price further higher. In the stated case, the price could rise and test the $85,800 resistance level. Any more gains might send the price toward the $86,400 level.
Another Decline In BTC?
If Bitcoin fails to rise above the $85,000 resistance zone, it could start another decline. Immediate support on the downside is near the $83,900 level. The first major support is near the $83,200 level.
The next support is now near the $82,200 zone. Any more losses might send the price toward the $81,500 support in the near term. The main support sits at $80,800.
Technical indicators:
Hourly MACD – The MACD is now losing pace in the bearish zone.
Hourly RSI (Relative Strength Index) – The RSI for BTC/USD is now near the 50 level.
Major Support Levels – $83,200, followed by $82,200.
Major Resistance Levels – $84,750 and $85,150.

Massive Bitcoin withdrawals worth hundreds of millions of USD from major exchanges have sparked significant interest in the crypto community.
However, if Bitcoin fails to break the $86,000 barrier, a price correction remains a real possibility, especially amid wavering investor confidence.
Bitcoin Whales Withdraw Hundreds of Millions in BTC
Data from the X account OnchainDataNerd on April 17, reveals that several large Bitcoin whales executed substantial withdrawals from top exchanges. Galaxy Digital withdrew 554 BTC, valued at approximately $76.74 million, from OKX and Binance.
Abraxas Capital pulled out 1,854 BTC, worth around $157.26 million, from Binance and Kraken.
Two other whales, identified by addresses 1MNqX and 1BERu, withdrew 545.5 BTC ($45.5 million) and 535.2 BTC ($45.44 million) from Coinbase, respectively. In a single day, over $280 million in Bitcoin was removed from exchanges.
Such withdrawals from Bitcoin whales, like those by Galaxy Digital and Abraxas Capital, often signal a strategy to move BTC into cold storage. This is typically viewed as a bullish sign, reducing selling pressure and reflecting expectations of future price increases.
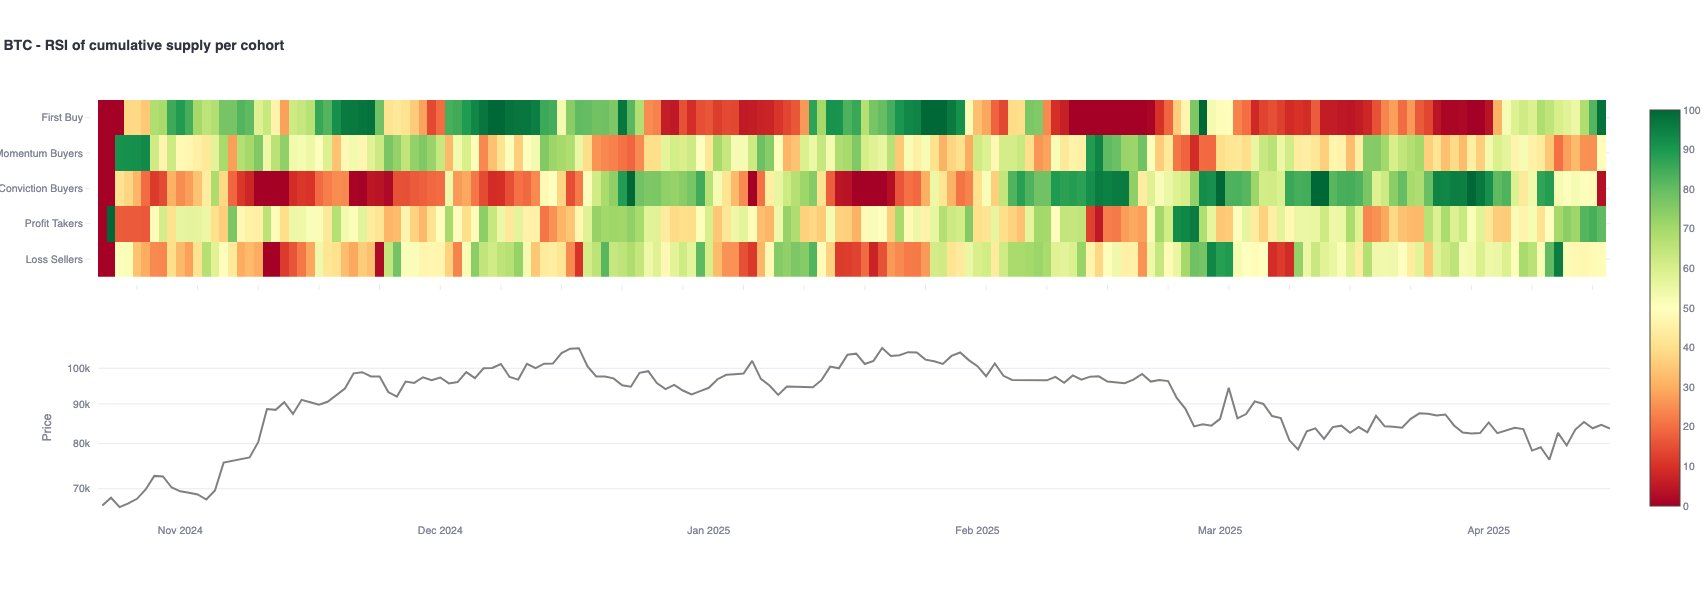
Surge in First-Time Bitcoin Buyers
A report from Glassnode on X highlights a sharp rise in first-time Bitcoin buyers. This influx of new investors could drive short-term price gains. However, long-term holders (LTHs) have paused their accumulation, signaling caution amid heightened market volatility.
In a post on X, the analyst Ali used the TD Sequential technical indicator to forecast Bitcoin’s price trend. The TD Sequential flashed a buy signal on the Bitcoin weekly chart.
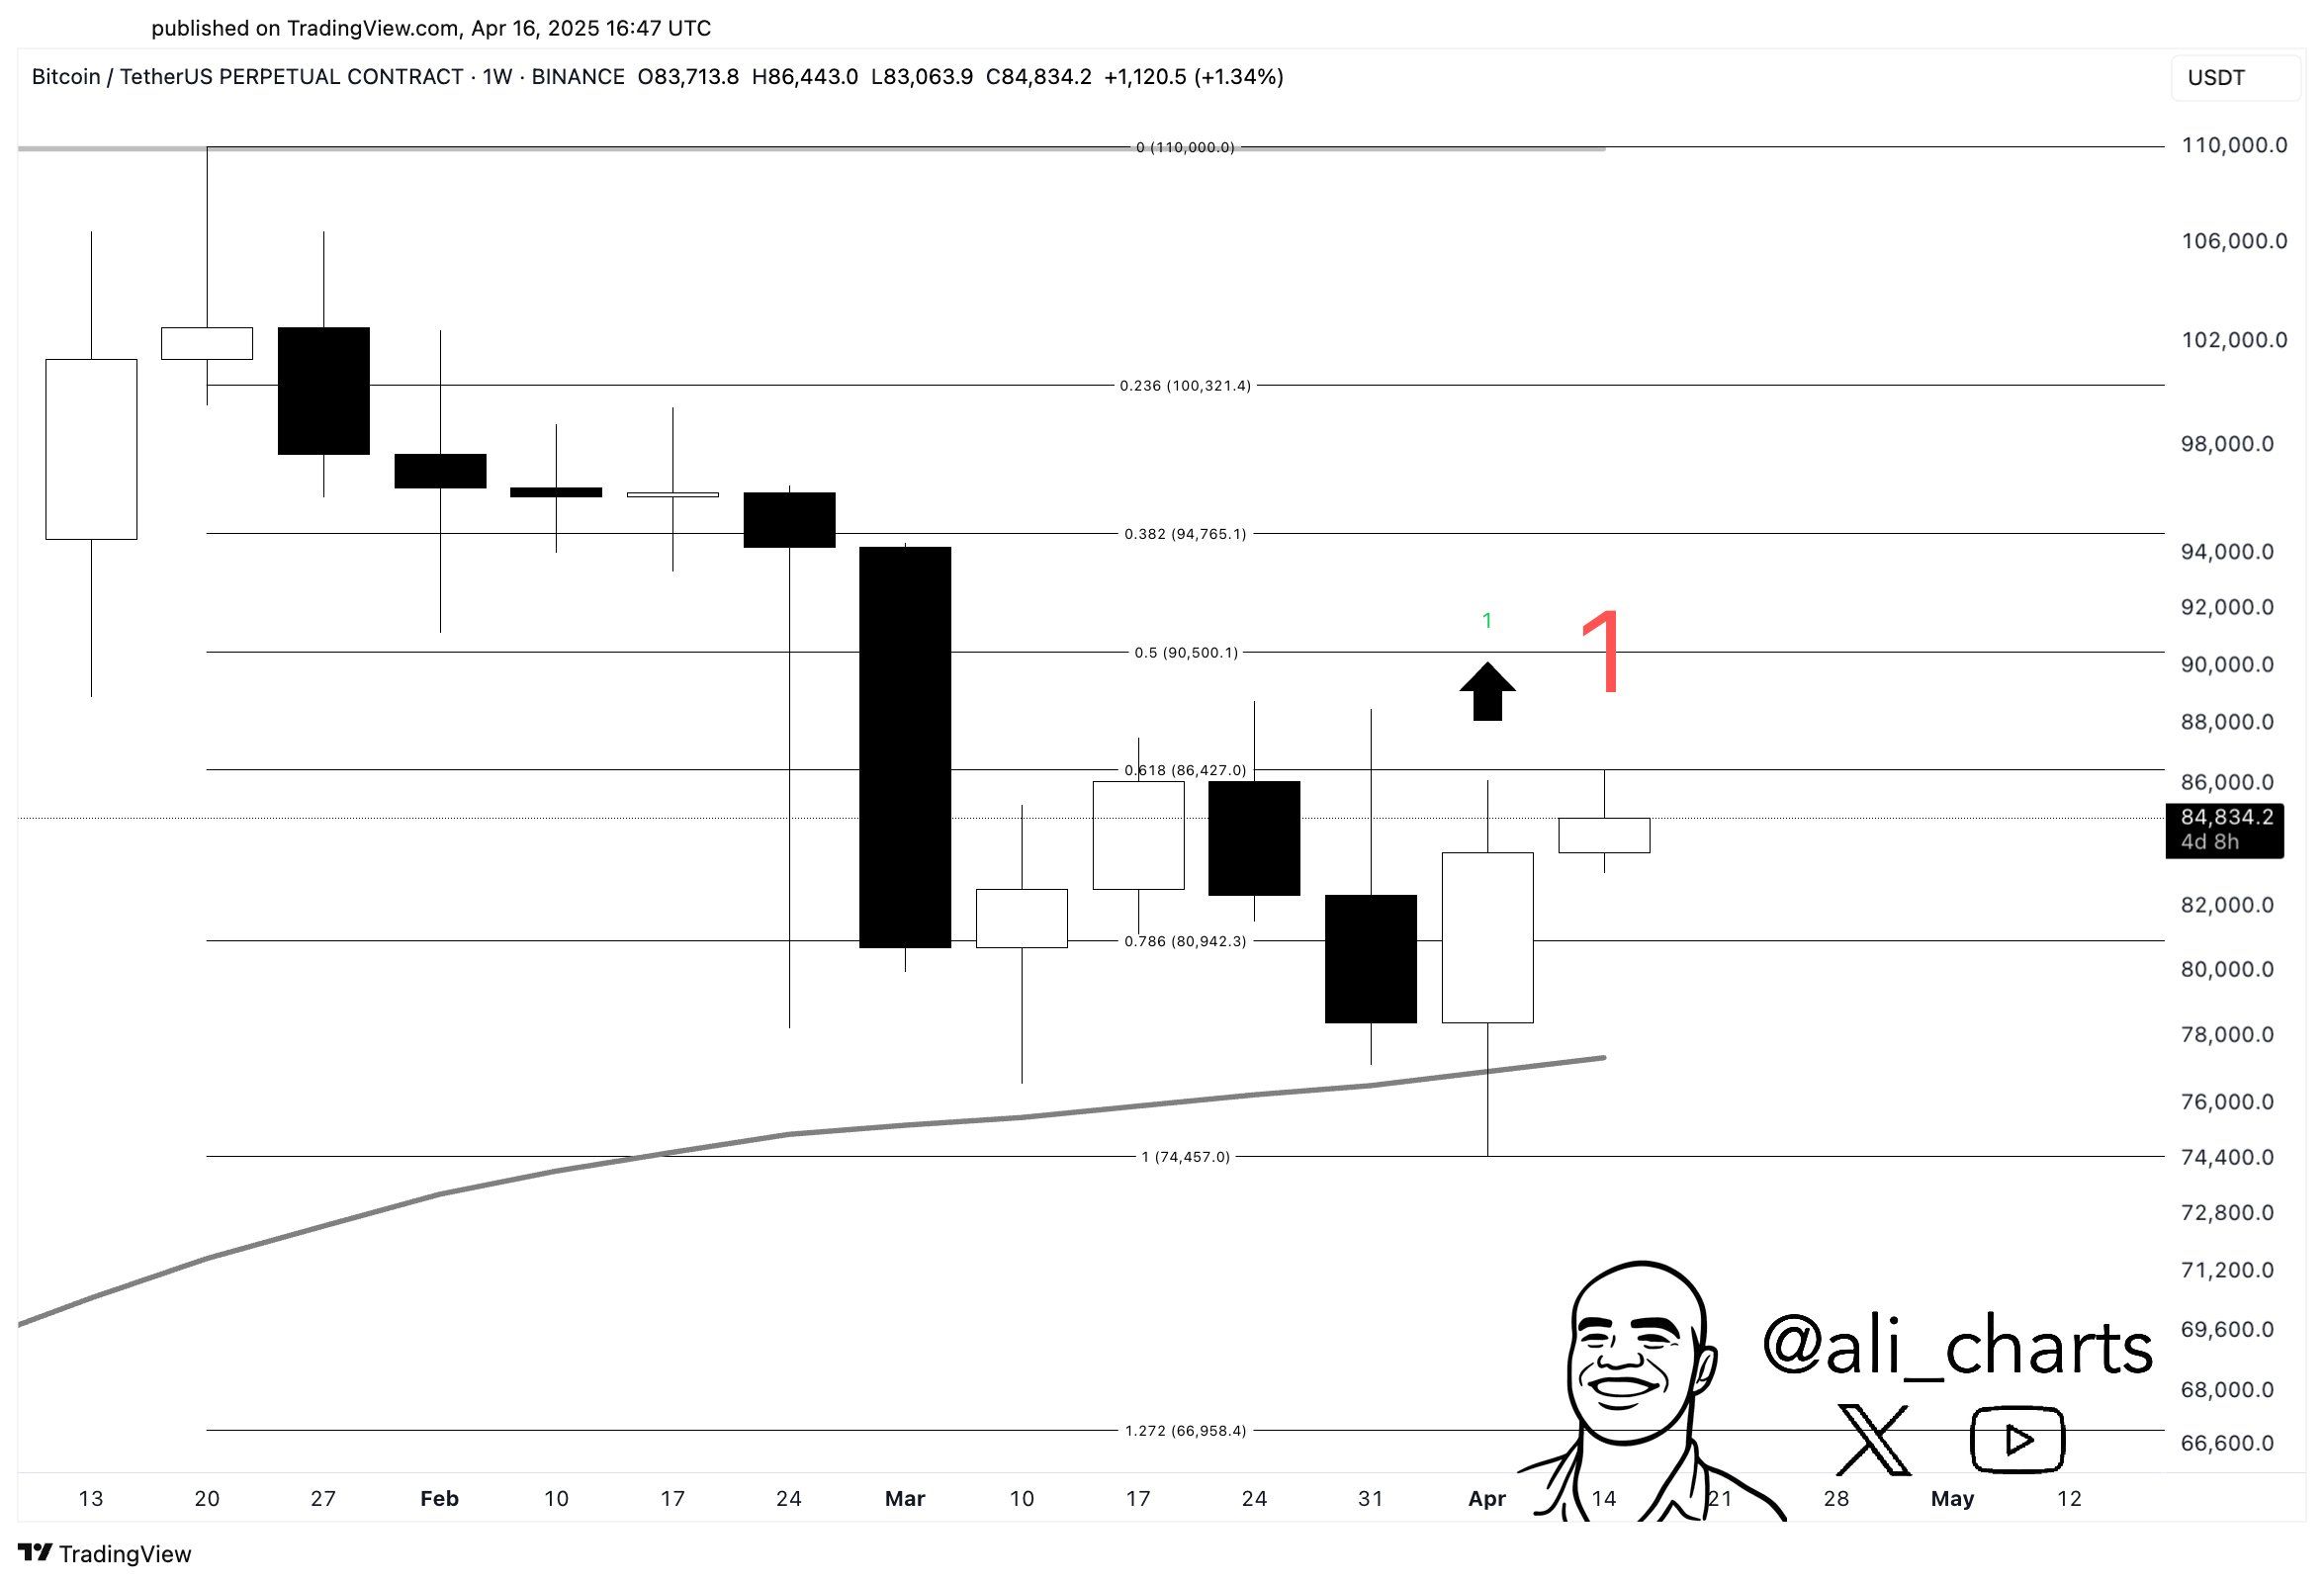
If Bitcoin consistently closes above $86,000, further price increases are likely. Currently, Bitcoin is hovering above $80,000, indicating growth potential. However, surpassing the critical $86,000 resistance level is essential to confirm the bullish trend.

Despite recent whale accumulation, not all signals are positive. Inflows into Bitcoin ETFs have dropped significantly. This decline suggests weakening investor confidence, which could exert downward pressure on prices without fresh catalysts.
Additionally, data from Lookonchain indicates that over $1.26 billion in Bitcoin was unstaked from Babylon. If this capital flows back to exchanges, selling pressure could intensify, making it harder for Bitcoin to breach key resistance levels.
Disclaimer
In adherence to the Trust Project guidelines, BeInCrypto is committed to unbiased, transparent reporting. This news article aims to provide accurate, timely information. However, readers are advised to verify facts independently and consult with a professional before making any decisions based on this content. Please note that our Terms and Conditions, Privacy Policy, and Disclaimers have been updated.

XRP price started a fresh decline below the $2.150 zone. The price is now consolidating above $2.00 and facing hurdles near the $2.120 zone.
- XRP price started a downside correction from the $2.250 resistance zone.
- The price is now trading below $2.10 and the 100-hourly Simple Moving Average.
- There is a key bearish trend line forming with resistance at $2.130 on the hourly chart of the XRP/USD pair (data source from Kraken).
- The pair might extend losses if there is a close below the $2.00 support zone.
XRP Price Faces Resistance
XRP price started a downside correction from the $2.250 zone, like Bitcoin and Ethereum. The price traded below the $2.150 and $2.120 levels to enter a bearish zone.
The price even spiked below $2.050 but stayed above $2.00. A low was formed at $2.036 and the price is now consolidating losses. There was a recovery wave above the $2.10 level. The price spiked above the 50% Fib retracement level of the downward move from the $2.184 swing high to the $2.036 low.
The price is now trading below $2.10 and the 100-hourly Simple Moving Average. On the upside, the price might face resistance near the $2.120 level. There is also a key bearish trend line forming with resistance at $2.130 on the hourly chart of the XRP/USD pair.

The trend line is near the 61.8% Fib retracement level of the downward move from the $2.184 swing high to the $2.036 low. The first major resistance is near the $2.180 level. The next resistance is $2.20. A clear move above the $2.20 resistance might send the price toward the $2.250 resistance. Any more gains might send the price toward the $2.320 resistance or even $2.350 in the near term. The next major hurdle for the bulls might be $2.50.
More Losses?
If XRP fails to clear the $2.120 resistance zone, it could start another decline. Initial support on the downside is near the $2.030 level. The next major support is near the $2.00 level.
If there is a downside break and a close below the $2.00 level, the price might continue to decline toward the $1.920 support. The next major support sits near the $1.840 zone.
Technical Indicators
Hourly MACD – The MACD for XRP/USD is now losing pace in the bearish zone.
Hourly RSI (Relative Strength Index) – The RSI for XRP/USD is now below the 50 level.
Major Support Levels – $2.030 and $2.00.
Major Resistance Levels – $2.120 and $2.180.

Bitcoin Price Range-Bound—But a Move Higher May Be Brewing?

How Crypto Traders Made $666K from $4.5K in One Trade?

Bitcoin Whales Withdraw $280 Million: Bullish Signal?
Gary Gensler Explains Why Bitcoin Will Outlast Altcoins

How Rising Solana Network Inflows Could Drive SOL Price to $150?

XRP’s $2.00 Pivot Point—A Launchpad or Breakdown Zone?

2.52 Million Altcoins Are Ruining Crypto’s Future

Animoca Brands Valuation Tanks 75% In Two Years, Here’s Why

Crypto exchange BingX hacked for $43 million

Are The Big Players Losing Interest?

Hong Kong’s Securities Association Tips Authorities On Crypto Self-Regulation

Coinbase cbBTC Set to go Live on Solana
2.52 Million Altcoins Are Ruining Crypto’s Future
Animoca Brands Valuation Tanks 75% In Two Years, Here’s Why
Crypto exchange BingX hacked for $43 million
Are The Big Players Losing Interest?
Hong Kong’s Securities Association Tips Authorities On Crypto Self-Regulation
Coinbase cbBTC Set to go Live on Solana
-
 Altcoin21 hours ago
Mantra (OM) Price Pumps As Founder Reveals Massive Token Burn Plan
-
 Altcoin16 hours ago
DOGE Whale Moves 478M Coins As Analyst Predicts Dogecoin Price Breakout “Within Hours”
-

 Market24 hours ago
BNB Burn Reduces Circulating Supply by $916 Million
-

 Market18 hours ago
How It’s Impacting the Network
-

 Market11 hours ago
Crypto Market Lost $633 Billion in Q1 2025, CoinGecko Finds
-
 Altcoin18 hours ago
Analyst Reveals Why The Solana Price Can Still Drop To $65
-

 Market16 hours ago
Pi Network Drops10% as Outflows Surge, Death Cross Looms
-
 Market23 hours ago
Mantra’s OM Token Surges 25% After Token Burn Announcement
