Market
What to Expect After March’s Struggles

The leading altcoin, Ethereum, experienced a challenging month in March, marked by a series of bearish trends that reflected a broader market slowdown.
However, as the market begins to show signs of recovery, the key question for April remains: Can Ethereum regain its bullish momentum?
Ethereum’s March Woes: Price Crash, Activity Slump, and Growing Supply Pressure
On March 11, Ethereum plummeted to a two-year low of $1,759. This prompted traders to “buy the dip,” triggering a rally to $2,104 by March 24.
However, market participants resumed profit-taking, causing the coin’s price to fall sharply for the rest of the month. On March 31, ETH closed below the critical $2,000 price level at $1,822.
Amid ETH’s price troubles, the Ethereum network also experienced a severe decline in activity in March. Per Artemis, the daily count of active addresses that completed at least one ETH transaction fell by 20% in March.
As a result, the network’s monthly transaction count also plummeted. Totaling 1.06 million during the 31-day period in review, the number of transactions completed on Ethereum fell by 21% in March.
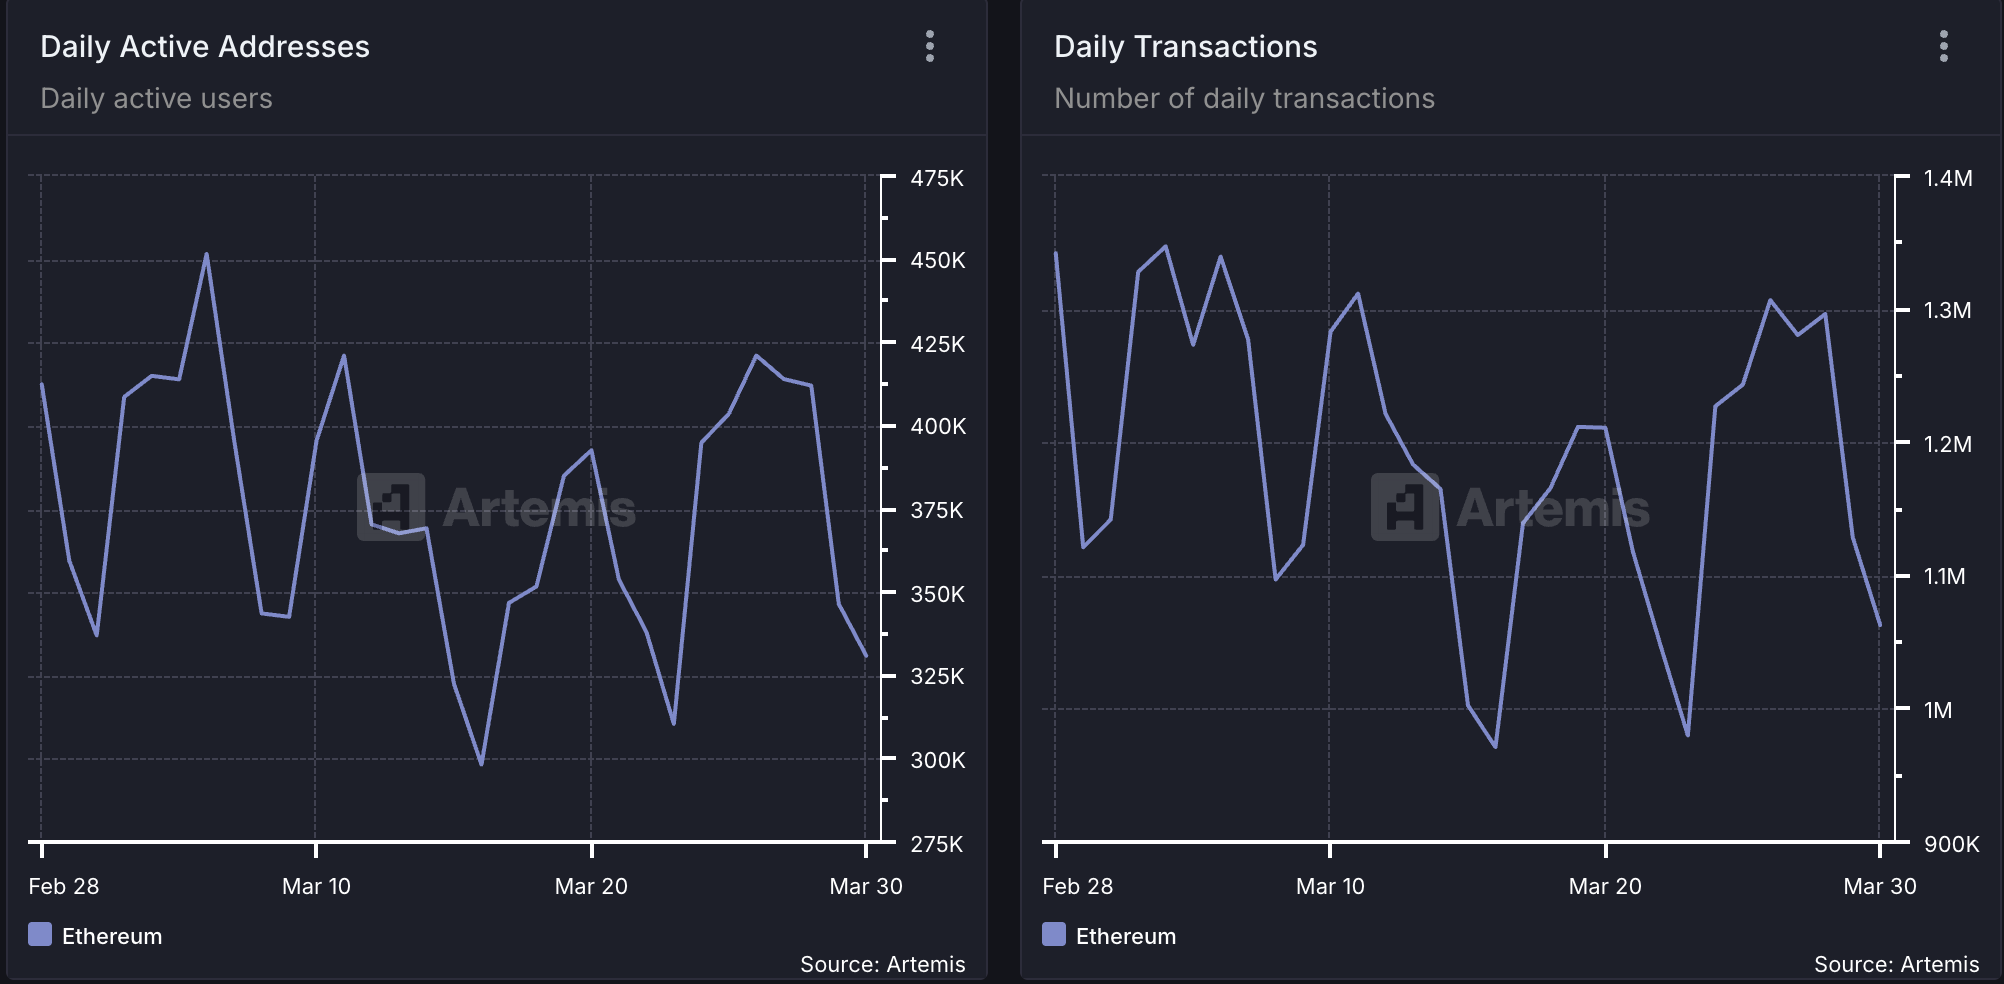
Generally, as more users transact and engage with Ethereum, the burn rate (a measure of ETH tokens permanently removed from circulation) increases, contributing to Ether’s deflationary supply dynamic. However, when user activity drops, ETH’s burn rate reduces, leaving many coins in circulation and adding to its circulating supply.
This was the case for ETH in March when it saw a spike in its circulating supply. According to data from Ultrasound Money, 74,322.37 coins have been added to ETH’s circulating supply in the past 30 days.
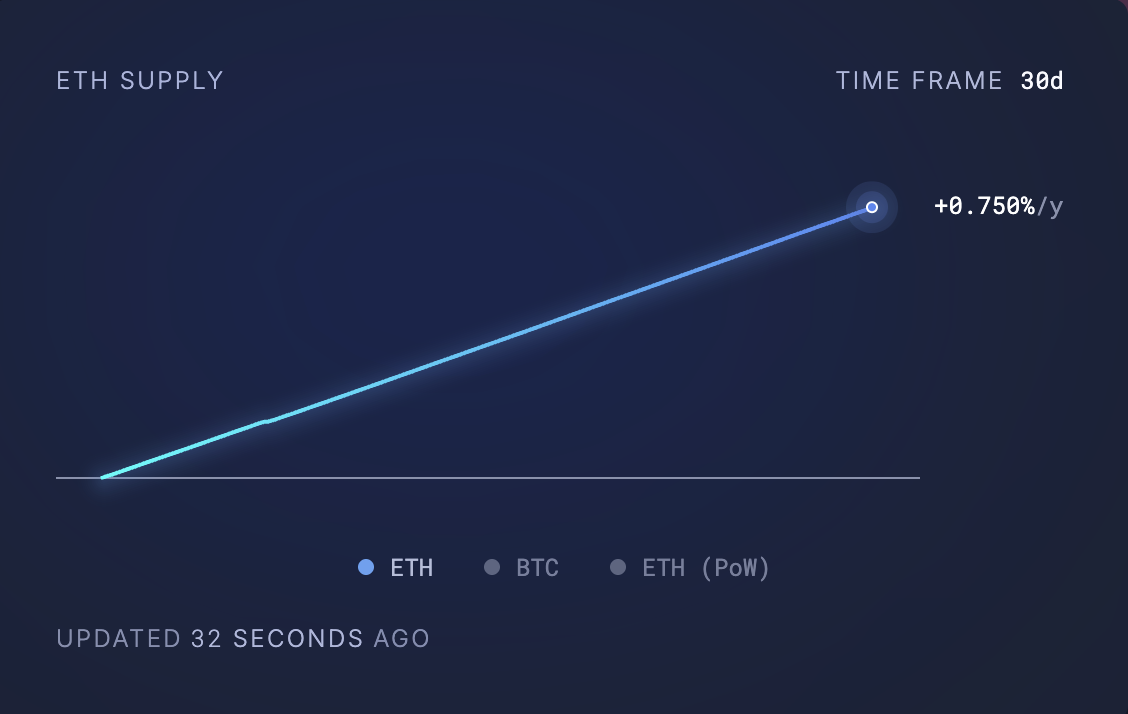
Usually, when an asset’s supply spikes like this without a corresponding demand to absorb it, it increases the downward pressure on its price. This puts ETH at risk of extending its decline in April.
What’s Next for Ethereum? Expert Says Inflation May Not Be a Major Concern
In an exclusive interview with BeInCrypto, Gabriel Halm, a Research Analyst at IntoTheBlock, noted that ETH’s current inflationary trends “may not be a major red flag” to watch out for in April.
Halm said:
“Even though Ethereum’s supply has recently stopped being deflationary, its annualized inflation rate is still only 0.73% over the last month, which is still dramatically lower than pre-Merge levels and lower than that of Bitcoin. For investors, this moderate level of inflation may not be a major red flag, provided that network usage, developer activity, and institutional adoption remain robust.”
Moreover, regarding whether Ethereum’s declining network activity has played a significant role in its recent price struggles, Halm suggested that its impact may be overstated.
“Historically, from September 2022 to early 2024, Ethereum’s supply remained deflationary, yet the ETH/BTC pair still trended lower. This suggests that macroeconomic and broader market forces can play a far more significant role than token supply changes alone.”
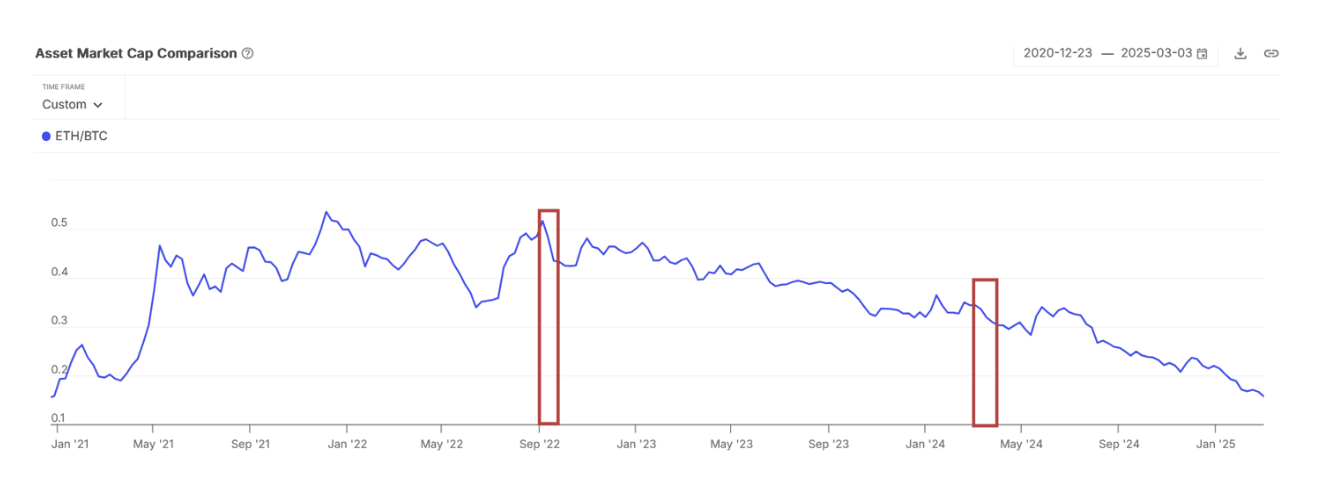
On what ETH holders should anticipate this month, Halm said:
“Ultimately, whether Ethereum dips or rallies in April will likely depend more on market sentiment and macro trends than on its short-term supply dynamics. Still, it’s essential to keep an eye on network developments that could spur renewed activity and reinforce ETH’s leading position in the broader crypto landscape.”
Disclaimer
In line with the Trust Project guidelines, this price analysis article is for informational purposes only and should not be considered financial or investment advice. BeInCrypto is committed to accurate, unbiased reporting, but market conditions are subject to change without notice. Always conduct your own research and consult with a professional before making any financial decisions. Please note that our Terms and Conditions, Privacy Policy, and Disclaimers have been updated.
Market
Onyxcoin (XCN) Price Nears Death Cross After 50% Decline

Onyxcoin (XCN) has experienced a significant downturn in recent weeks, with its price falling nearly 50% over the past month.
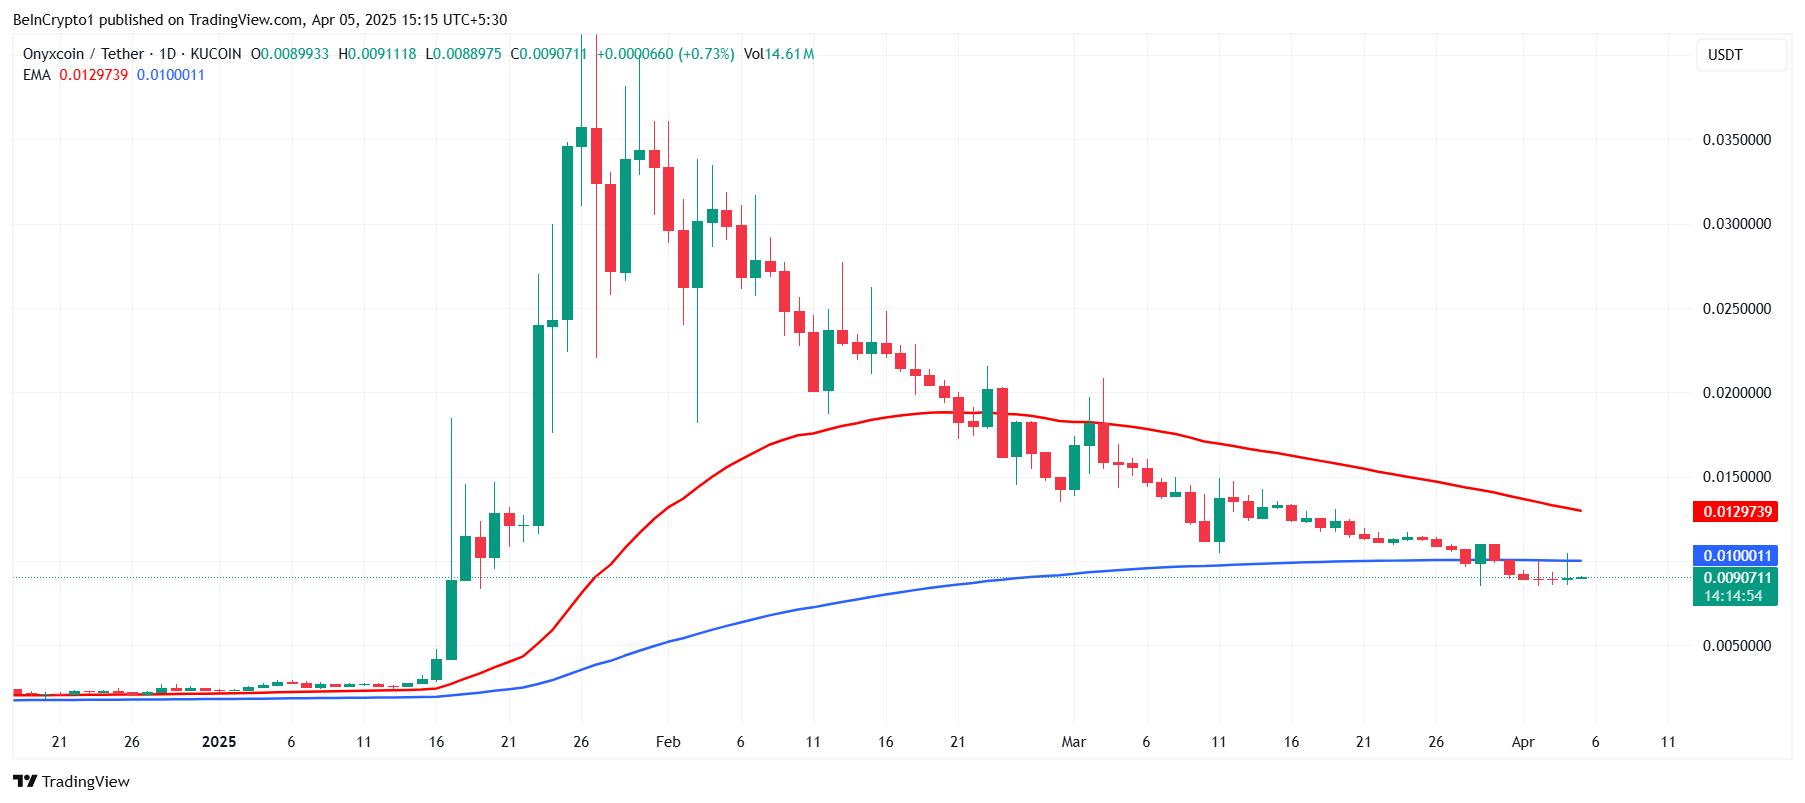
Currently trading at $0.0090, the altcoin’s performance has sparked concerns among holders as it faces the possibility of a major bearish move, including a potential Death Cross.
Onyxcoin Investors Are Losing Profits
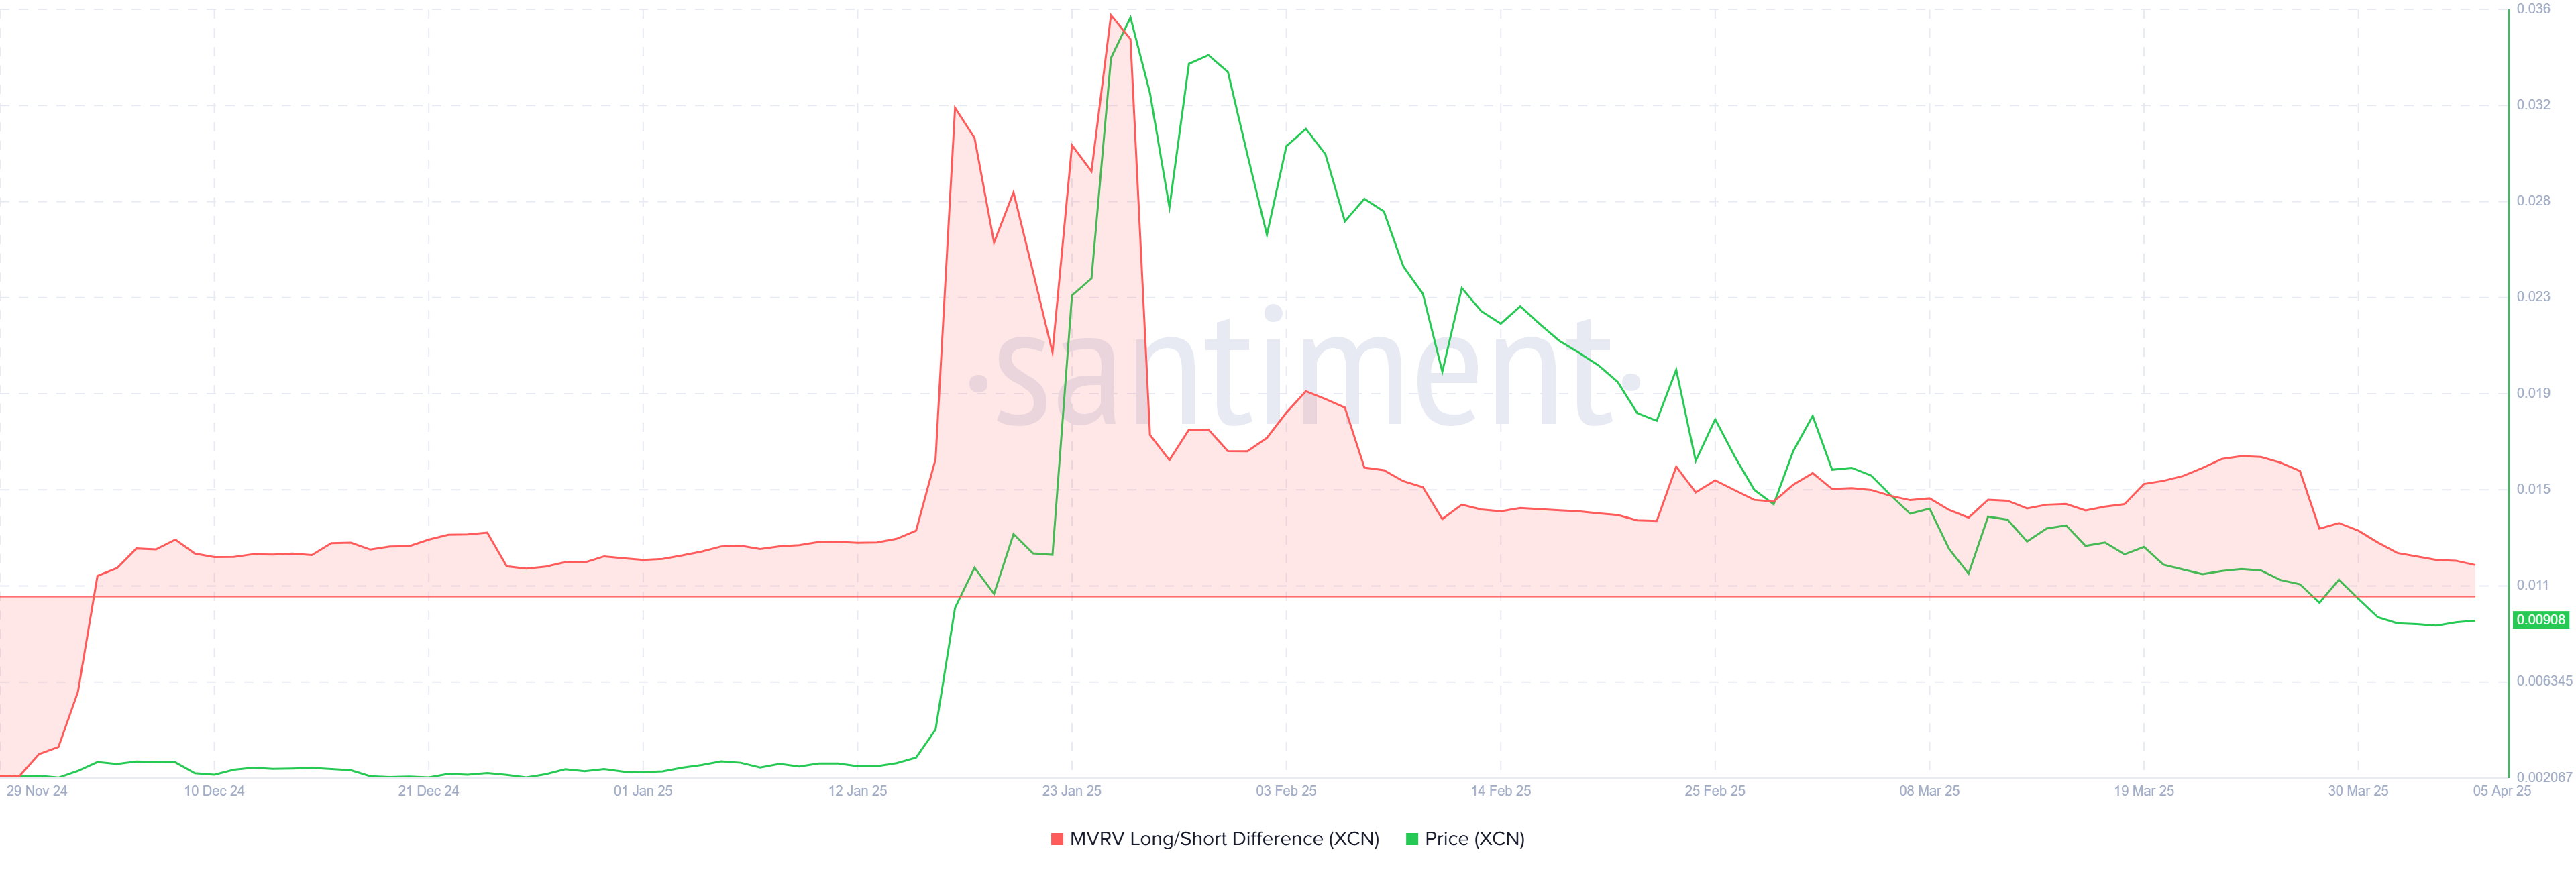
The MVRV Long/Short Difference, a key metric for understanding investor sentiment, has dropped to a 4-month low. This indicates that long-term holders (LTHs) are losing profitability, with the indicator barely above the zero line.
If this metric continues to decline and crosses into negative territory, it would suggest that short-term holders (STHs) are now the ones profiting, further fueling the bearish sentiment around Onyxcoin.
In addition, the decrease in the MVRV Long/Short Difference reflects the lack of confidence from LTHs, who have previously been the main supporters of the altcoin. As these holders become less profitable, the chances of selling pressure mounting increase, which could worsen the current downtrend.
Onyxcoin’s technical indicators are also signaling further challenges. The Exponential Moving Averages (EMAs) are nearing a Death Cross, a bearish event that occurs when the 200-day EMA crosses below the 50-day EMA. If the downtrend continues, the likelihood of this crossover becomes higher, which would indicate that selling pressure is dominating.
A Death Cross is generally viewed as a signal for further price decline and a continuation of the bearish trend. The growing concern is that if the Death Cross is confirmed, Onyxcoin could face a significant correction, potentially dropping lower.
XCN Price Continues To Fall
Onyxcoin’s price is currently sitting at $0.0090, having experienced a significant 50% decline over the last month. If the downward momentum persists, XCN could fall to the $0.0083 support level, further extending its losses.
Given the current bearish indicators, it is more likely that XCN could test lower support levels, with a potential drop to $0.0070 if the $0.0083 support fails to hold. This would mark another leg down in the altcoin’s struggle to regain upward momentum.

However, if Onyxcoin manages to reverse its trend and breach the $0.0100 barrier, it could potentially climb toward $0.0120, invalidating the bearish outlook.
This scenario would require significant buying pressure and a shift in investor sentiment, something that may become more plausible if the market conditions improve.
Disclaimer
In line with the Trust Project guidelines, this price analysis article is for informational purposes only and should not be considered financial or investment advice. BeInCrypto is committed to accurate, unbiased reporting, but market conditions are subject to change without notice. Always conduct your own research and consult with a professional before making any financial decisions. Please note that our Terms and Conditions, Privacy Policy, and Disclaimers have been updated.
Market
Ethereum Transaction Fees Hit Lowest Level Since 2020

Ethereum’s transaction fees have dropped to their lowest point over four years, marking a significant shift in on-chain activity.
The decline comes as the network faces mounting challenges, including falling market performance and weakening fundamentals.
Ethereum Faces Declining Fees and Inflation Concerns
According to IntoTheBlock, Ethereum’s total transaction fees dropped by nearly 60% in Q1 2025, falling to roughly $208 million as of April 4. The firm noted that this was their lowest level since 2020.
“Total ETH fees decreased to their lowest level since 2020 this quarter, primarily driven by the gas limit increase and transactions moving to L2s,” IntoTheBlock stated.

Several factors have contributed to this decline. The biggest driver is the adoption of Layer-2 networks, especially Coinbase’s Base. Ethereum’s Dencun upgrade, which launched in March 2024, made transactions on these scaling layers much cheaper.
As a result, more users are bypassing Ethereum’s mainnet and shifting to faster, cost-effective alternatives. According to L2Beat, Base currently processes over 80 transactions per second, leading all other Layer-2 networks.
Despite the benefits of lower fees, Ethereum’s underlying metrics are showing signs of strain.
Michael Nadeau, founder of The DeFi Report, flagged a steep drop in ETH burn rates. He noted that ETH burned through major platforms like Uniswap, Tether, MetaMask, and 1inch, which collapsed by more than 95% since November 2024.
Nadeau explained that fading retail enthusiasm and the slower-than-expected scaling from L2s are contributing to Ethereum’s reduced deflationary pressure.
“ETH’s annualized inflation is now 0.75%. We should expect it to continue to rise, exceeding BTC inflation. We should also expect Ethereum’s fundamentals to continue to erode over the next year,” he added.
Meanwhile, the network’s financial performance reflects these concerns. ETH’s price fell over 45% in Q1 2025, marking its worst quarterly performance since 2022.

In comparison to Bitcoin, Ethereum has also underperformed, losing 39% of its value against BTC this year. That drop has pushed the ETH/BTC ratio to its lowest point in nearly five years.
Still, long-term investors are not backing down. IntoTheBlock pointed out that Ethereum whales accumulated over 130,000 ETH as the price dipped below $1,800—its lowest since November 2024—signaling strong buy-the-dip sentiment.
Beyond that, industry experts believe the upcoming Pectra upgrade, scheduled for May, could give the asset a fresh start.
According to them, Pectra can help restore confidence and drive renewed growth across the Ethereum ecosystem with its improved wallet functionality and user experience.
Disclaimer
In adherence to the Trust Project guidelines, BeInCrypto is committed to unbiased, transparent reporting. This news article aims to provide accurate, timely information. However, readers are advised to verify facts independently and consult with a professional before making any decisions based on this content. Please note that our Terms and Conditions, Privacy Policy, and Disclaimers have been updated.
Market
Pi Network Hits New Low, Then Rallies 36%—What’s Next?

Pi Network has been the subject of investor frustration due to its delayed mainnet launch and lack of Binance listing. Amidst all this, the token recently hit a new low before recovering sharply.
After a significant decline, the altcoin has surged by 36%, leaving investors to wonder if this marks the beginning of a reversal.
Pi Network Investors Are Optimistic
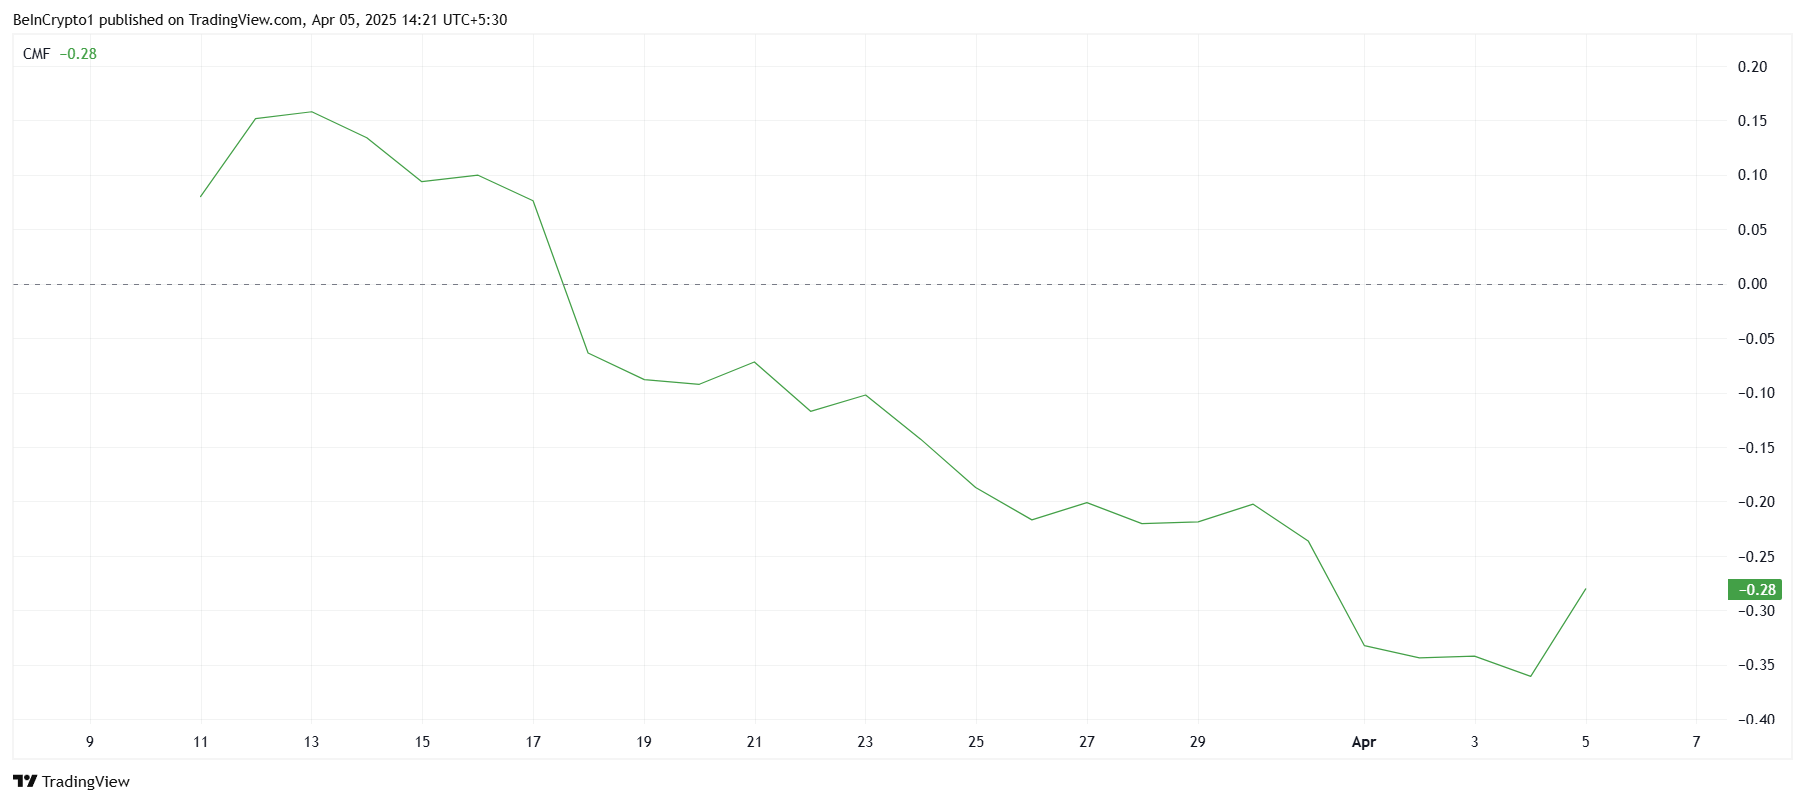
The Chaikin Money Flow (CMF) indicator is showing an uptick, signaling positive inflows into Pi Network at the time of writing. This shift suggests that investor confidence is returning, likely due to the altcoin hitting what seems to be its market bottom. With market conditions expected to improve, Pi Network appears to be positioned for a potential rally, with investors looking to capitalize on its current price.
Owing to the prolonged downtrend, these positive inflows indicate that market sentiment may be shifting. Investors who were previously hesitant may now be more willing to re-enter the market and seek profit.
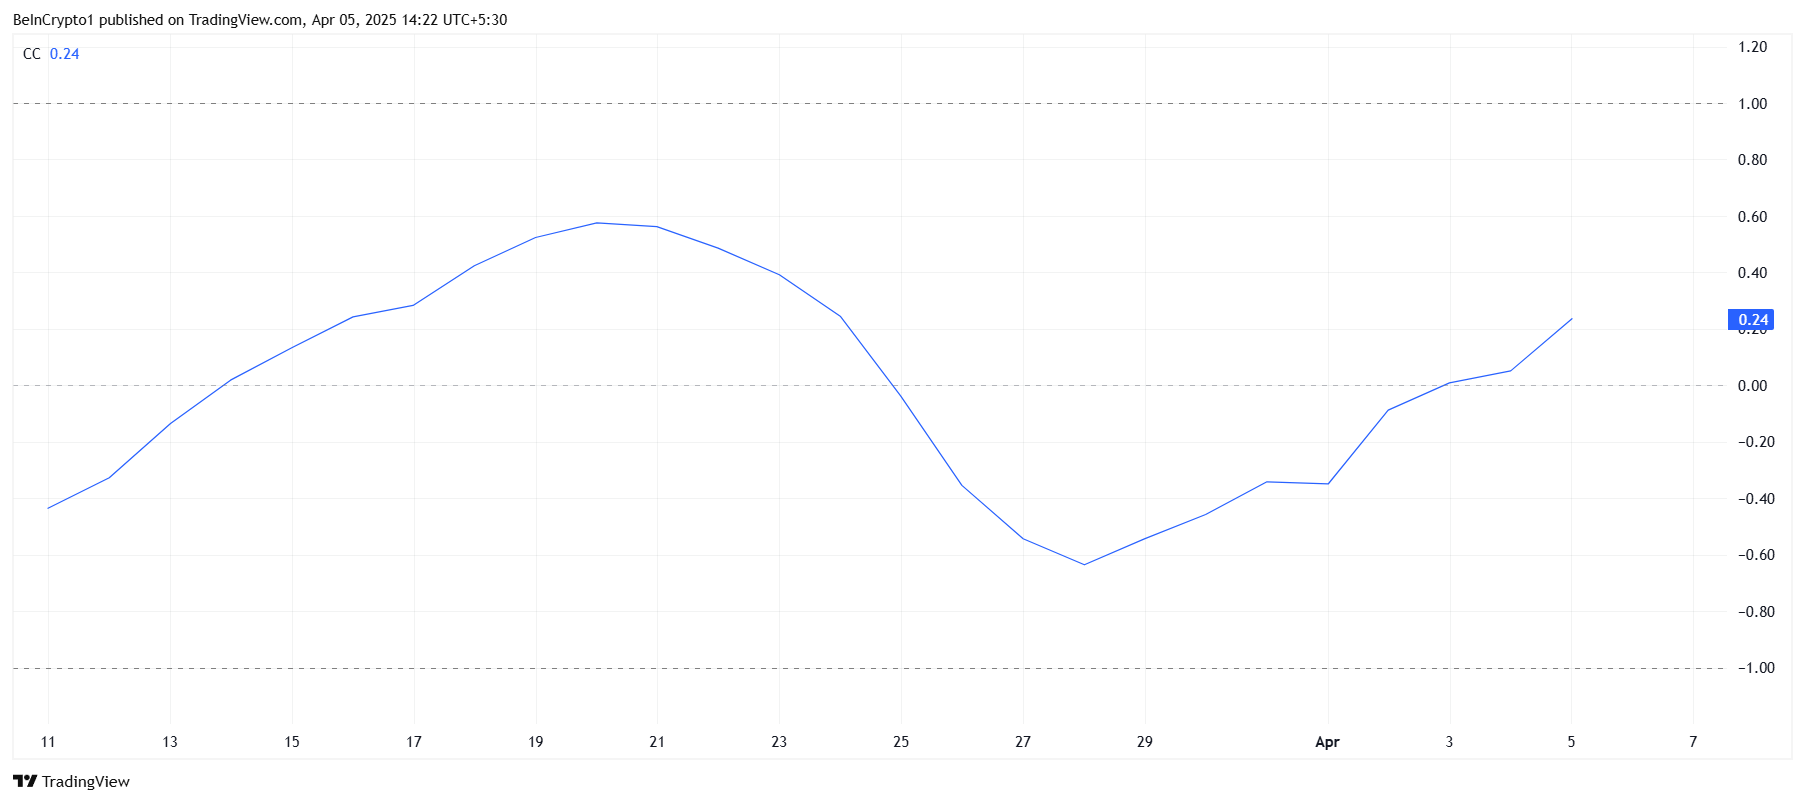
Pi Network’s correlation with Bitcoin has also shown signs of improvement, with the current correlation at 0.24. Although still low, this improvement suggests that Pi Network may begin to follow Bitcoin’s price movements. If Bitcoin experiences a significant rally, Pi Network could follow suit, benefiting from the broader market’s bullish momentum.
This increasing correlation could be crucial for Pi Network, as it indicates a stronger alignment with the larger crypto market. If Bitcoin’s price begins to surge, Pi Network’s recovery could gain additional momentum.
PI Price Is Bouncing Back
Pi Network’s price fell to a new all-time low of $0.40 during an intra-day low, marking a significant dip for the token. However, it quickly recovered, posting a 36% gain and reaching an intra-day high of $0.71.
This price movement shows that the altcoin is capable of rapid reversals, but it remains to be seen if this momentum will continue.
Given the positive indicators, Pi Network may continue its upward trajectory, potentially reaching the $0.87 level and even $1.00. These price points would represent a substantial recovery from its recent lows and may help restore investor confidence in the altcoin’s long-term viability.
However, the key factor will be whether it can maintain its upward movement.
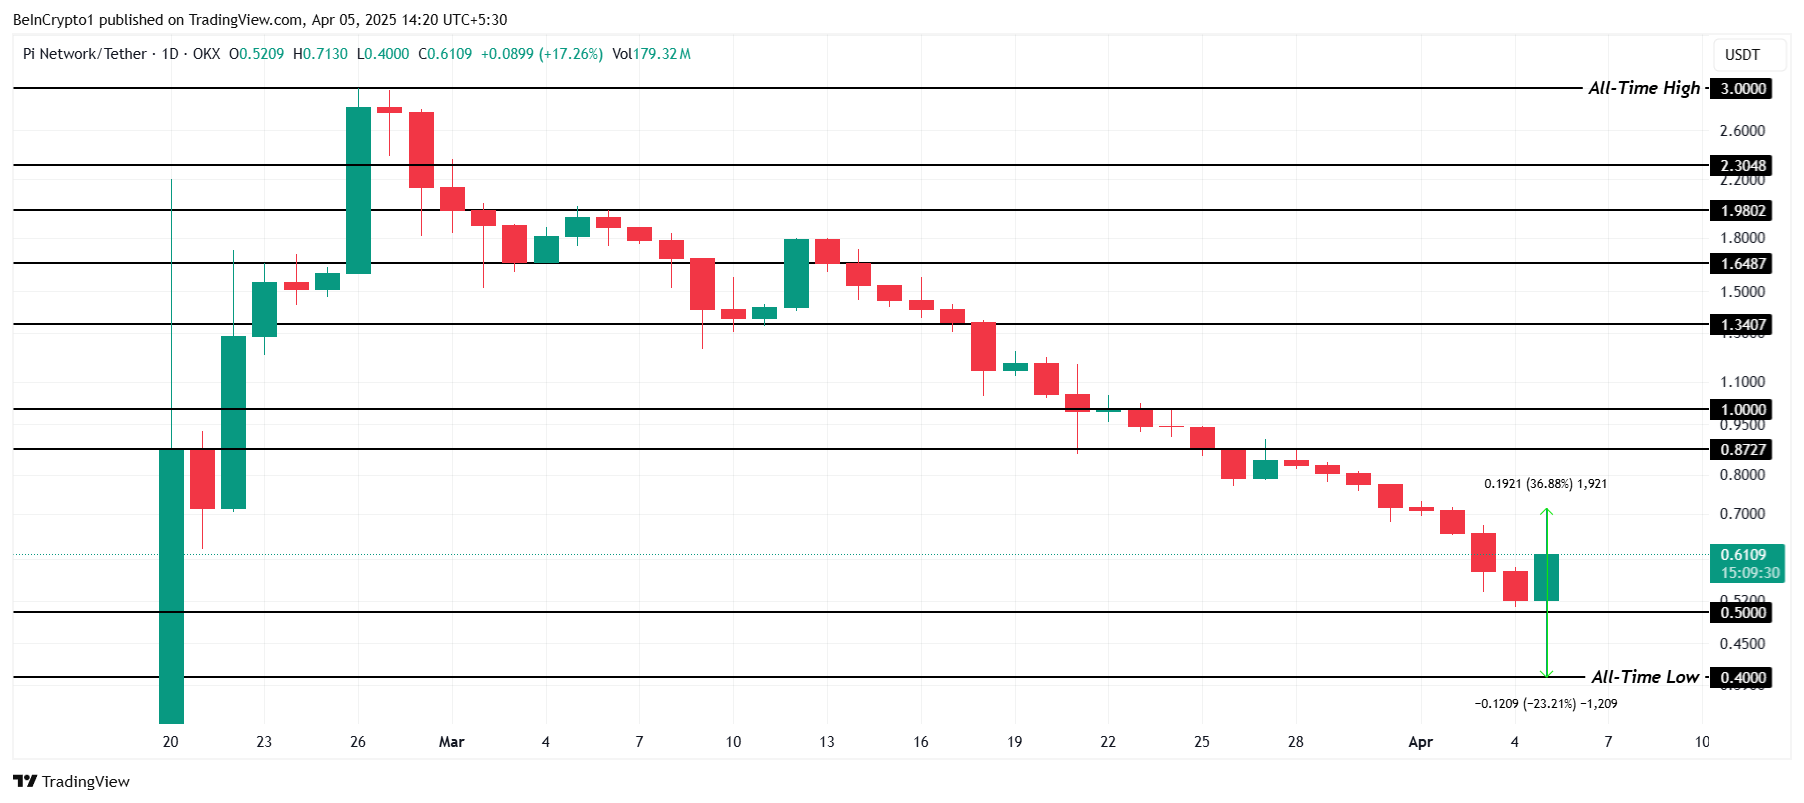
On the other hand, if bearish signals persist and Pi Network loses the support of $0.50, the altcoin may fall back to $0.40 or lower, invalidating the current bullish outlook. This scenario could bring further declines, extending the downtrend that investors have been watching closely.
Disclaimer
In line with the Trust Project guidelines, this price analysis article is for informational purposes only and should not be considered financial or investment advice. BeInCrypto is committed to accurate, unbiased reporting, but market conditions are subject to change without notice. Always conduct your own research and consult with a professional before making any financial decisions. Please note that our Terms and Conditions, Privacy Policy, and Disclaimers have been updated.
-

 Market22 hours ago
XRP Price Vulnerable To Falling Below $2 After 18% Decline
-

 Bitcoin24 hours ago
Why Bitcoin Is Gaining Appeal Amid Falling US Treasury Yields
-
 Altcoin16 hours ago
Analyst Predicts XRP Price To Reach Double Digits By July 21 Cycle Peak
-

 Market21 hours ago
Will the SEC Approve Grayscale’s Solana ETF?
-

 Ethereum20 hours ago
Ethereum Whales Buy the Dip – Over 130K ETH Added In A Single Day
-

 Bitcoin19 hours ago
Vitalik’s L2 Roadmap, XRP Unlock and More
-
 Altcoin17 hours ago
Pi Network Under Fire As PiDaoSwap Launches NFTs On Binance Chain
-

 Market16 hours ago
Why Analysts Believe Q2 is a Great Opportunity to Buy Altcoins


