
Market
HBAR Foundation Eyes TikTok, Price Rally To $0.20 Possible
Hedera (HBAR) has faced a downtrend recently, with the crypto asset’s price failing to maintain support at $0.200. This failure to establish a solid base has led to a pullback.
However, key developments within the Hedera ecosystem and shifting investor sentiment could spark a potential price rally in the coming days.
HBAR Foundation Eyes TikTok
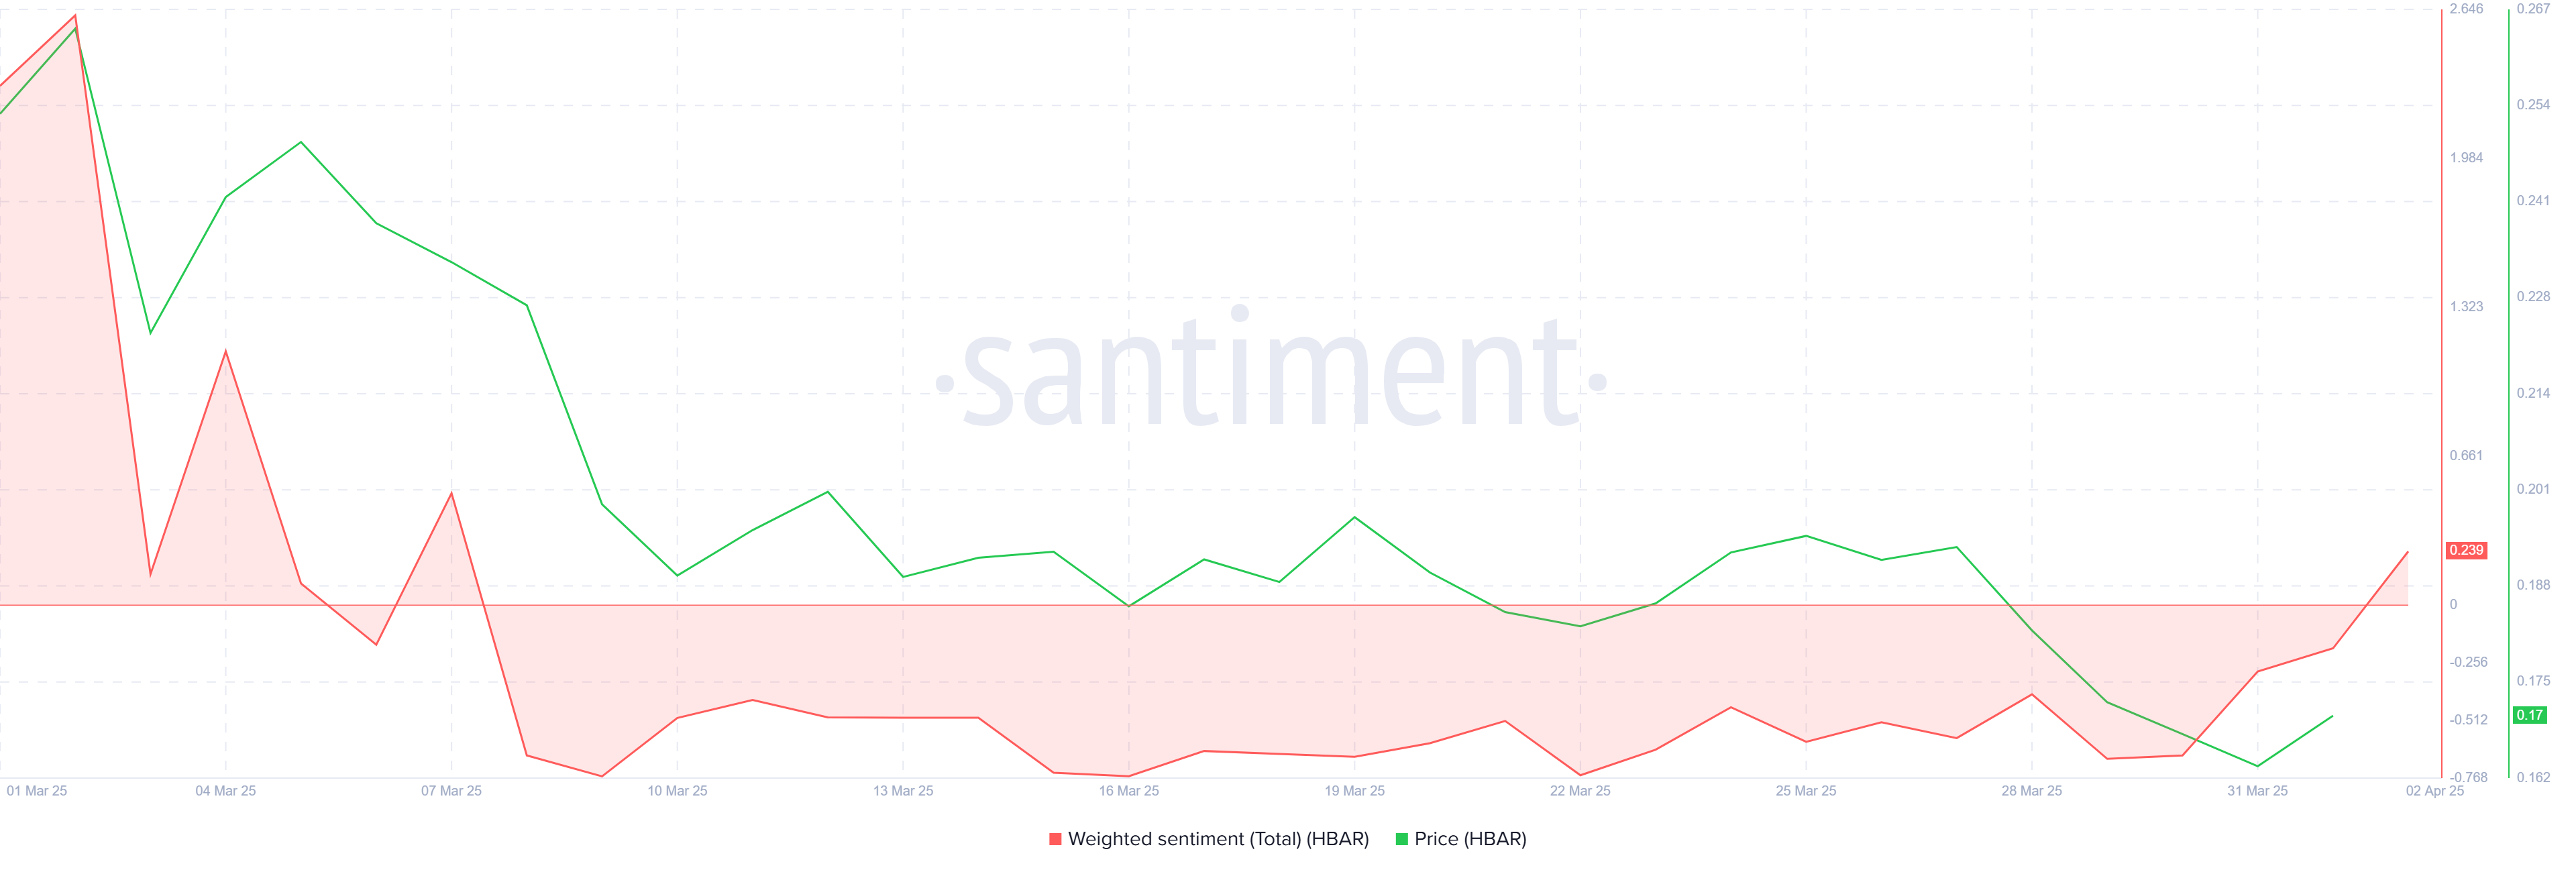
After nearly a month of bearish sentiment, investors are beginning to shift their stance towards bullishness. The Hedera Foundation’s recent move to team up with Zoopto for a late-stage bid to acquire TikTok has played a pivotal role in this shift. If the acquisition is approved, the partnership could expose HBAR to a massive audience due to TikTok’s extensive user base, potentially driving up demand and mainstream adoption.
The prospect of this collaboration has reignited interest among investors, sparking optimism about Hedera’s future growth potential. With TikTok’s wide-reaching influence, the strategic partnership could offer Hedera an edge in the competitive crypto market, encouraging further accumulation of HBAR tokens.
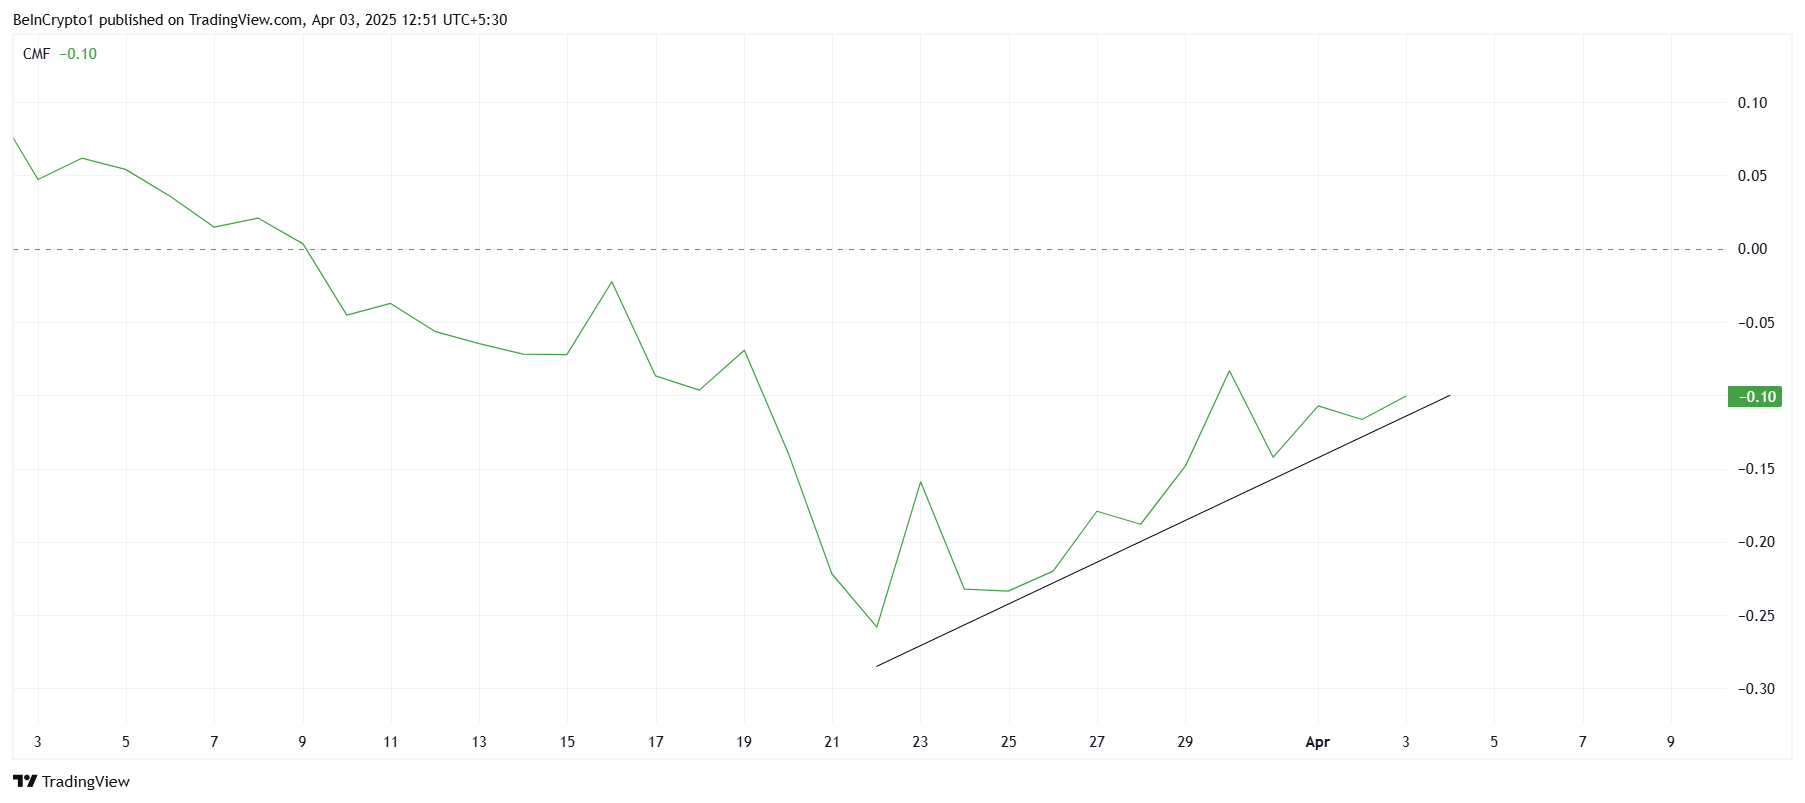
On the technical front, the Chaikin Money Flow (CMF) indicator is showing signs of recovery. The CMF has started to tick upwards, signaling a potential increase in inflows. While it hasn’t yet crossed above the zero line, the growing positive momentum indicates that more capital could be entering the market. Continued inflows could provide the necessary push for HBAR to break through key resistance levels.
The increase in capital flow suggests a strengthening of investor confidence. However, for a sustained rally, more substantial buying pressure will be required to move HBAR above its current price point. If this trend continues, HBAR may see a rise in both investor interest and market value in the near future.
HBAR Price Finds Support
Currently, HBAR is priced at $0.161, just under the key resistance level of $0.165. The next significant resistance lies at $0.197, which has acted as a barrier to HBAR’s price recovery. With a 22% gap between the current price and this resistance, overcoming this hurdle could pave the way for a move toward $0.200.
Given the positive developments surrounding Hedera, it is plausible that HBAR could move toward these resistance levels. If the token can breach $0.165 and then $0.177, the path to $0.197 becomes much clearer. This would mark a critical point for HBAR as it seeks to regain lost ground.
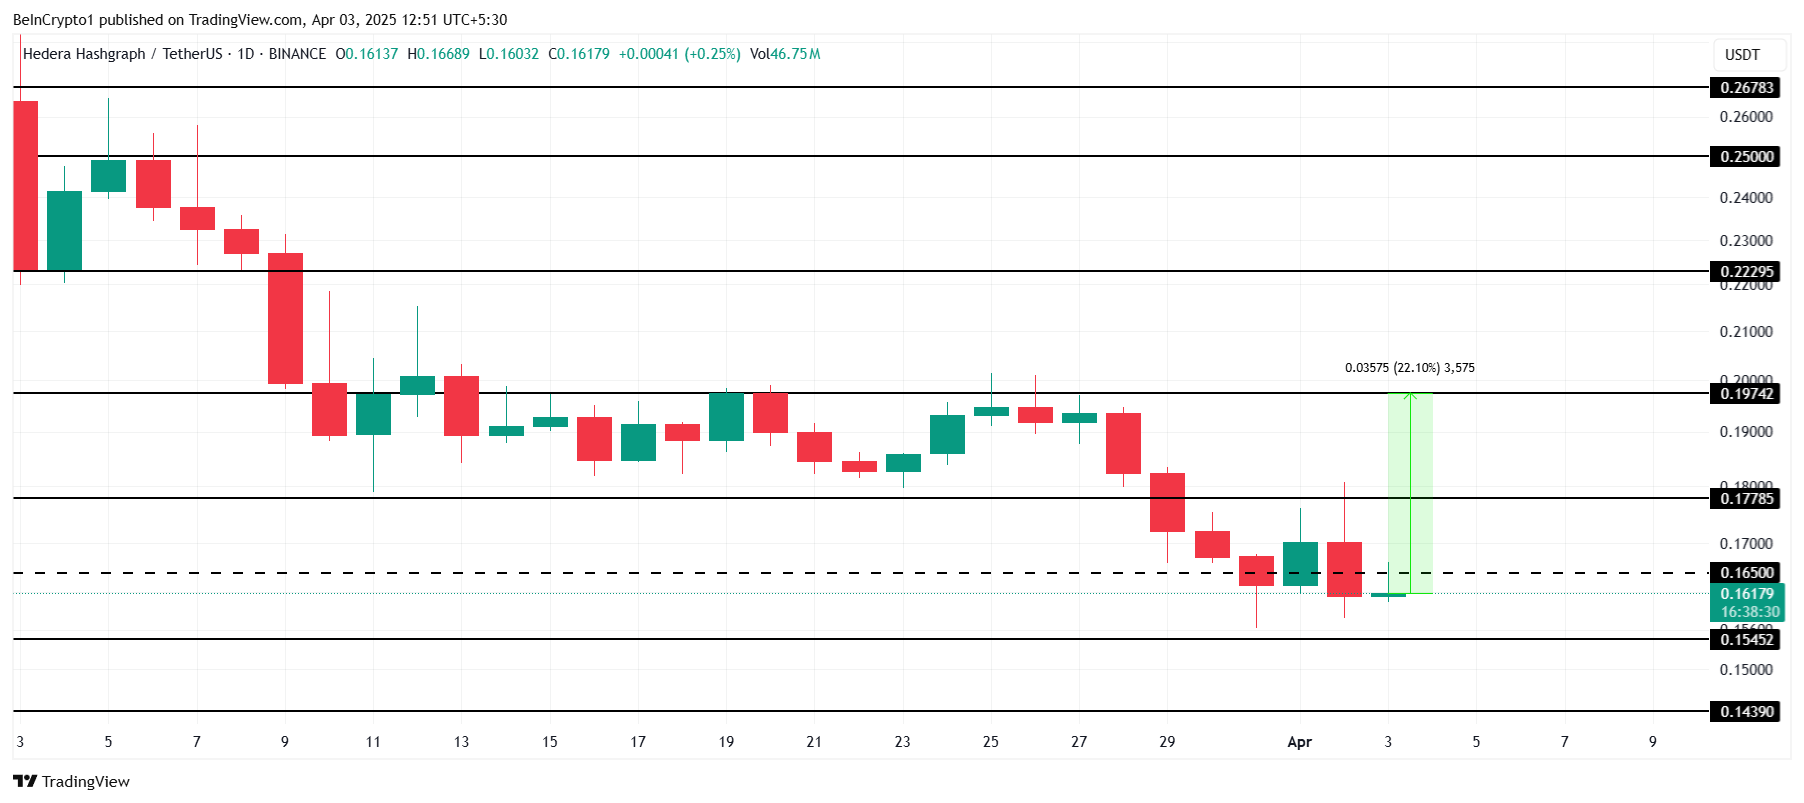
However, if investors decide to take profits and sell before further upward movement, HBAR could fail to breach the $0.177 resistance. Such a scenario could push the price back down towards $0.154 or $0.143, invalidating the bullish outlook and prolonging the consolidation phase.
Disclaimer
In line with the Trust Project guidelines, this price analysis article is for informational purposes only and should not be considered financial or investment advice. BeInCrypto is committed to accurate, unbiased reporting, but market conditions are subject to change without notice. Always conduct your own research and consult with a professional before making any financial decisions. Please note that our Terms and Conditions, Privacy Policy, and Disclaimers have been updated.


Solana (SOL) has recovered over 12% today after Trump announced a 90-day pause on tariffs. Despite the significant recovery, technical indicators continue flashing bearish warnings. Key indicators like the RSI, BBTrend, and EMA lines all point to weakening momentum and a lack of buyer conviction. While oversold conditions have started to stabilize, the broader structure still leans slightly in favor of sellers.
Solana RSI Shows The Lack Of Conviction Among Buyers
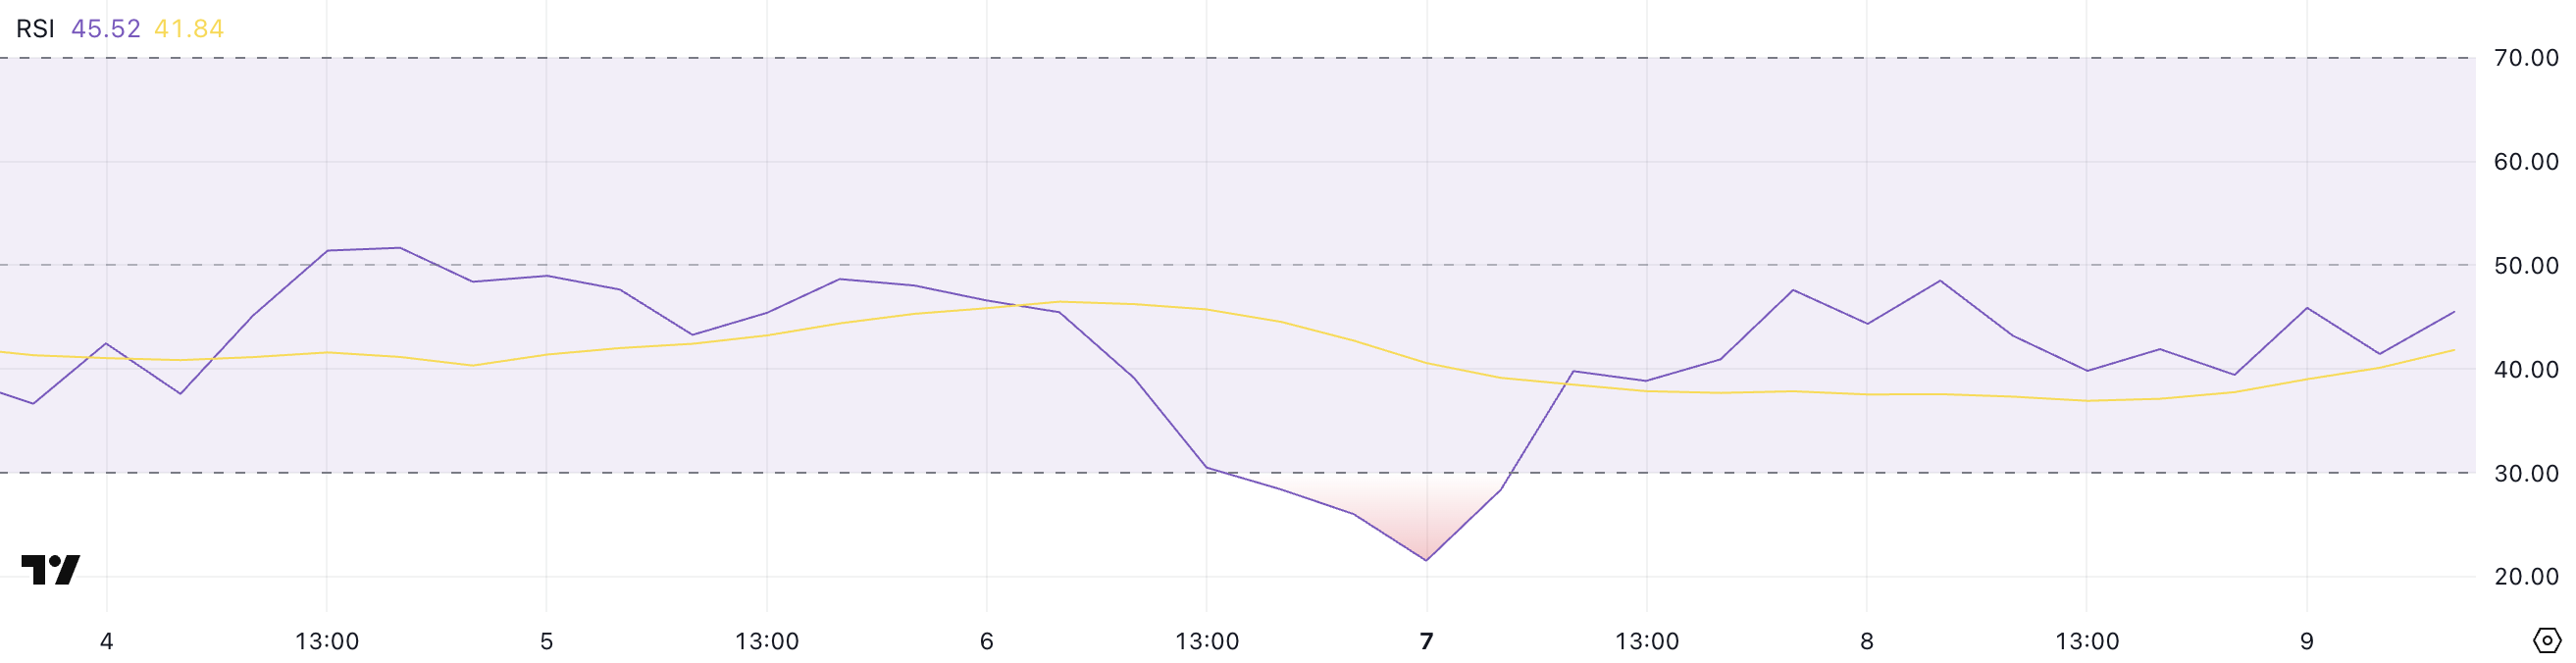
Solana’s Relative Strength Index (RSI) is currently sitting at 45.52, hovering in neutral territory but remaining below the midline of 50 for nearly two days.
This comes after the RSI briefly dipped to an oversold level of 21.53 two days ago, indicating that sellers had briefly dominated before demand began to stabilize.
The RSI’s slow climb back toward neutral suggests that while extreme selling pressure has eased, bullish momentum has not yet taken control.
The RSI is a momentum oscillator that measures the speed and magnitude of recent price movements. It typically ranges from 0 to 100.
Readings above 70 are generally interpreted as overbought, signaling the potential for a pullback, while readings below 30 suggest oversold conditions and potential for a rebound.
Solana’s RSI at 45.52 indicates that the asset is in a recovery phase but lacks conviction. If the RSI fails to cross above 50 soon, it could imply continued hesitation among buyers and the potential for sideways price action or even another leg lower.
SOL BBTrend Has Reached Its Lowest Levels In Almost A Month
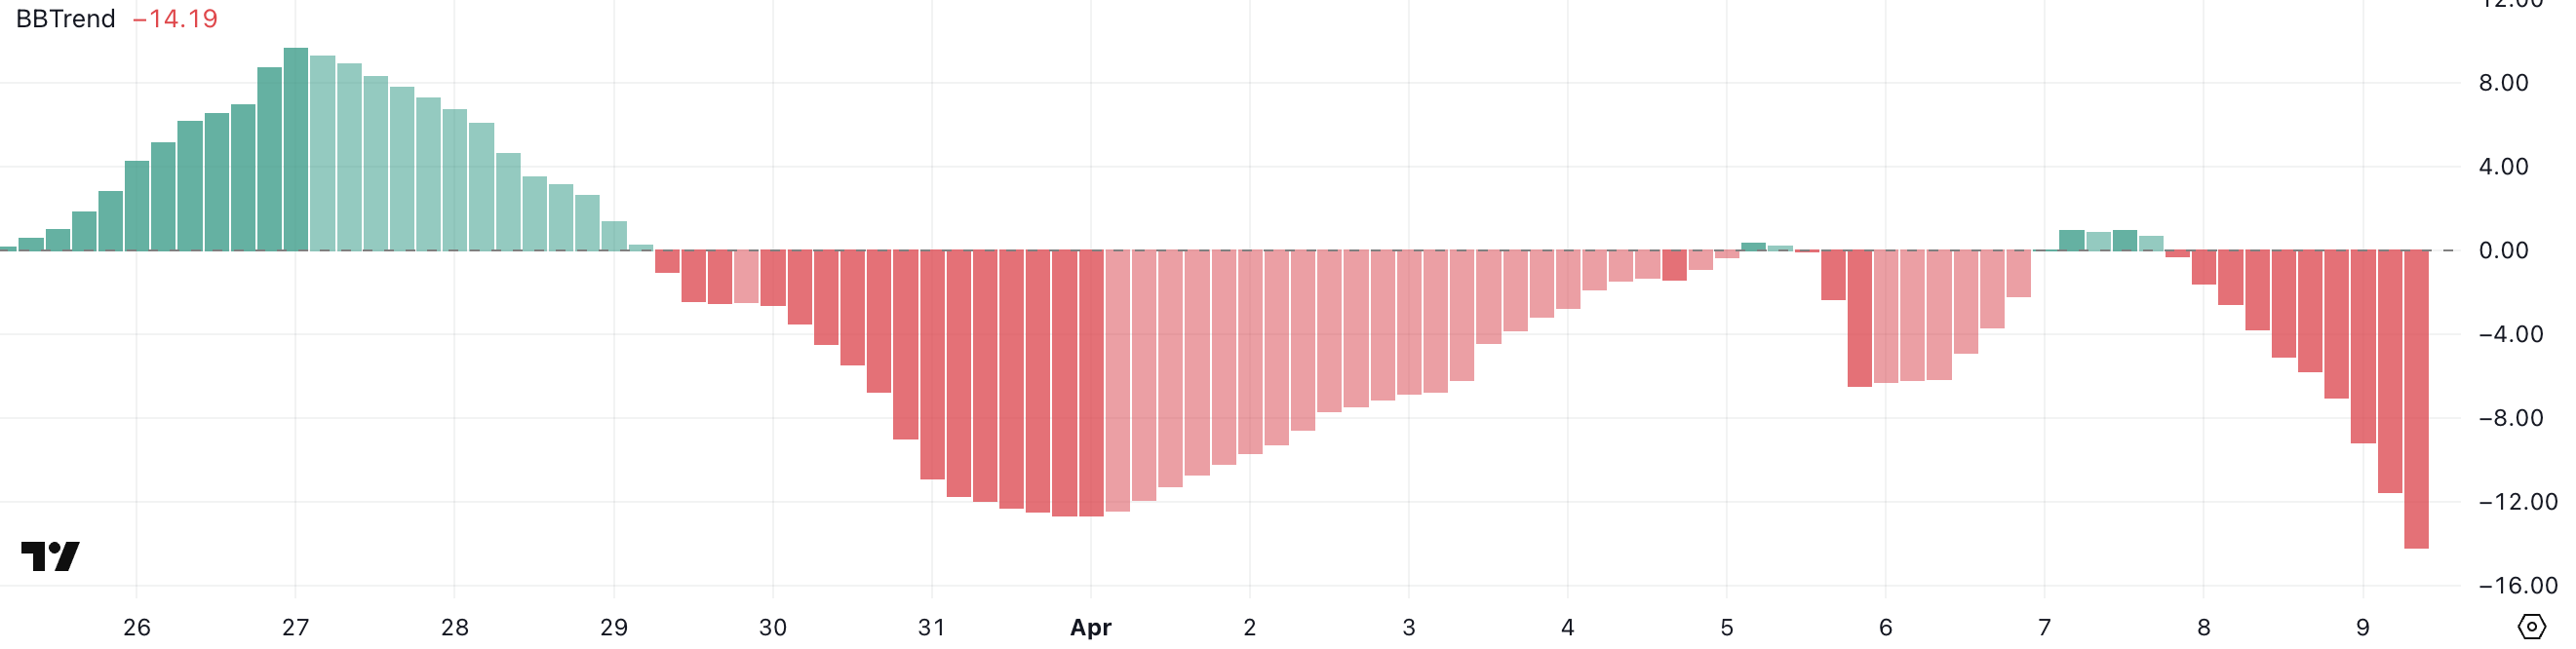
Solana’s BBTrend indicator is currently at -14.19, having turned negative since yesterday, and is at its lowest level since March 13—nearly a month ago.
This shift into deeper negative territory suggests that bearish momentum is building once again after a period of relative stability.
The return to these levels may indicate growing downside pressure, especially if follow-through selling continues in the short term.
The BBTrend (Bollinger Band Trend) is a volatility-based indicator that measures the strength and direction of a price trend using the distance between price and Bollinger Bands.
Positive BBTrend values generally reflect bullish momentum, while negative values signal bearish momentum. The deeper the reading into negative territory, the stronger the downward pressure is considered to be.
Solana’s BBTrend is now at -14.19, implying an intensifying bearish phase, which could mean further price declines unless sentiment or volume shifts quickly in favor of buyers.
Will Solana Dip Below $100 Again In April?
Solana’s EMA setup continues to reflect a strong bearish structure, with short-term moving averages remaining well below long-term ones.
This alignment confirms that downward momentum is still in control, keeping sellers in a dominant position.
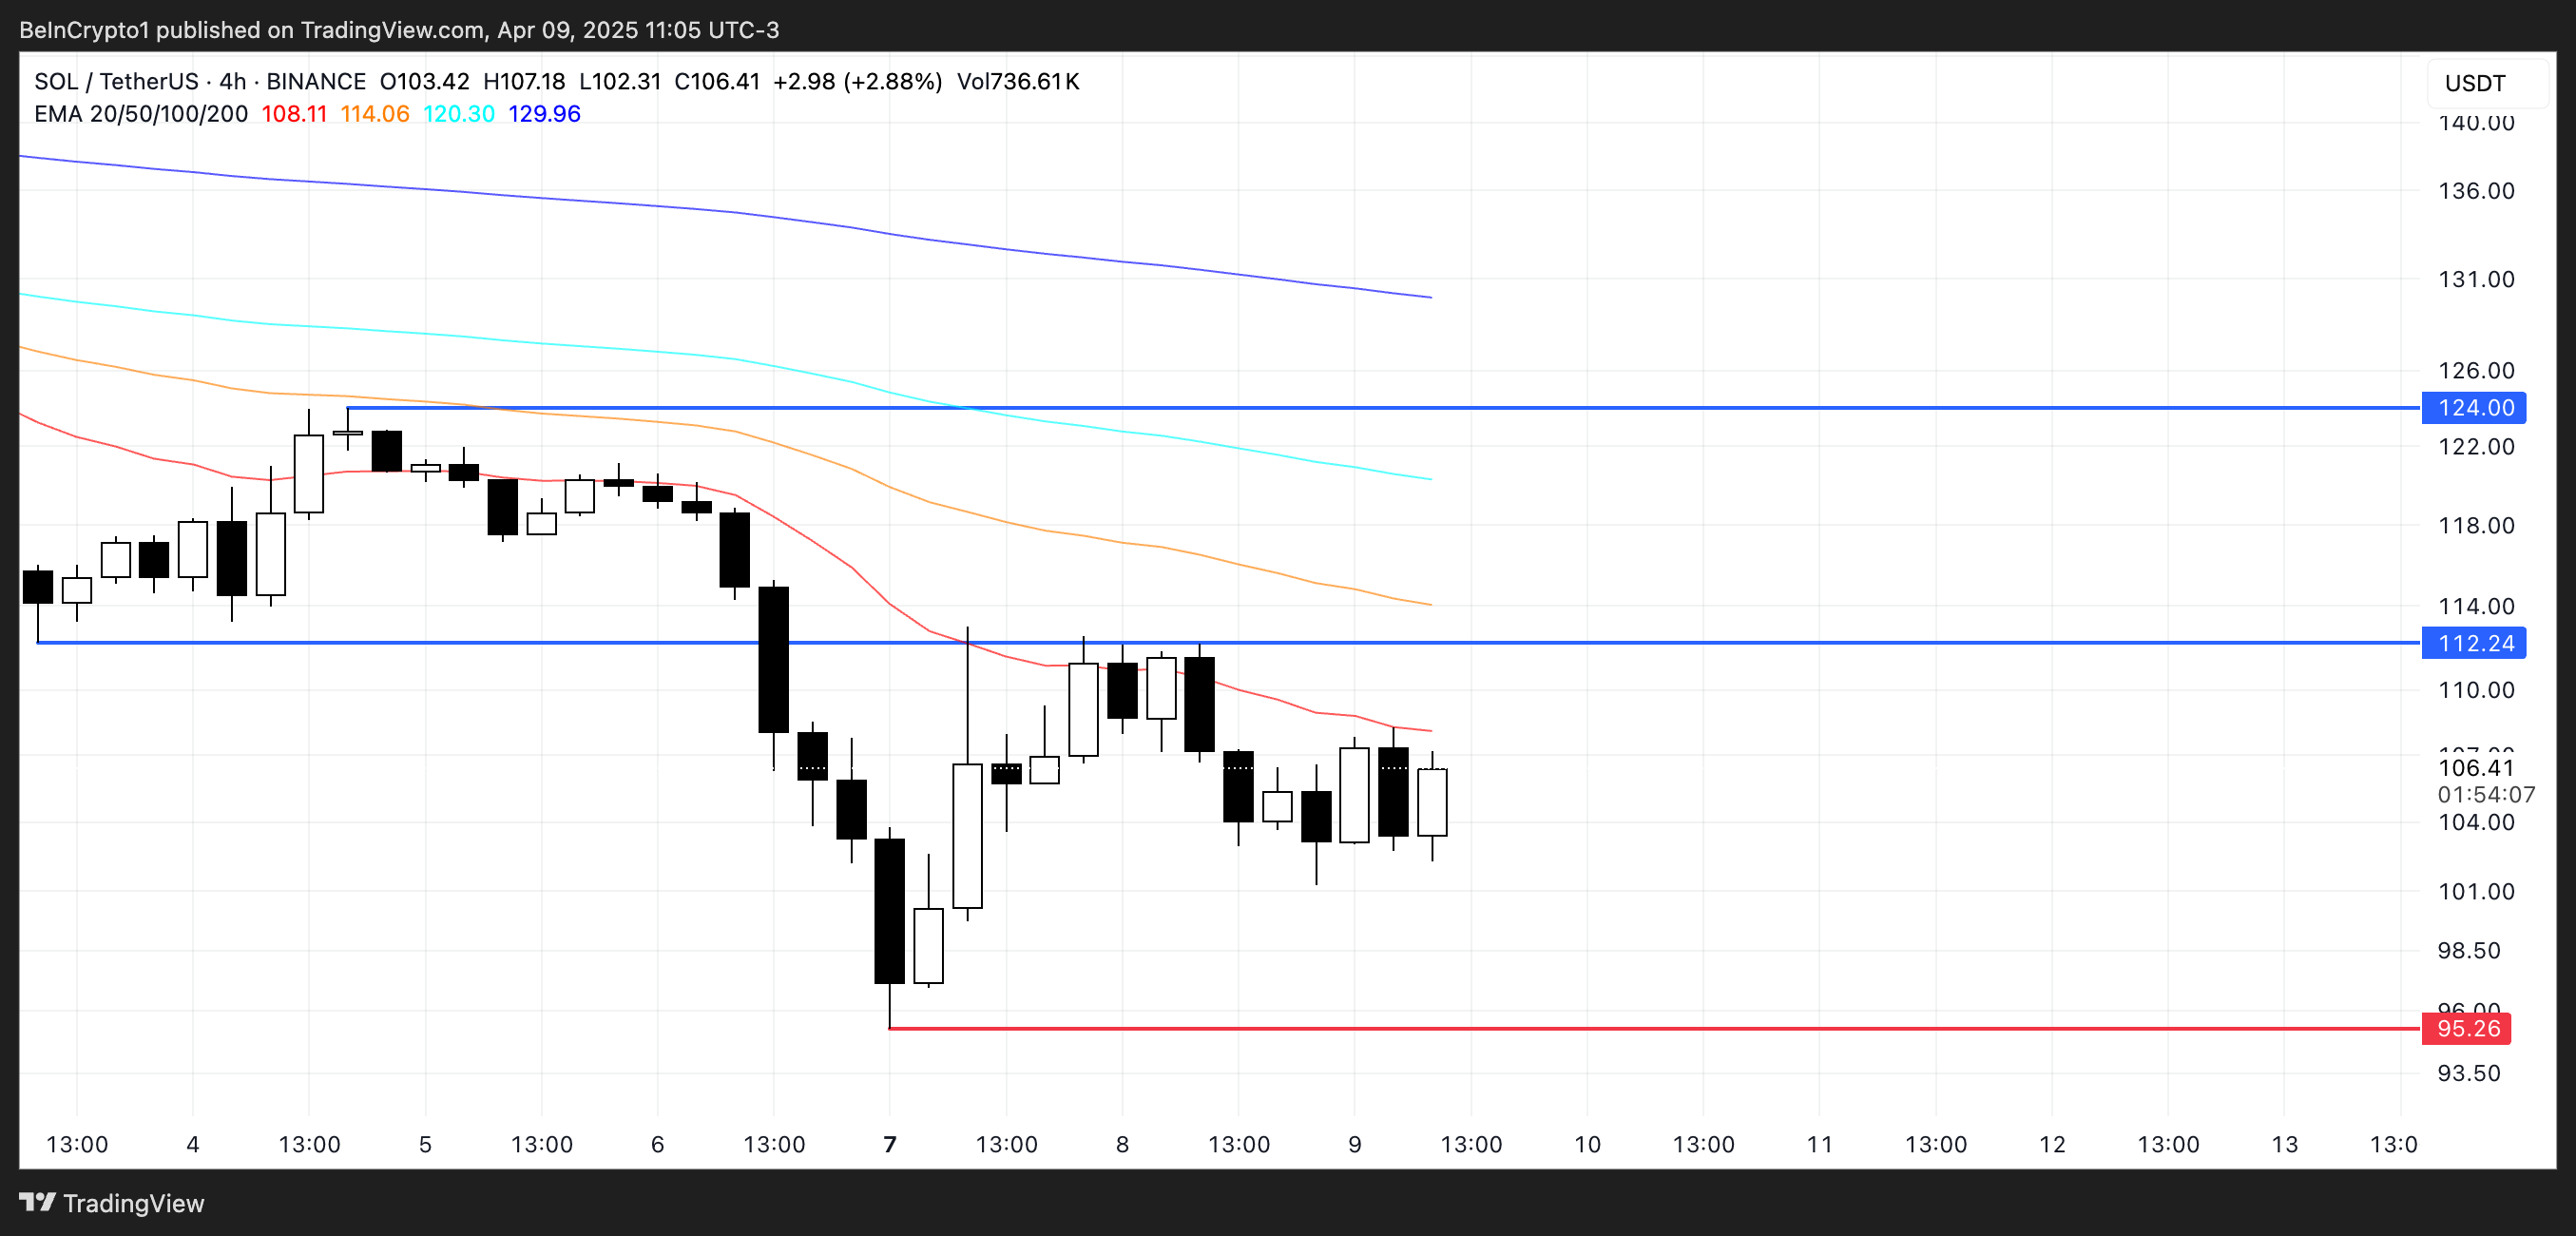
However, if Solana price manages to sustain the current strength and buying interest, it could test resistance at $120. A break above that level may open the path toward the next target at $134.
On the downside, if the current bearish trend persists, Solana could revisit support near $95, a level that has previously acted as a short-term floor.
Losing this level would be technically significant, potentially pushing SOL below $90—territory not seen since January 2024.
Disclaimer
In line with the Trust Project guidelines, this price analysis article is for informational purposes only and should not be considered financial or investment advice. BeInCrypto is committed to accurate, unbiased reporting, but market conditions are subject to change without notice. Always conduct your own research and consult with a professional before making any financial decisions. Please note that our Terms and Conditions, Privacy Policy, and Disclaimers have been updated.


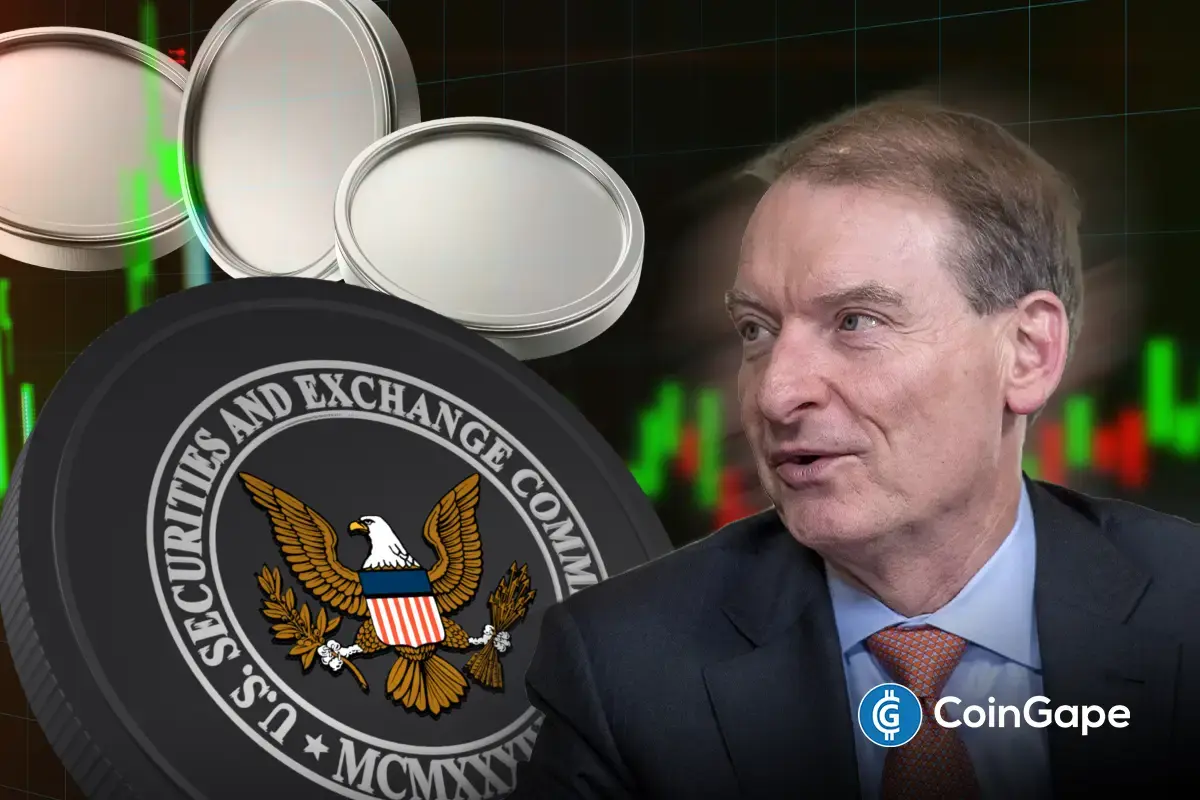
The US Senate has confirmed Paul Atkins as the new chair of the Securities and Exchange Commission. Senators approved the appointment on Wednesday with a 52-44 vote.
Atkins is expected to shift the agency’s approach to financial oversight. He plans to ease regulatory requirements, scale back corporate disclosure rules, and continue the commission’s new pro-crypto stance.
SEC Has a Pro-Crypto Chair
Since last week’s Senate hearing, there have been some doubts about Paul Atkins’ appointment. This was largely due to his significant crypto exposure as an investment leader.
However, the Senate has decided today with a tight vote.
The leadership change follows a period of major transition at the agency. Mark Uyeda, who served as acting chair after Gensler’s departure, launched a fast-paced overhaul of crypto policy.
“Confirmed, 52-44: Confirmation of Executive Calendar #61 Paul Atkins to be a Member of the Securities and Exchange Commission for the remainder of the term expiring June 5, 2026,” wrote the Senate Cloakroom.
Under Uyeda, the SEC dismissed several major enforcement actions tied to digital assets. The agency also declared that certain crypto sectors — including stablecoins, proof-of-work mining, and meme coins fall outside its jurisdiction.
Some of these areas have financial links to the Trump family. Their ventures include meme coin projects and connections to World Liberty Financial, a firm backing its own stablecoin.
Atkins is expected to formalize these regulatory shifts and oversee any new standards that may follow from pending legislation.
“Atkins may have made history tonight as the first SEC commissioner to get confirmed by the Senate three times. Once in 2002, then again in 2003, and now in 2025,” wrote Eleanor Terrett.
The SEC has already begun loosening several other rules. Uyeda delayed implementation deadlines for policies introduced during Gensler’s term.
He also revised rules on shareholder proposals, making it harder for activists to force issues onto corporate ballots.
The agency withdrew its defense of rules that required companies to disclose climate-related risks and emissions.
Atkins will take over a smaller agency. Around 500 staff have accepted voluntary resignations or buyouts. This has been part of the Trump administration’s broader effort to shrink federal agencies.
Disclaimer
In adherence to the Trust Project guidelines, BeInCrypto is committed to unbiased, transparent reporting. This news article aims to provide accurate, timely information. However, readers are advised to verify facts independently and consult with a professional before making any decisions based on this content. Please note that our Terms and Conditions, Privacy Policy, and Disclaimers have been updated.
XRP’s recent recovery has sparked fresh optimism among traders, but what’s happening behind the scenes tells an even more compelling story. This isn’t just a typical bounce; the charts reveal a calculated shift in momentum. Technical indicators like the Relative Strength Index (RSI) and Moving Average Convergence Divergence (MACD) are beginning to align, suggesting that XRP is approaching a crucial decision zone.
Following the recent downturn in the market, the price is now on a bullish recovery after testing the $1.7 key support level with increasing conviction. If the current momentum continues and resistance zones give way, XRP could be on the verge of a significant breakout. However, failure to build on this momentum could trap the token in another consolidation phase or a deeper retracement.
MACD Signals Brewing Bullish Pressure For XRP
In a recent post on X, crypto analyst Javon Marks pointed out that XRP’s MACD is approaching a critical breaking point, potentially signaling a shift in market momentum. He emphasized that this MACD indicator is showing signs of a bullish crossover, which could mark the start of a strong upward movement.
Coupled with this, Marks highlighted that XRP is currently holding a key Regular Bullish Divergence, where the price has been making lower lows while the MACD is showing higher lows. This indicates a weakening of bearish pressure, setting the stage for a potential reversal.
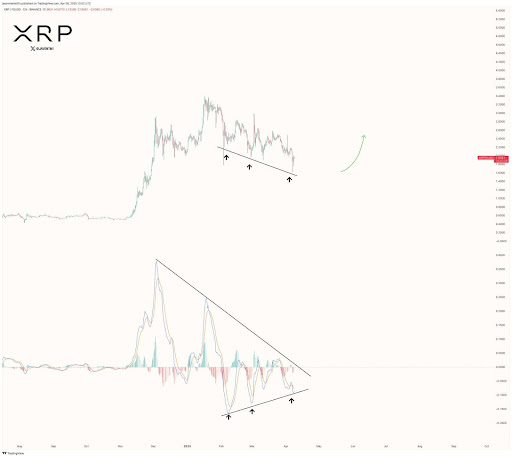
Marks suggested that this technical setup could be the catalyst for the bulls to take control, potentially leading to a powerful move that breaks through current resistance levels. With this convergence of bullish signals, XRP may be primed for a rally back toward the $3.30+ range, continuing its previous uptrend.
Key Levels to Watch: The Exact Breakout And Rejection Zones That Matter
In order to fully understand the future movements of XRP, it’s crucial to pinpoint the key levels that will either drive the price higher or cause a reversal. Firstly, the breakout zone for the altcoin lies around the $1.97 resistance level.
If the price manages to surpass this threshold with strong volume, it could trigger a surge towards higher levels, including $2.64 and $2.92. This breakout would likely confirm the upward momentum suggested by the MACD and the regular bullish divergence.
On the other hand, a rejection at the $1.97 resistance level might signal a lack of buying interest. Should the asst fail to break above this level, the price could pull back toward lower support levels like $1.7 or even $1.34. A failure to hold these support levels would trigger the potential for a more substantial downturn, with bears regaining control.

Argentina Opens LIBRA Investigation, Top Officials May Be Implicated

Solana (SOL) Drops 4% as Selling Pressure Intensifies

Paul Atkins Confirmed as SEC Chair, Crypto Rules to Ease
US Senate Confirms Pro-Crypto Paul Atkins As SEC Chair

XRP Primed for a Comeback as Key Technical Signal Hints at Explosive Move
MicroStrategy Bitcoin Dump Rumors Circulate After SEC Filing

2.52 Million Altcoins Are Ruining Crypto’s Future

Animoca Brands Valuation Tanks 75% In Two Years, Here’s Why

Crypto exchange BingX hacked for $43 million

Are The Big Players Losing Interest?

Hong Kong’s Securities Association Tips Authorities On Crypto Self-Regulation

Coinbase cbBTC Set to go Live on Solana
2.52 Million Altcoins Are Ruining Crypto’s Future
Animoca Brands Valuation Tanks 75% In Two Years, Here’s Why
Crypto exchange BingX hacked for $43 million
Are The Big Players Losing Interest?
Hong Kong’s Securities Association Tips Authorities On Crypto Self-Regulation
Coinbase cbBTC Set to go Live on Solana
-

 Market24 hours ago
Berachain Drops 47% in a Month as Bearish Signals Grow
-
 Bitcoin20 hours ago
How Trump’s Tariffs Threaten Bitcoin Mining in the US
-
 Altcoin19 hours ago
Shiba Inu Burn Rate Shoots Up 1500%, Can SHIB Price Recover After Bloodbath?
-

 Bitcoin24 hours ago
Bitcoin Crashes Below $75,000 As Asian Stock Markets Bleed
-
 Market16 hours ago
XRP Price Warning Signs Flash—Fresh Selloff May Be Around the Corner
-
 Altcoin16 hours ago
Binance To Delist These 7 Crypto Pairs Amid Market Turmoil, Are Prices At Risk?
-

 Market23 hours ago
Bitcoin Price Takes Another Tumble—Is The Floor About to Crack?
-
 Bitcoin16 hours ago
Why Bitcoin’s Value Could Benefit from Trade War, Analyst Explains