
Market
FDIC and CFTC Rescind Old Crypto Guidelines


The FDIC and CFTC have both been working to change previous crypto guidelines. As federal regulators reconcile with the industry, they are removing old rules that specifically target crypto.
The former institution is removing the requirement that banks report crypto business, while the latter holds crypto to the same standards as other industries.
FDIC and CFTC Change Crypto Policies
The FDIC is one of the top financial regulators in the US, and it’s turning over a new leaf. After being one of the principal architects of Operation Choke Point 2.0, it recently began declassifying documents and changing rules that allowed crypto debanking.
Today, the agency is revoking a 2022 directive that impacted banks’ interactions with crypto:
“With today’s action, the FDIC is turning the page on the flawed approach of the past three years. I expect this to be one of several steps the FDIC will take to lay out a new approach for how banks can engage in crypto- and blockchain-related activities in accordance with safety and soundness standards,” said FDIC Acting Chairman Travis Hill.
Specifically, it rescinded a rule that mandated that all banks and institutions under its supervision notify the FDIC of any crypto involvement. The new guideline claims that banks “may engage in permissible crypto-related activities without receiving prior FDIC approval” without enacting any other policies.
Since Gary Gensler left the SEC, all the top US financial regulators have been trying to rework their relationship with crypto. In an apparent coincidence, the CFTC made a very similar move to the FDIC by rescinding two crypto guidelines.
Both of these actions did not establish a new policy; they merely removed the old ones.
Essentially, both of the CFTC’s rule changes are set to ensure that crypto-related derivatives are subject to the same requirements as non-crypto ones. This is somewhat surprising, considering that the industry has typically tried to insist that it necessitates specific regulations.
However, this is largely beside the point. The FDIC and CFTC are both working to remove previous guidelines that opposed the crypto industry.
These institutions will undoubtedly be amenable to creating new ones in the spirit of cooperation. In the meantime, this olive branch can help build a lot of goodwill.
Disclaimer
In adherence to the Trust Project guidelines, BeInCrypto is committed to unbiased, transparent reporting. This news article aims to provide accurate, timely information. However, readers are advised to verify facts independently and consult with a professional before making any decisions based on this content. Please note that our Terms and Conditions, Privacy Policy, and Disclaimers have been updated.


Reason to trust
![]()
Strict editorial policy that focuses on accuracy, relevance, and impartiality
Created by industry experts and meticulously reviewed
The highest standards in reporting and publishing
Strict editorial policy that focuses on accuracy, relevance, and impartiality
Morbi pretium leo et nisl aliquam mollis. Quisque arcu lorem, ultricies quis pellentesque nec, ullamcorper eu odio.
Ethereum price started a recovery wave above the $1,850 level. ETH is now consolidating and facing key hurdles near the $1,920 level.
- Ethereum started a recovery wave above $1,820 and $1,850 levels.
- The price is trading above $1,860 and the 100-hourly Simple Moving Average.
- There is a connecting bullish trend line forming with support at $1,860 on the hourly chart of ETH/USD (data feed via Kraken).
- The pair must clear the $1,900 and $1,920 resistance levels to start a decent increase.
Ethereum Price Starts Recovery
Ethereum price managed to stay above the $1,750 support zone and started a recovery wave, like Bitcoin. ETH was able to climb above the $1,820 and $1,850 resistance levels.
The bulls even pushed the price above the $1,880 resistance zone. There was a move above the 50% Fib retracement level of the downward wave from the $2,032 swing high to the $1,767 low. However, the bears are active near the $1,920 zone.
Ethereum price is now trading above $1,850 and the 100-hourly Simple Moving Average. There is also a connecting bullish trend line forming with support at $1,860 on the hourly chart of ETH/USD.
On the upside, the price seems to be facing hurdles near the $1,900 level. The next key resistance is near the $1,920 level and the 61.8% Fib retracement level of the downward wave from the $2,032 swing high to the $1,767 low.

The first major resistance is near the $1,970 level. A clear move above the $1,970 resistance might send the price toward the $2,020 resistance. An upside break above the $2,020 resistance might call for more gains in the coming sessions. In the stated case, Ether could rise toward the $2,050 resistance zone or even $2,120 in the near term.
Another Decline In ETH?
If Ethereum fails to clear the $1,920 resistance, it could start another decline. Initial support on the downside is near the $1,860 level and the trend line. The first major support sits near the $1,845 zone.
A clear move below the $1,845 support might push the price toward the $1,800 support. Any more losses might send the price toward the $1,765 support level in the near term. The next key support sits at $1,710.
Technical Indicators
Hourly MACD – The MACD for ETH/USD is losing momentum in the bullish zone.
Hourly RSI – The RSI for ETH/USD is now above the 50 zone.
Major Support Level – $1,860
Major Resistance Level – $1,920

Reason to trust
![]()
Strict editorial policy that focuses on accuracy, relevance, and impartiality
Created by industry experts and meticulously reviewed
The highest standards in reporting and publishing
Strict editorial policy that focuses on accuracy, relevance, and impartiality
Morbi pretium leo et nisl aliquam mollis. Quisque arcu lorem, ultricies quis pellentesque nec, ullamcorper eu odio.
Bitcoin price started a recovery wave above the $83,500 zone. BTC is now consolidating and might struggle to settle above the $85,500 zone.
- Bitcoin started a decent recovery wave above the $83,500 zone.
- The price is trading above $83,000 and the 100 hourly Simple moving average.
- There is a connecting bullish trend line forming with support at $84,500 on the hourly chart of the BTC/USD pair (data feed from Kraken).
- The pair could start another increase if it stays above the $83,500 zone.
Bitcoin Price Starts Recovery
Bitcoin price managed to stay above the $82,000 support zone. BTC formed a base and recently started a decent recovery wave above the $82,500 resistance zone.
The bulls were able to push the price above the $83,500 and $84,200 resistance levels. The price even climbed above the $85,000 resistance. A high was formed at $85,487 and the price is now consolidating gains above the 23.6% Fib retracement level of the upward move from the $81,320 swing low to the $85,487 high.
Bitcoin price is now trading above $83,500 and the 100 hourly Simple moving average. There is also a connecting bullish trend line forming with support at $84,550 on the hourly chart of the BTC/USD pair.

On the upside, immediate resistance is near the $85,200 level. The first key resistance is near the $85,500 level. The next key resistance could be $85,850. A close above the $85,850 resistance might send the price further higher. In the stated case, the price could rise and test the $86,650 resistance level. Any more gains might send the price toward the $88,000 level or even $88,500.
Another Decline In BTC?
If Bitcoin fails to rise above the $85,500 resistance zone, it could start a fresh decline. Immediate support on the downside is near the $84,500 level and the trend line. The first major support is near the $83,500 level and the 50% Fib retracement level of the upward move from the $81,320 swing low to the $85,487 high.
The next support is now near the $82,850 zone. Any more losses might send the price toward the $82,000 support in the near term. The main support sits at $80,500.
Technical indicators:
Hourly MACD – The MACD is now losing pace in the bullish zone.
Hourly RSI (Relative Strength Index) – The RSI for BTC/USD is now above the 50 level.
Major Support Levels – $84,500, followed by $83,500.
Major Resistance Levels – $85,200 and $85,500.
Reason to trust
![]()
Strict editorial policy that focuses on accuracy, relevance, and impartiality
Created by industry experts and meticulously reviewed
The highest standards in reporting and publishing
Strict editorial policy that focuses on accuracy, relevance, and impartiality
Morbi pretium leo et nisl aliquam mollis. Quisque arcu lorem, ultricies quis pellentesque nec, ullamcorper eu odio.
Recent XRP price action has sparked a new prediction from a crypto analyst, as a potential Head and Shoulders pattern emerges on the chart. The analyst warns that this technical formation could trigger a significant price correction for XRP, describing this downturn as the worst-case scenario.
Analyst Predicts XRP Price Crash To $1.15
The ‘Charting Guy,’ a pseudonymous crypto analyst on X (formerly Twitter), has unveiled a potential Head and Shoulder pattern formation on the XRP price chart. The analyst has shared insights into the implications of this technical pattern, projecting a potential crash in the XRP price.
Related Reading
As a well-known bearish reversal pattern, the formation of a Head and Shoulder in the XRP price chart suggests a potential shift from an uptrend to a downtrend. Typically, a Head and Shoulder pattern consists of three peaks: the Left Shoulder, Head, and Right Shoulder. However, the Charting Guy has confirmed that XRP’s current pattern formation consists of two right shoulders and one head. Due to this irregularity, the analyst has expressed doubt about the possibility of the pattern playing out.
If the Head and Shoulder pattern eventually takes shape, it could lead to a significant drop in the XRP price, potentially bringing it down to as low as $1.15. This price level aligns with a key Fibonacci Golden Pocket retracement zone between 0.618 – 0.786.
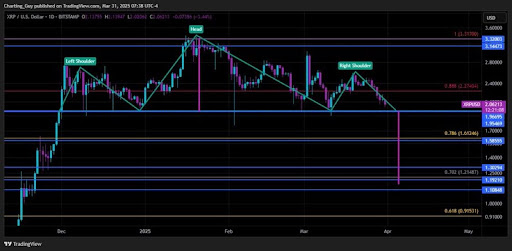
Notably, the analyst has described this projected price crash as the worst-case scenario for XRP. While he believes a bearish move is possible, the analyst is confident that XRP’s broader market structure is bullish.
Moreover, the Charting Guy argues that if XRP does decline to $1.15, it would likely serve as a healthy retracement in an overall bullish trend. He noted that XRP’s price has been holding the $2 level on daily closes, meaning its price action remains strong above support levels. This also indicates the possibility of an uptrend resumption that could yield higher highs and higher lows for XRP.
Key Support And Resistance Levels To Watch
The Charting Guy’s analysis of XRP’s potential Head and Shoulder pattern formation highlights several critical price levels to watch. Since XRP has consistently closed daily candles above $2, the analyst has determined this level as short-term support.
Related Reading
XRP has also been wicking during recent pullbacks in a crucial range between $1.7 and $1.9. As a result, the crypto analyst has revealed that he will be watching this area closely for a potential price bounce.
The Golden Pocket retracement zone, which represents the worst-case scenario for the XRP price, is between $1.15 and $1.30. If XRP experiences a deeper price correction, lower support levels have been marked from $1.19 to $0.91.
For its resistance levels, the Charting Guy has pinpointed $2.27 as a key price point. Additionally, $3.14 – $3.32 has been identified as an upper resistance range where XRP could rally if bullish momentum resumes.
Featured image from Medium, chart from Tradingview.com
Will BNB Price Rally to ATH After VanEck BNB ETF Filing?

Ethereum Price Approaches Resistance—Will It Smash Through?

Tether Expands Bitcoin Reserves with 8,888 BTC Buy—What’s the Plan?

Bitcoin Price Bounces Back—Can It Finally Break Resistance?

Analyst Reveals ‘Worst Case Scenario’ With Head And Shoulders Formation

BeInCrypto US Morning Briefing: Standard Chartered and Bitcoin

2.52 Million Altcoins Are Ruining Crypto’s Future

Animoca Brands Valuation Tanks 75% In Two Years, Here’s Why

Crypto exchange BingX hacked for $43 million

Are The Big Players Losing Interest?

Hong Kong’s Securities Association Tips Authorities On Crypto Self-Regulation

Coinbase cbBTC Set to go Live on Solana
2.52 Million Altcoins Are Ruining Crypto’s Future
Animoca Brands Valuation Tanks 75% In Two Years, Here’s Why
Crypto exchange BingX hacked for $43 million
Are The Big Players Losing Interest?
Hong Kong’s Securities Association Tips Authorities On Crypto Self-Regulation
Coinbase cbBTC Set to go Live on Solana
-

 Ethereum24 hours ago
$2,300 Emerges As The Most Crucial Resistance
-

 Market23 hours ago
CFTC’s Crypto Market Overhaul Under New Chair Brian Quintenz
-
 Altcoin23 hours ago
A Make or Break Situation As Ripple Crypto Flirts Around $2
-

 Market20 hours ago
Bitcoin Price Battles Key Hurdles—Is a Breakout Still Possible?
-

 Bitcoin17 hours ago
$500 Trillion Bitcoin? Saylor’s Bold Prediction Shakes the Market!
-
 Altcoin16 hours ago
Will XRP, SOL, ADA Make the List?
-

 Market22 hours ago
XRP Bulls Fight Back—Is a Major Move Coming?
-
 Market21 hours ago
Is CZ’s April Fool’s Joke a Crypto Reality or Just Fun?