
Altcoin
Shiba Inu Price Set To Repeat History? Falling Wedge Pattern Shows A Rally


A new technical analysis on TradingView suggests that Shiba Inu’s recent price movements may be echoing a familiar structure from earlier last year, raising the possibility of history repeating itself. The analyst examined Shiba Inu’s chart from November 2024 to the present and pointed out a sequence of patterns that also appeared between March and November 2024, patterns that preceded a significant rally.
The analysis outlines a clear path that could lead to a notable price surge towards $0.00003 if these price patterns continue to play out.
Pattern Analysis Suggests Shiba Inu May Be Ready For A Big Upside Move
The entire analysis is grounded on the idea that crypto markets are cyclical and exhibit recurring behaviors, crowd psychology, and recognizable chart patterns. Notably, this analysis uses four distinct pattern stages that played out on the Shiba Inu daily candlestick timeframe chart.
The TradingView analyst began by highlighting the completion of a falling wedge pattern in SHIB’s price chart, which is a classic bullish reversal setup. The analyst noted that this same structure played out from March 2024 to September 2024, acting as a precursor to a breakout in the weeks that followed.

As of now, Shiba Inu seems to have moved past that initial wedge stage, making way for the second stage, which has been identified as a cup-and-handle pattern. This pattern, which was observed and confirmed recently, also mirrors the meme coin’s formation back in August 2024, when a brief consolidation phase eventually gave way to an upward move.
The analyst believes that the chart has now entered what they describe as “Stage 3,” a phase where a W-shaped formation may emerge. Historically, this pattern aligned with a powerful uptrend in September 2024 when SHIB experienced a multi-week rally.
Breakout Could Be Coming Next
Although pattern repetition isn’t guaranteed, the analyst’s comparison of current and past formations presents an interesting narrative that bullish traders will be interested in. If the final stage plays out as the analyst expects, Shiba Inu could soon form an inverted head-and-shoulders pattern, which is one of the strongest bullish reversal signals in technical analysis. This pattern was last spotted as stage 4 just before a rally that brought the Shiba Inu price above $0.00003 in December 2024.
Based on this four-stage progression, the trader is projecting a 91% rally from here, which could lift SHIB to $0.0000335. At the time of writing, SHIB is trading at $0.00001340, meaning the token is still in the early phase of this anticipated pattern sequence.
However, Shiba Inu’s short-term performance has recently shown weakness. Over the past 24 hours, the token has slipped by 7.3%, losing ground after a brief push above the 100-day moving average it had only recently reclaimed a week ago. This dip now sees Shiba Inu retesting that same moving average, which could either act as a springboard for the next upward move or become broken.
Featured image from iStock, chart from Tradingview.com
Editorial Process for bitcoinist is centered on delivering thoroughly researched, accurate, and unbiased content. We uphold strict sourcing standards, and each page undergoes diligent review by our team of top technology experts and seasoned editors. This process ensures the integrity, relevance, and value of our content for our readers.


Crypto expert Egrag Crypto has again predicted that the XRP price could rally to as high as $27. The analyst has also revealed the exact timeline for when the altcoin could record this massive price surge.
Expert Reveals Time For XRP Price To Hit $27
In an X post, Egrag Crypto asserted that the XRP price can hit $27 in 60 days. The expert remarked that historical patterns indicate that the altcoin can reach this target within this timeframe.
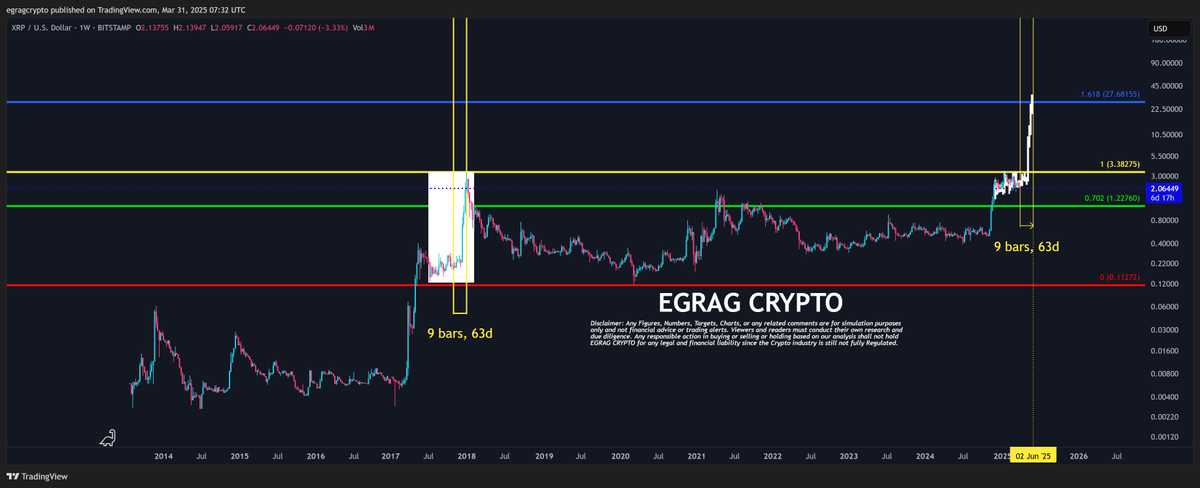
Based on this price prediction, XRP could reach this $27 target by June, marking a 1,250% gain for Ripple’s native crypto. The expert’s accompanying chart showed that he was alluding to the 2017 bull run as to why the altcoin could record such a parabolic rally.
In 2017, XRP recorded a historic gain of over 60,000% as it rallied to its current all-time high (ATH) of $3.8 the following year. As such, based on history, a 1,250% increase is nothing for the altcoin.
In the meantime, the XRP price still boasts a bearish outlook thanks to the sentiment in the broader crypto market. As CoinGape reported, Ripple’s coin could drop to the next major support levels at $1.79 and $1.56 if it fails to hold above $2.03.
Decision Time For The Altcoin
In an X post, crypto analyst CasiTrades stated that it is decision time for the XRP price. She noted that the altcoin is showing strength with a bounce right back to the first key test at $2.17. She added that this is the resistance level she wants to see flip into support, as it might be the “most important price of the week.”
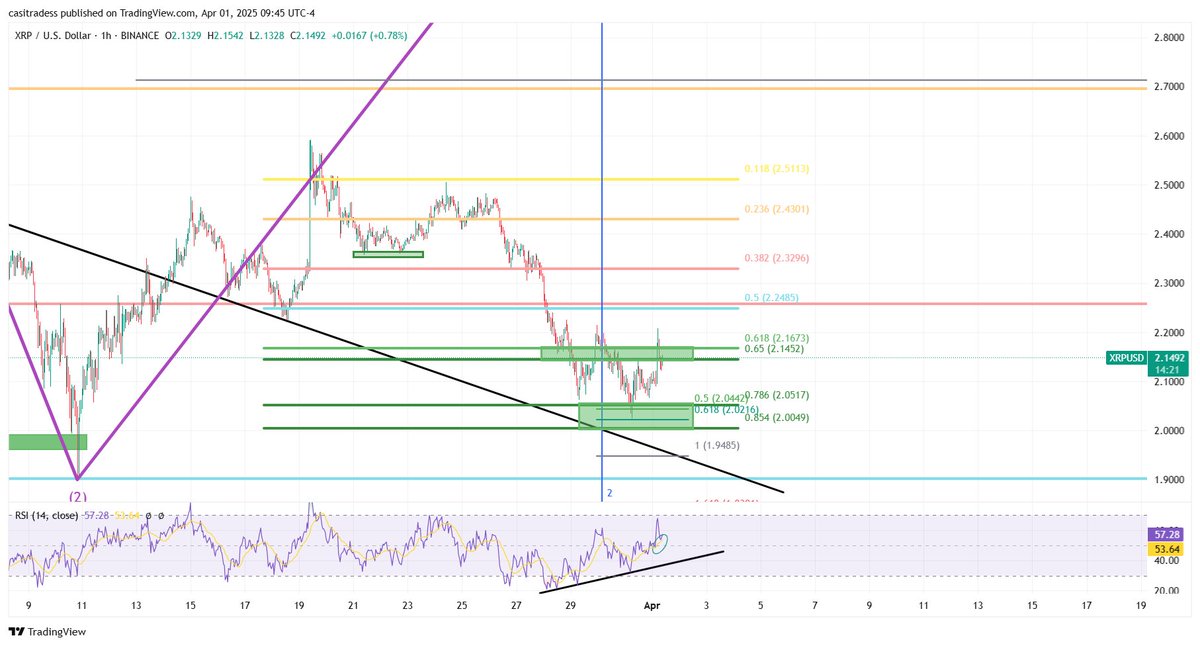
The analyst stated that XRP must reclaim this level to build momentum. She added that the $2 level remains a valid target if the $2.17 level rejects. Meanwhile, CasiTrades revealed that $2.70, $3.05, and $3.80 are the major resistance zones once the upward trend is confirmed.
The analyst also mentioned that the XRP price is now fully inside the Fibonacci Time Zone 3, which spans most of April. She affirmed that this is the breakout window market participants have been preparing for and that all signs point to a macro wave.
CasiTrades affirmed that the structure is clean. The RSI divergence has confirmed the bottom, while the subwaves are aligning well with the larger targets. If the next leg pushes XRP back above $2.17 with momentum, she claimed that market participants may finally see obvious signs of Wave 3. Interestingly, the analyst added that if the altcoin clears $2.70 this week, it may break the $1,000 price extension.
For now, investors may remain cautious, especially seeing how XRP fell after the PMI and JOLTS data release earlier today. Donald Trump is also set to announce reciprocal tariffs tomorrow, which could spark a massive price crash.
Boluwatife Adeyemi
Boluwatife Adeyemi is a well-experienced crypto news writer and editor who has covered topics that cut across several topics and niches. Boluwatife has a knack for simplifying the most technical concepts and making it easy for crypto newbies to understand. Away from writing, He is an avid basketball lover, a traveler and a part-time degen.
Disclaimer: The presented content may include the personal opinion of the author and is subject to market condition. Do your market research before investing in cryptocurrencies. The author or the publication does not hold any responsibility for your personal financial loss.

A recent Binance update has triggered massive liquidations while sending Solana memecoin ACT into a steep correction. At first, pundits blamed market maker Wintermute for the jarring declines but Binance’s update to leverage and margin tiers appears to be the culprit.
Several Altcoins on Binance Suffer Massive Corrections
According to an X post, several altcoins listed on Binance took a major hit, dropping by double-digit percentages. The hardest hit of the lot was Solana memecoin ACT, experiencing a sudden drop of over 50% in 30 minutes.
Other altcoins including DEXE and DF equally recorded steep declines of 23% and 16% respectively in the same window. The price slump left traders scratching their heads but a consensus formed that sizable sell orders were behind the declines.

“The sudden dips were triggered by large sell orders executed in a short time frame, leading to a significant surge in spot trading volume,” said one pundit.
Others turned to market maker Wintermute as the trigger for the selloff. However, Wintermute CEO Evgeny Gaevoy denied responsibility while noting that the market maker reacted “post move.”
The decline comes amid a broader market recovery with several cryptocurrencies including Compound (COMP) gaining 70%.
What Triggered The 50% Decline For Solana Meme Coin
A Binance update on leverage and margin tiers on specific tokens like ACT triggered the massive declines. According to an April 1 announcement, the top exchange has updated the margin tiers of several perpetual contracts, noting that existing positions will be affected.
Following the move, one ACT whale got liquidated for $3.79 million at $0.1877, triggering a broad selloff. Former FTX community manager Benson Sun noted that traders had less than 3 hours to respond to the change, criticizing Binance for the move.
“Before changing the rules, Binance should have evaluated how many positions would be closed,” said Sun. “If there are market makers with large positions, they should have notified them in advance.”
Within hours of MUBARAK’s listing, the memecoin tumbled by 40% with Binance CEO Changpeng Zhao downplaying the impact of a listing on prices. Binance has drawn criticism in recent days following its exclusion of Pi Network from its Vote To List initiative.
Aliyu Pokima
Aliyu Pokima is a seasoned cryptocurrency and emerging technologies journalist with a knack for covering needle-moving stories in the space. Aliyu delivers breaking news stories, regulatory updates, and insightful analysis with depth and precision. When he’s not poring over charts or following leads, Aliyu enjoys playing the bass guitar, lifting weights and running marathons.
Disclaimer: The presented content may include the personal opinion of the author and is subject to market condition. Do your market research before investing in cryptocurrencies. The author or the publication does not hold any responsibility for your personal financial loss.

A crypto market crash looks imminent, with Bitcoin, Ethereum, XRP, and Dogecoin witnessing notable declines. This price crash happened following the release of weak manufacturing PMI and JOLTS data, which provides a bearish outlook for the market.
Crypto Market Crash: BTC, ETH, XRP, & DOGE Decline
CoinMarketCap data shows that a crypto market crash could be on the horizon, with the Bitcoin price sharply dropping below $83,000 from a daily high of around $84,400. Altcoins such as Ethereum, XRP, and DOGE also witnessed sharp declines.
This market crash occurred following the release of weak ISM manufacturing PMI and JOLTS data. The March PMI data dropped to 49, below expectations of 49.5 and lower than the 50 recorded in February.
The US JOLTS job openings for February came in at 7.568 million, below the expected 7.690 million and lower than the 7.762 million recorded in January. These data add to several macro fundamentals that paint a bearish outlook for the market.
This crypto market crash could persist, with China, Japan, and South Korea agreeing to respond to Donald Trump’s proposed tariffs. Trump is set to announce a number of reciprocal tariffs tomorrow, which could significantly harm the market as it sets off a trade war between the US and other nations.
Boluwatife Adeyemi
Boluwatife Adeyemi is a well-experienced crypto news writer and editor who has covered topics that cut across several topics and niches. Boluwatife has a knack for simplifying the most technical concepts and making it easy for crypto newbies to understand. Away from writing, He is an avid basketball lover, a traveler and a part-time degen.
Disclaimer: The presented content may include the personal opinion of the author and is subject to market condition. Do your market research before investing in cryptocurrencies. The author or the publication does not hold any responsibility for your personal financial loss.

BeInCrypto US Morning Briefing: Standard Chartered and Bitcoin
SUI Price Stalls After Major $147 Million Token Unlock

Bitcoin Could Serve as Inflation Hedge or Tech Stock, Say Experts

Circle Files for IPO

Solana Faces Resistance While ETH Sees DEX Volume Boost

Hill Rejects Interest-Bearing Stablecoins Despite Armstrong’s Wish

2.52 Million Altcoins Are Ruining Crypto’s Future

Animoca Brands Valuation Tanks 75% In Two Years, Here’s Why

Crypto exchange BingX hacked for $43 million

Are The Big Players Losing Interest?

Hong Kong’s Securities Association Tips Authorities On Crypto Self-Regulation

Coinbase cbBTC Set to go Live on Solana
2.52 Million Altcoins Are Ruining Crypto’s Future
Animoca Brands Valuation Tanks 75% In Two Years, Here’s Why
Crypto exchange BingX hacked for $43 million
Are The Big Players Losing Interest?
Hong Kong’s Securities Association Tips Authorities On Crypto Self-Regulation
Coinbase cbBTC Set to go Live on Solana
-

 Market21 hours ago
Ethereum Price Faces a Tough Test—Can It Clear the Hurdle?
-

 Bitcoin13 hours ago
$500 Trillion Bitcoin? Saylor’s Bold Prediction Shakes the Market!
-

 Market20 hours ago
Solana (SOL) Holds Steady After Decline—Breakout or More Downside?
-

 Ethereum19 hours ago
$2,300 Emerges As The Most Crucial Resistance
-

 Market19 hours ago
CFTC’s Crypto Market Overhaul Under New Chair Brian Quintenz
-
 Altcoin12 hours ago
Will XRP, SOL, ADA Make the List?
-
 Altcoin19 hours ago
A Make or Break Situation As Ripple Crypto Flirts Around $2
-

 Market18 hours ago
XRP Bulls Fight Back—Is a Major Move Coming?
✓ Share: