
Market
Hedera Falls 4% as Bears Dominate: What’s Next for HBAR?

Hedera (HBAR) is showing signs of weakness after dropping 4% on Thursday. Its market cap is now hovering close to the $8 billion mark. Recent technical indicators suggest that sellers may be gaining control, especially as directional strength begins to shift.
The DMI and Ichimoku Cloud both point to a market caught in consolidation but leaning slightly bearish. With key resistance holding firm and bearish patterns threatening to develop, HBAR’s next move could be critical.
HBAR DMI Shows Sellers Are in Control
Hedera’s Directional Movement Index (DMI) chart shows that the Average Directional Index (ADX) is currently sitting at 16.6, a notable decline from yesterday’s 23.5.
The ADX is a key indicator used to gauge the strength of a trend, and a drop like this suggests that the momentum behind any recent move—bullish or bearish—is weakening.
An ADX below 20 typically points to a lack of a clear trend or the presence of sideways movement, which aligns with HBAR’s recent consolidation phase observed over the last few days.
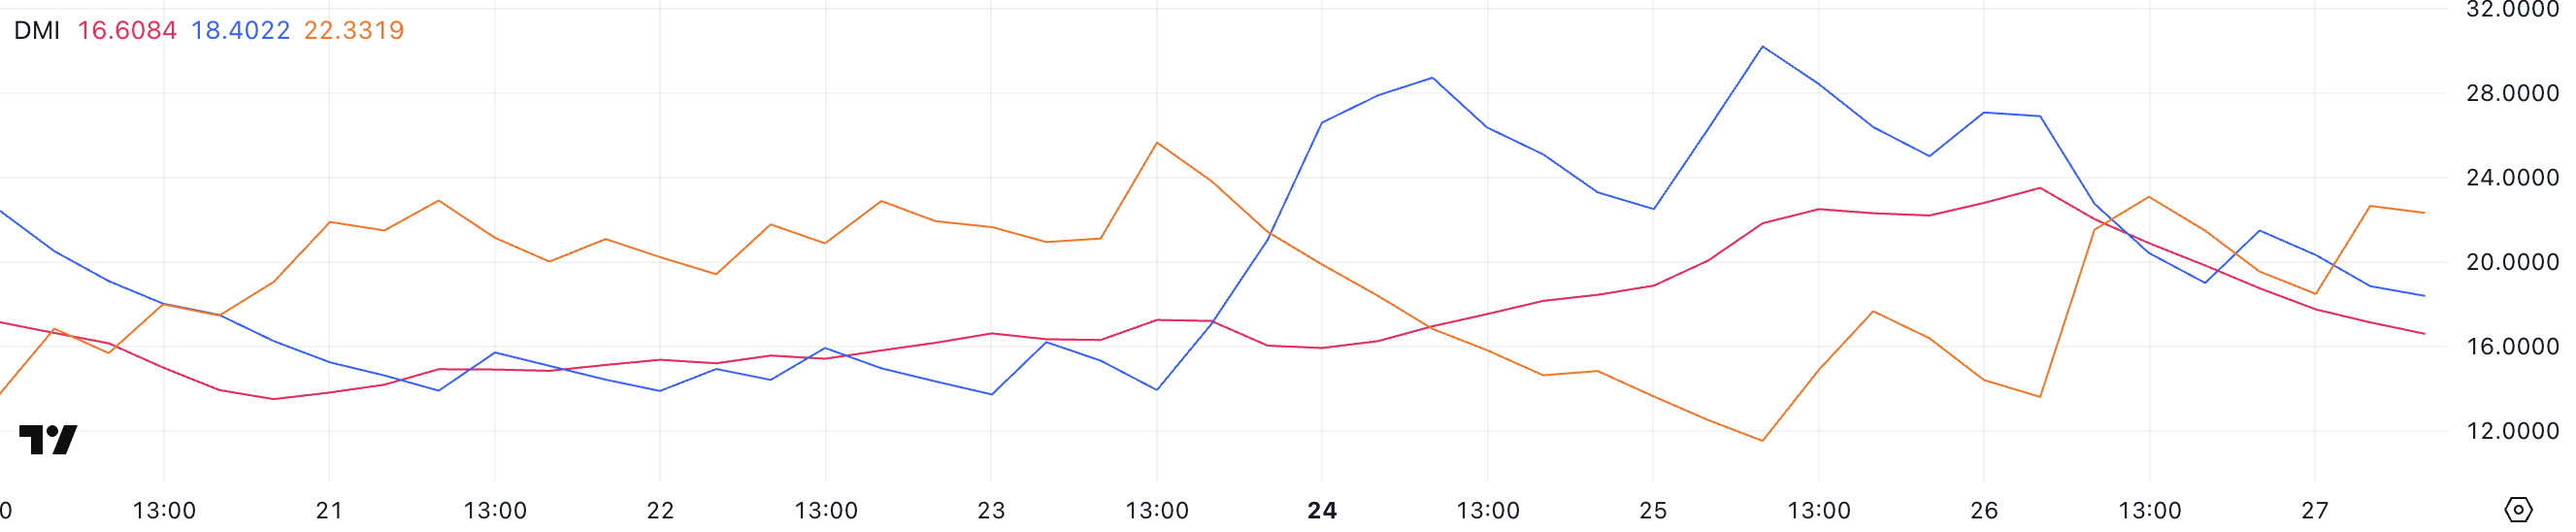
The ADX itself doesn’t indicate the direction of the trend, only its strength. Generally, values below 20 signal a weak or non-existent trend, 20–25 indicate a potential emerging trend, and values above 25 suggest a strong trend.
Alongside the ADX, the DMI’s +DI (Positive Directional Indicator) and -DI (Negative Directional Indicator) give insight into direction. Currently, +DI is at 18.4, falling from 26.9 yesterday, while -DI has climbed to 22.33 from 13.61.
This flip in directional strength suggests bearish momentum is increasing while bullish momentum fades.
Coupled with a low ADX, this could imply that although sellers are gaining the upper hand, the overall trend still lacks conviction. This reinforces the idea that HBAR is likely to remain range-bound unless a breakout confirms a new direction.
Hedera Ichimoku Cloud Indicates a Bearish Trend Could Arise Soon
Hedera’s Ichimoku Cloud chart reveals a market in equilibrium, with price hovering near the lower boundary of the cloud. The recent candlesticks show a clear hesitation around this area, reflecting the ongoing consolidation.
The Kijun-sen (blue line) has turned flat, indicating a loss of momentum and a potential pause in trend direction. Similarly, the Tenkan-sen (red line) is sloping downward, suggesting short-term bearish pressure.
Despite this, the forward cloud has flipped to a bullish twist, signaling a possible shift in sentiment—but that outlook remains unconfirmed unless HBAR can establish clear separation above the cloud.
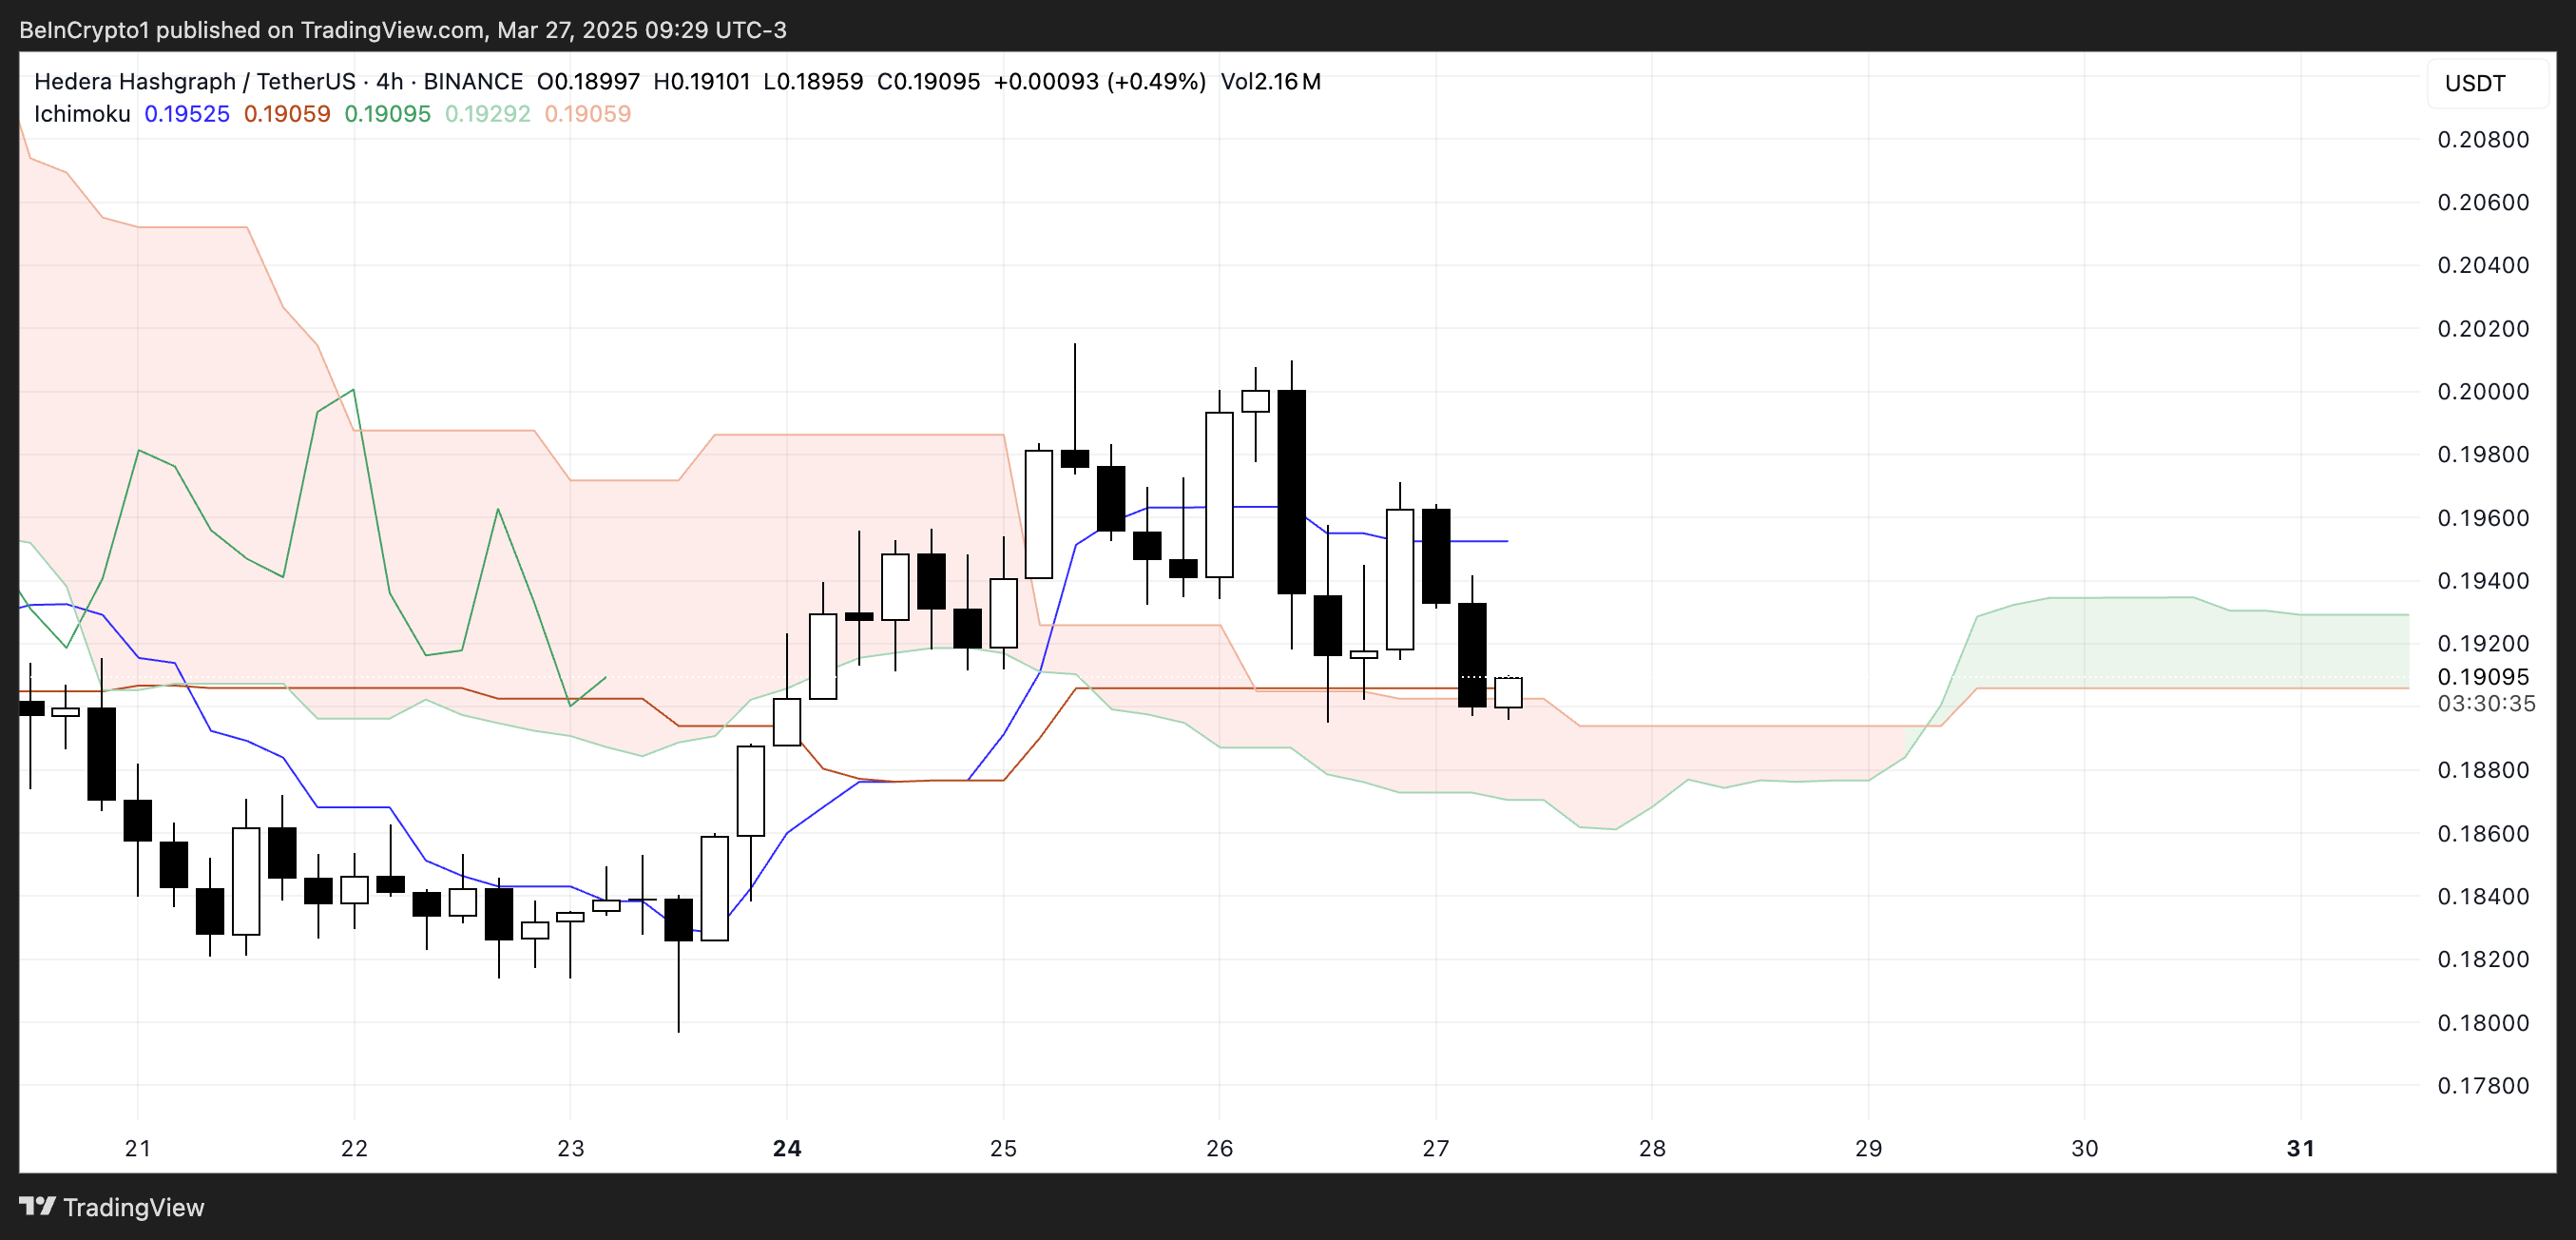
The cloud itself—the Kumo—remains relatively flat and thin, reinforcing the current consolidation phase.
A thin cloud typically indicates weak support or resistance, making it easier for price to move through but harder to trust any breakout unless accompanied by strong volume and momentum. The Chikou Span (lagging line) appears to be tangled within past price action, which also suggests a lack of trend clarity.
Overall, the Ichimoku signals point to indecision in the market, with a slight bearish lean in the short term and a potential for trend development if buyers can gain control.
Can Hedera Break Above $0.20?
Hedera has recently faced strong resistance, struggling to break past the $0.199 level—failing twice over the past few days. This repeated rejection has created a ceiling that’s proving tough to breach.
Meanwhile, its EMA lines are tightening, and there’s the looming possibility of a death cross forming, which would signal a potential bearish shift. If that crossover is confirmed, it could accelerate downward pressure. This would lead HBAR to retest its next key support level near $0.184.
A breakdown below would open the door for further downside, potentially extending the move toward the lower support region around $0.179. If that support is also lost, HBAR could go below $0.17 for the first time since November 2024.
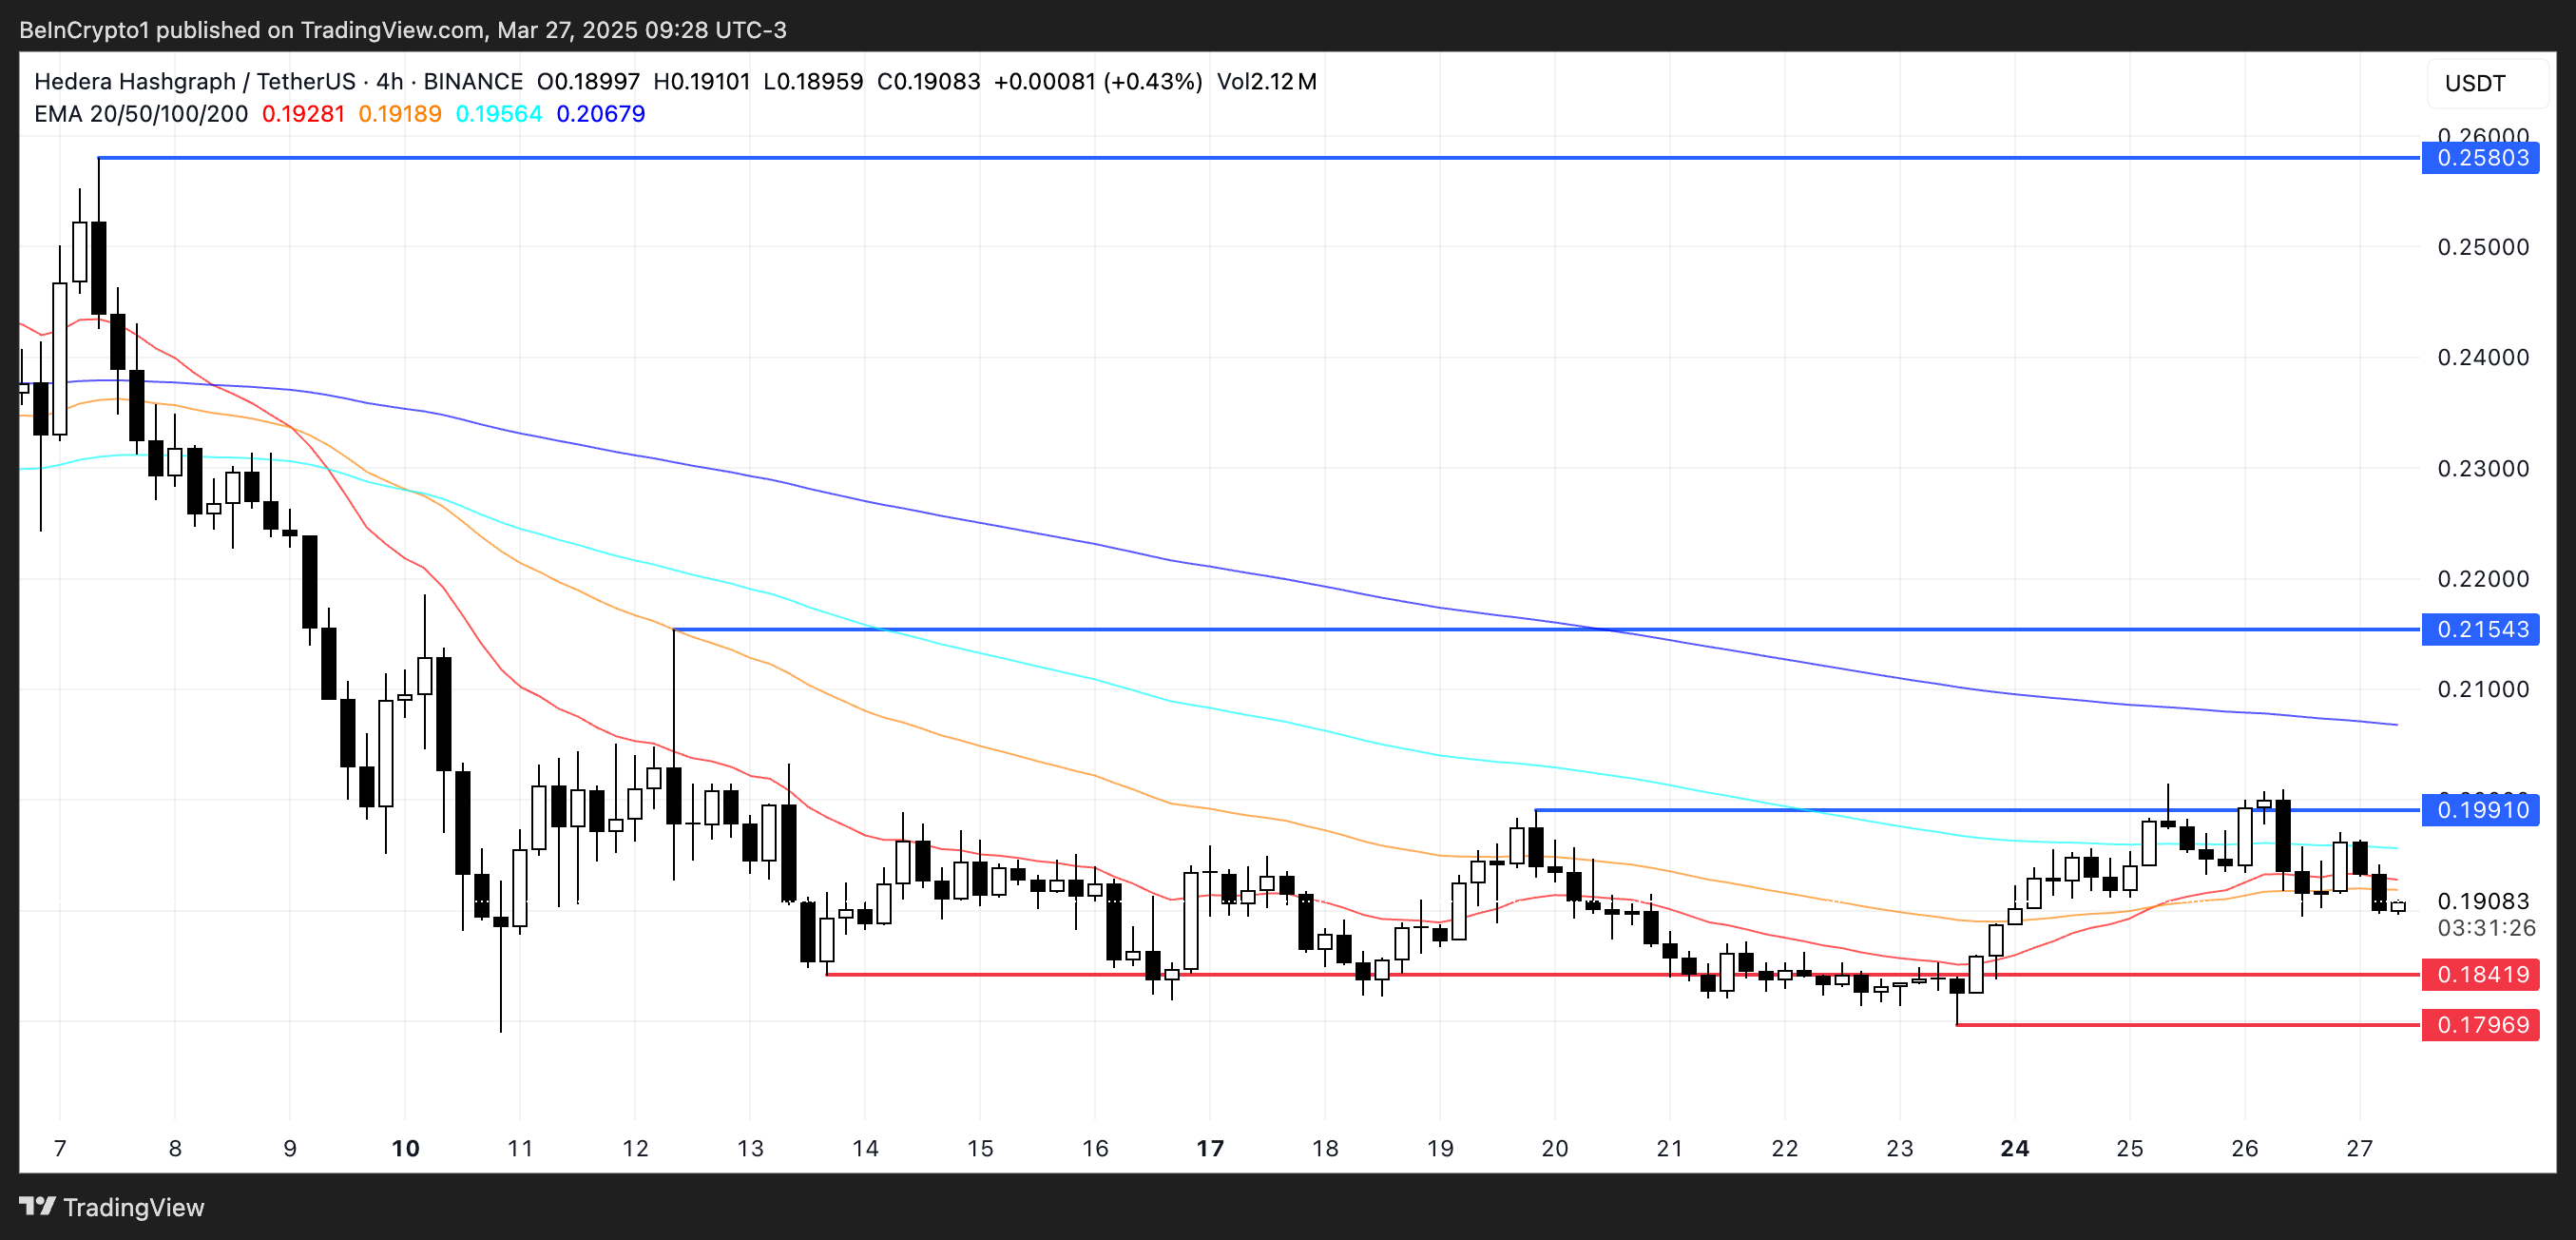
However, if momentum can flip, the bulls still have a case. Should the Hedera price manage to regain strength and form a sustainable uptrend, a third challenge of the $0.199 resistance could be on the table.
A successful breakout above that level would likely trigger a move toward the next resistance zone around $0.21.
And if the bullish momentum continues to build, there’s potential for an extended rally toward the $0.258 level.
Disclaimer
In line with the Trust Project guidelines, this price analysis article is for informational purposes only and should not be considered financial or investment advice. BeInCrypto is committed to accurate, unbiased reporting, but market conditions are subject to change without notice. Always conduct your own research and consult with a professional before making any financial decisions. Please note that our Terms and Conditions, Privacy Policy, and Disclaimers have been updated.


SUI enters a critical phase today as a $147 million token unlock threatens to inject selling pressure into a market already testing key resistance levels. Despite a sharp rebound in momentum—evident in the RSI’s surge from oversold territory—SUI failed to break above the crucial 60 mark, signaling buyer hesitation.
The Ichimoku Cloud shows price action pressing against the cloud’s edge, but lacking the conviction needed for a clear breakout. With a possible golden cross forming on the EMA lines, bulls still have a chance—if they can overcome resistance at $2.50 and avoid being dragged down by post-unlock volatility.
SUI RSI Surged Since Yesterday But Failed To Break Above 60
SUI’s Relative Strength Index (RSI) has jumped sharply to 58.94, up from 29.38 just a day ago, reflecting a strong shift in short-term momentum.
The RSI is a momentum oscillator that measures the speed and magnitude of recent price changes. It typically ranges from 0 to 100. Readings below 30 suggest an asset may be oversold, while levels above 70 indicate it may be overbought.
The rapid rise in SUI’s RSI suggests buyers have stepped in aggressively after a period of heavy selling.
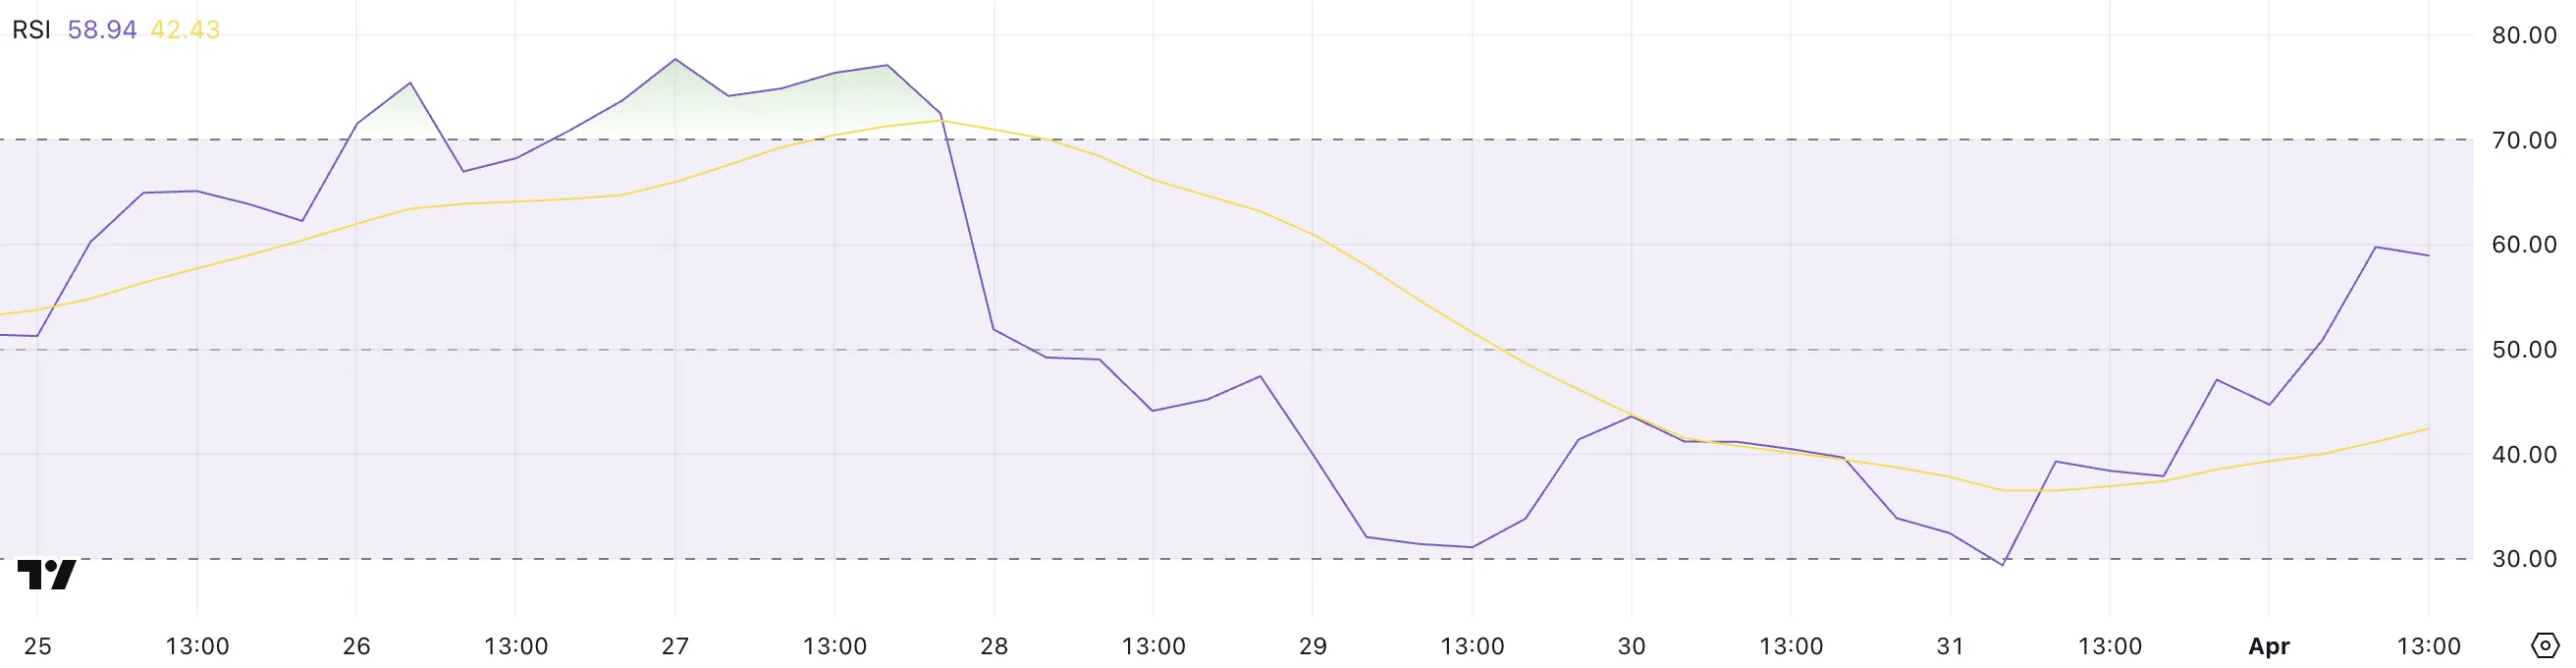
However, despite the impressive rebound, SUI’s RSI briefly approached but failed to break above the 60 threshold earlier today.
This level often acts as a short-term resistance during recovery phases, and the rejection may indicate lingering hesitation among buyers or profit-taking after the surge.
While the RSI nearing 60 is encouraging, a decisive move above it would be needed to confirm a breakout. For now, SUI appears to be in a recovery mode. However, the inability to push past 60 highlights that bulls are not fully in control just yet.
Ichimoku Cloud Shows Lack Of Strong Upward Momentum
SUI blockchain Ichimoku Cloud chart shows a potential breakout attempt, as the price has surged upward and is now hovering right at the edge of the Kumo (cloud).
This movement suggests bullish momentum is trying to build. However, the resistance provided by the thick, red cloud ahead could make it difficult for SUI to sustain the uptrend without stronger confirmation.
The Tenkan-sen (blue line) is starting to rise and has crossed above the Kijun-sen (red line), which is a bullish signal. However, the price still needs to clearly break and hold above the cloud to flip the overall trend from bearish to bullish.
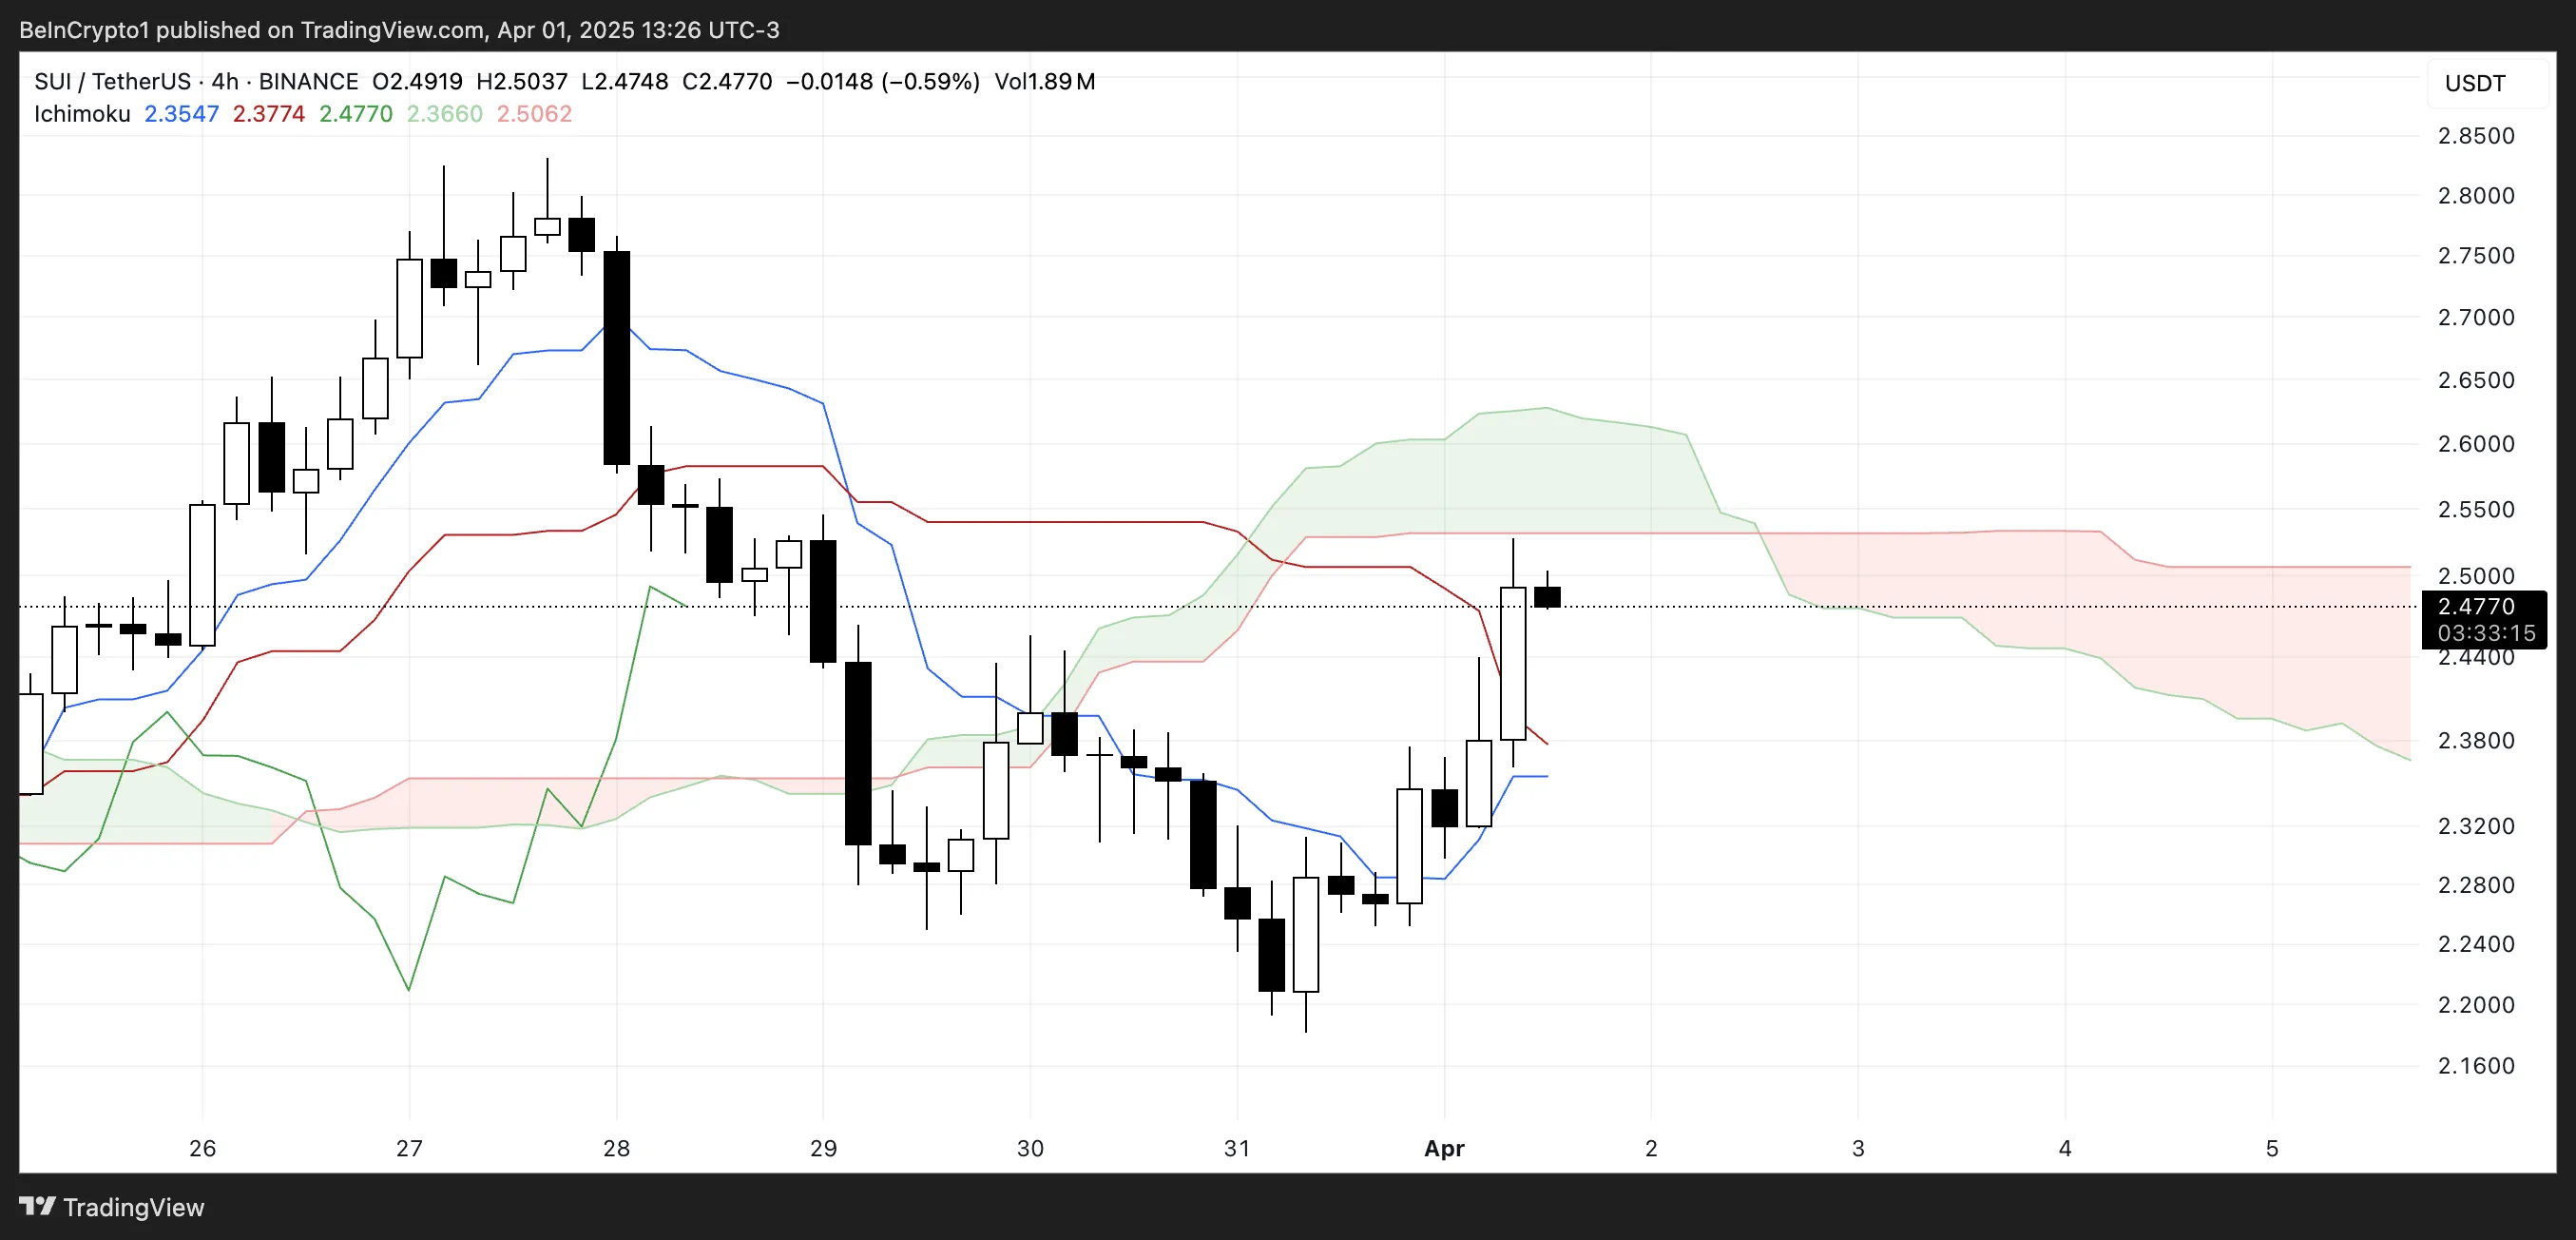
For now, the cloud remains bearish and flat, indicating possible resistance and a lack of strong upward conviction.
The current position suggests that SUI is at a key decision point—either break through the cloud to initiate a trend reversal or get rejected and slip back into the previous downtrend range.
If buyers can sustain the pressure and push the price above the upper cloud boundary, it could trigger a stronger rally. But without increased volume and broader market support, the price risks getting stuck in consolidation or turning back downward.
Will SUI Rise Back To $2.80?
SUI’s EMA lines are tightening and showing signs of a potential golden cross. That happens when a short-term moving average crosses above a longer-term one—a classic bullish signal that often precedes upward momentum.
However, the price is currently grappling with a key resistance near the $2.50 level.
If bulls manage to break through this level, it could open the path for a move toward $2.83.
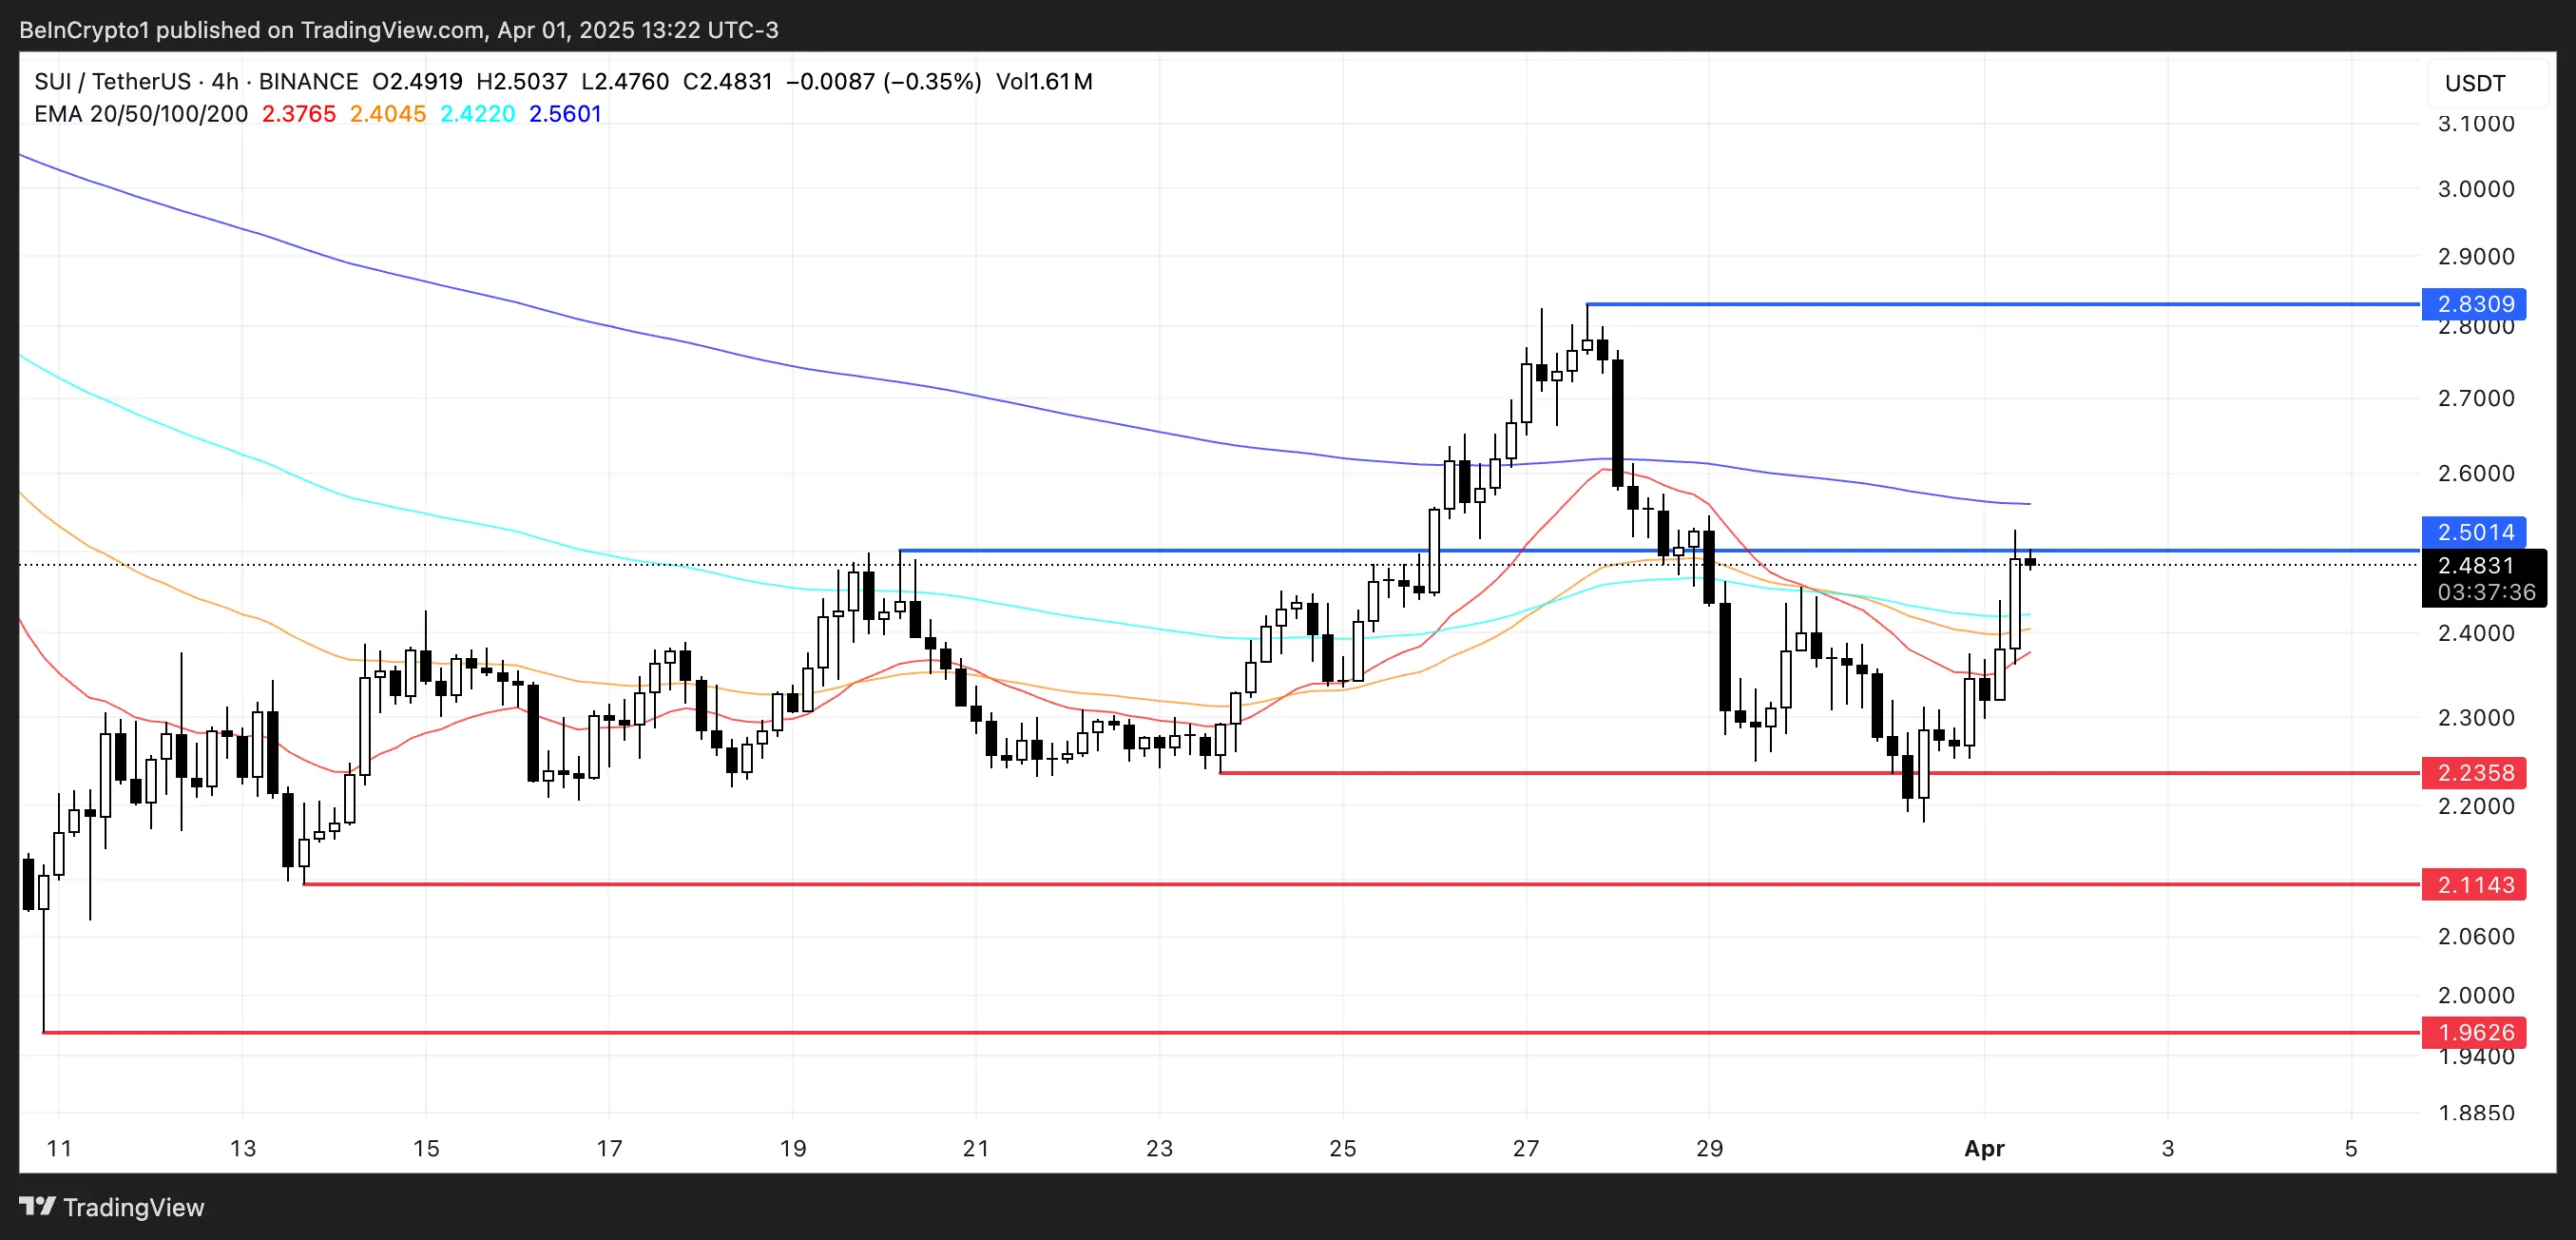
That said, downside risks remain, particularly with today’s $147 million token unlock, which could introduce significant selling pressure. If that selling materializes, SUI price could fall back to test the support at $2.23.
A breakdown below that level would likely shift momentum back in favor of bears. This would expose deeper supports at $2.11 and $1.96.
Disclaimer
In line with the Trust Project guidelines, this price analysis article is for informational purposes only and should not be considered financial or investment advice. BeInCrypto is committed to accurate, unbiased reporting, but market conditions are subject to change without notice. Always conduct your own research and consult with a professional before making any financial decisions. Please note that our Terms and Conditions, Privacy Policy, and Disclaimers have been updated.


Leading stablecoin issuer Circle finally launched an IPO. It has been preparing for this launch for almost a year, and joins several other crypto firms that are interested in an IPO filing.
This gives Circle a number of opportunities, both to benefit financially and to better integrate with the financial infrastructure and regulatory apparatus.
Circle’s IPO Comes At Last
Circle, one of the world’s largest stablecoin issuers, just filed for an IPO. The firm has been planning this move for nearly a year, relocating to the United States to make the process easier. Since Trump won the most recent Presidential election, the firm’s chances of an IPO increased, and now it has finally pulled the trigger:
“For Circle, becoming a publicly traded corporation on the New York Stock Exchange is a continuation of our desire to operate with the greatest transparency and accountability possible. We are building what we believe to be critical infrastructure for the financial system, and we seek to work with leading companies and governments around the world in shaping and building this new internet financial system,” founder and CEO Jeremy Allaire claimed in the filing.
By launching this IPO, Circle has opened a few new doors for itself. Of course, it’s a substantial opportunity for revenue, but it’s also an important way to intensify the firm’s connections to the financial infrastructure. In this respect, it joins a number of other crypto firms that have sought their own IPO in the last month.
Circle’s IPO filing doesn’t list many concrete numbers, such as initial public offering price, number of available shares, proceeds to the selling stockholders, etc. However, this development is very recent. Further details will likely come to light as the sale progresses.
Disclaimer
In adherence to the Trust Project guidelines, BeInCrypto is committed to unbiased, transparent reporting. This news article aims to provide accurate, timely information. However, readers are advised to verify facts independently and consult with a professional before making any decisions based on this content. Please note that our Terms and Conditions, Privacy Policy, and Disclaimers have been updated.

Solana (SOL) is attempting to recover from an almost 12% correction over the past seven days. The RSI has surged into overbought territory, suggesting strong bullish momentum. However, the BBTrend remains deeply negative—though it’s beginning to ease, hinting at potential stabilization.
Meanwhile, the EMA lines are setting up for a possible golden cross, signaling that a trend reversal could be forming if key resistance levels are broken. Still, with Ethereum overtaking Solana in DEX volume for the first time in six months and critical support levels not far below, SOL remains in a delicate position.
SOL RSI Is Now At Overbought Levels
Solana’s Relative Strength Index (RSI) has surged to 72.91, up sharply from 38.43 just a day ago—indicating a rapid shift in momentum from neutral to strongly bullish territory.
The RSI is a widely used momentum oscillator that measures the speed and magnitude of price movements on a scale from 0 to 100.
Readings above 70 typically suggest an asset is overbought and may be due for a pullback, while levels below 30 indicate oversold conditions and potential for a rebound.
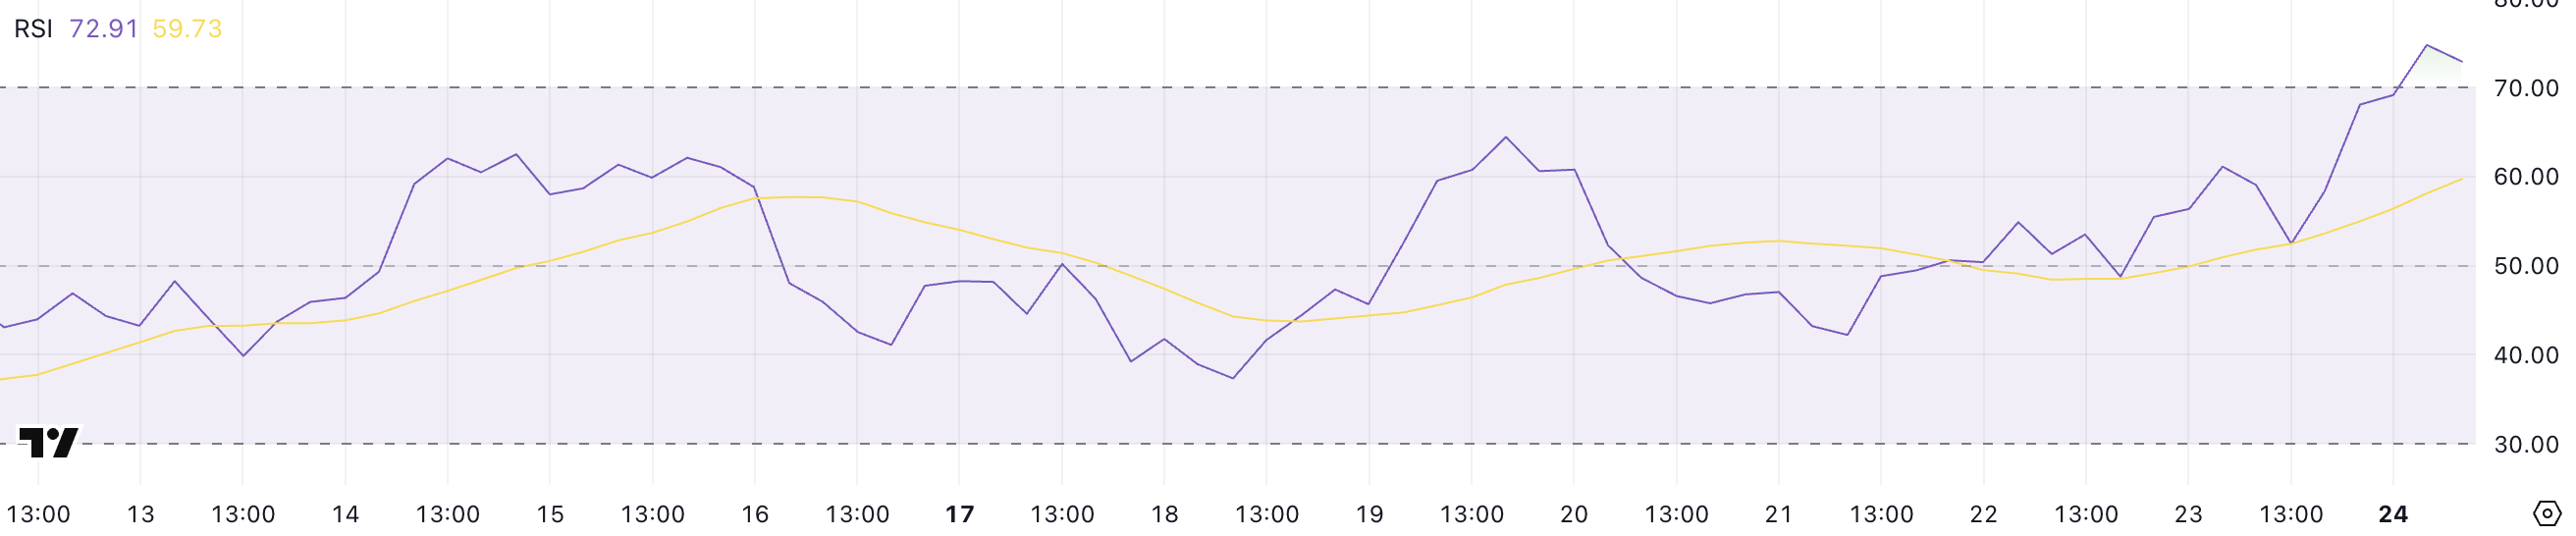
With Solana’s RSI now above 70, the asset has officially entered overbought territory, reflecting intense buying pressure in the short term.
While this can sometimes precede a correction or consolidation, it can also signal the start of a breakout rally.
Traders should watch closely for signs of continuation or exhaustion. If momentum holds, Solana could push higher, but any stalling may trigger profit-taking and short-term volatility.
Solana BBTrend Is Decreasing, But Still Very Negative
Solana’s BBTrend indicator has climbed slightly to -11.18 after hitting a low of -12.68 earlier today. That suggests that the bearish momentum is starting to ease.
The BBTrend (Bollinger Band Trend) measures the strength and direction of a trend based on how price interacts with the Bollinger Bands.
Values below -10 typically indicate strong bearish pressure, while values above +10 reflect strong bullish momentum. A rising BBTrend from deep negative territory can be an early sign of a potential reversal or at least a slowdown in the downtrend.
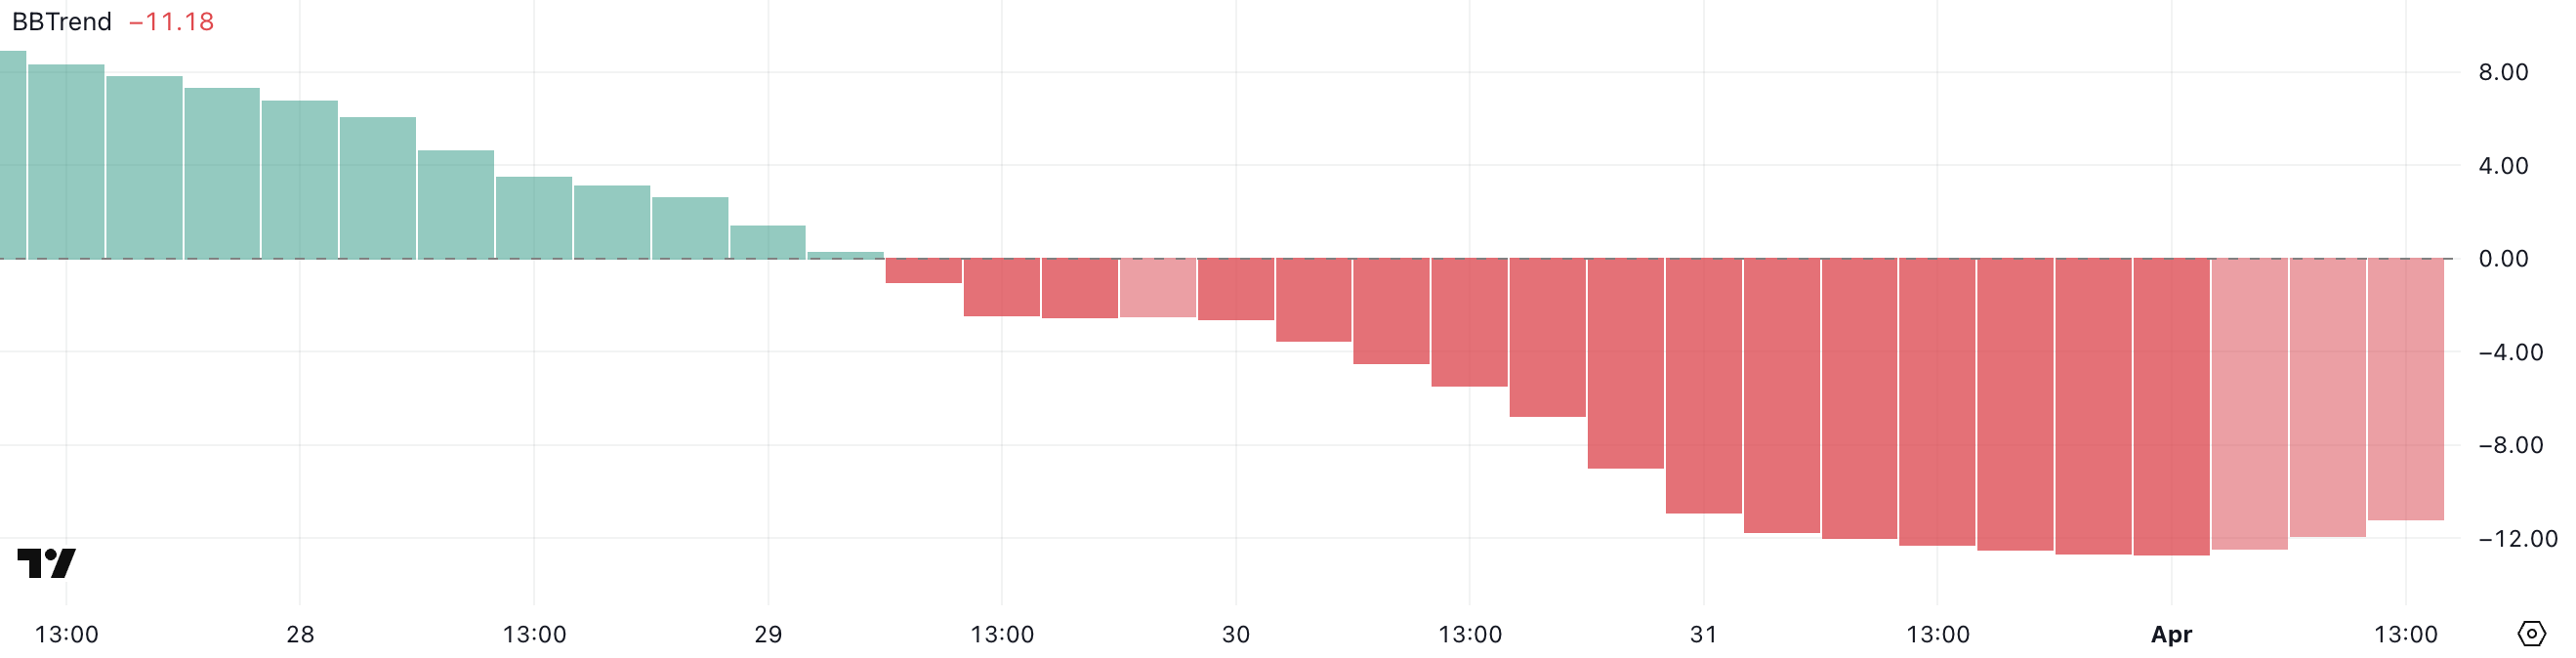
With SOL’s BBTrend still in bearish territory but improving, the market may be attempting to stabilize after a period of intense selling.
However, broader ecosystem developments complicate the technical picture. For example, Ethereum recently surpassed Solana in DEX volume for the first time in six months.
While the easing BBTrend hints at recovery potential, Solana still needs a stronger confirmation to shift the trend fully in its favor. Until then, cautious optimism may be warranted, but the bears haven’t fully let go.
Solana Still Has Challenges Ahead
Solana’s EMA lines are showing signs of an impending golden cross. A golden cross occurs when a short-term moving average crosses above a long-term one. That’s often seen as a bullish signal that can mark the start of a sustained uptrend.
If this pattern is confirmed and buying momentum continues, Solana price could push up to test the resistance at $131.
A successful breakout above that level may open the door to further gains toward $136, and potentially even $147.
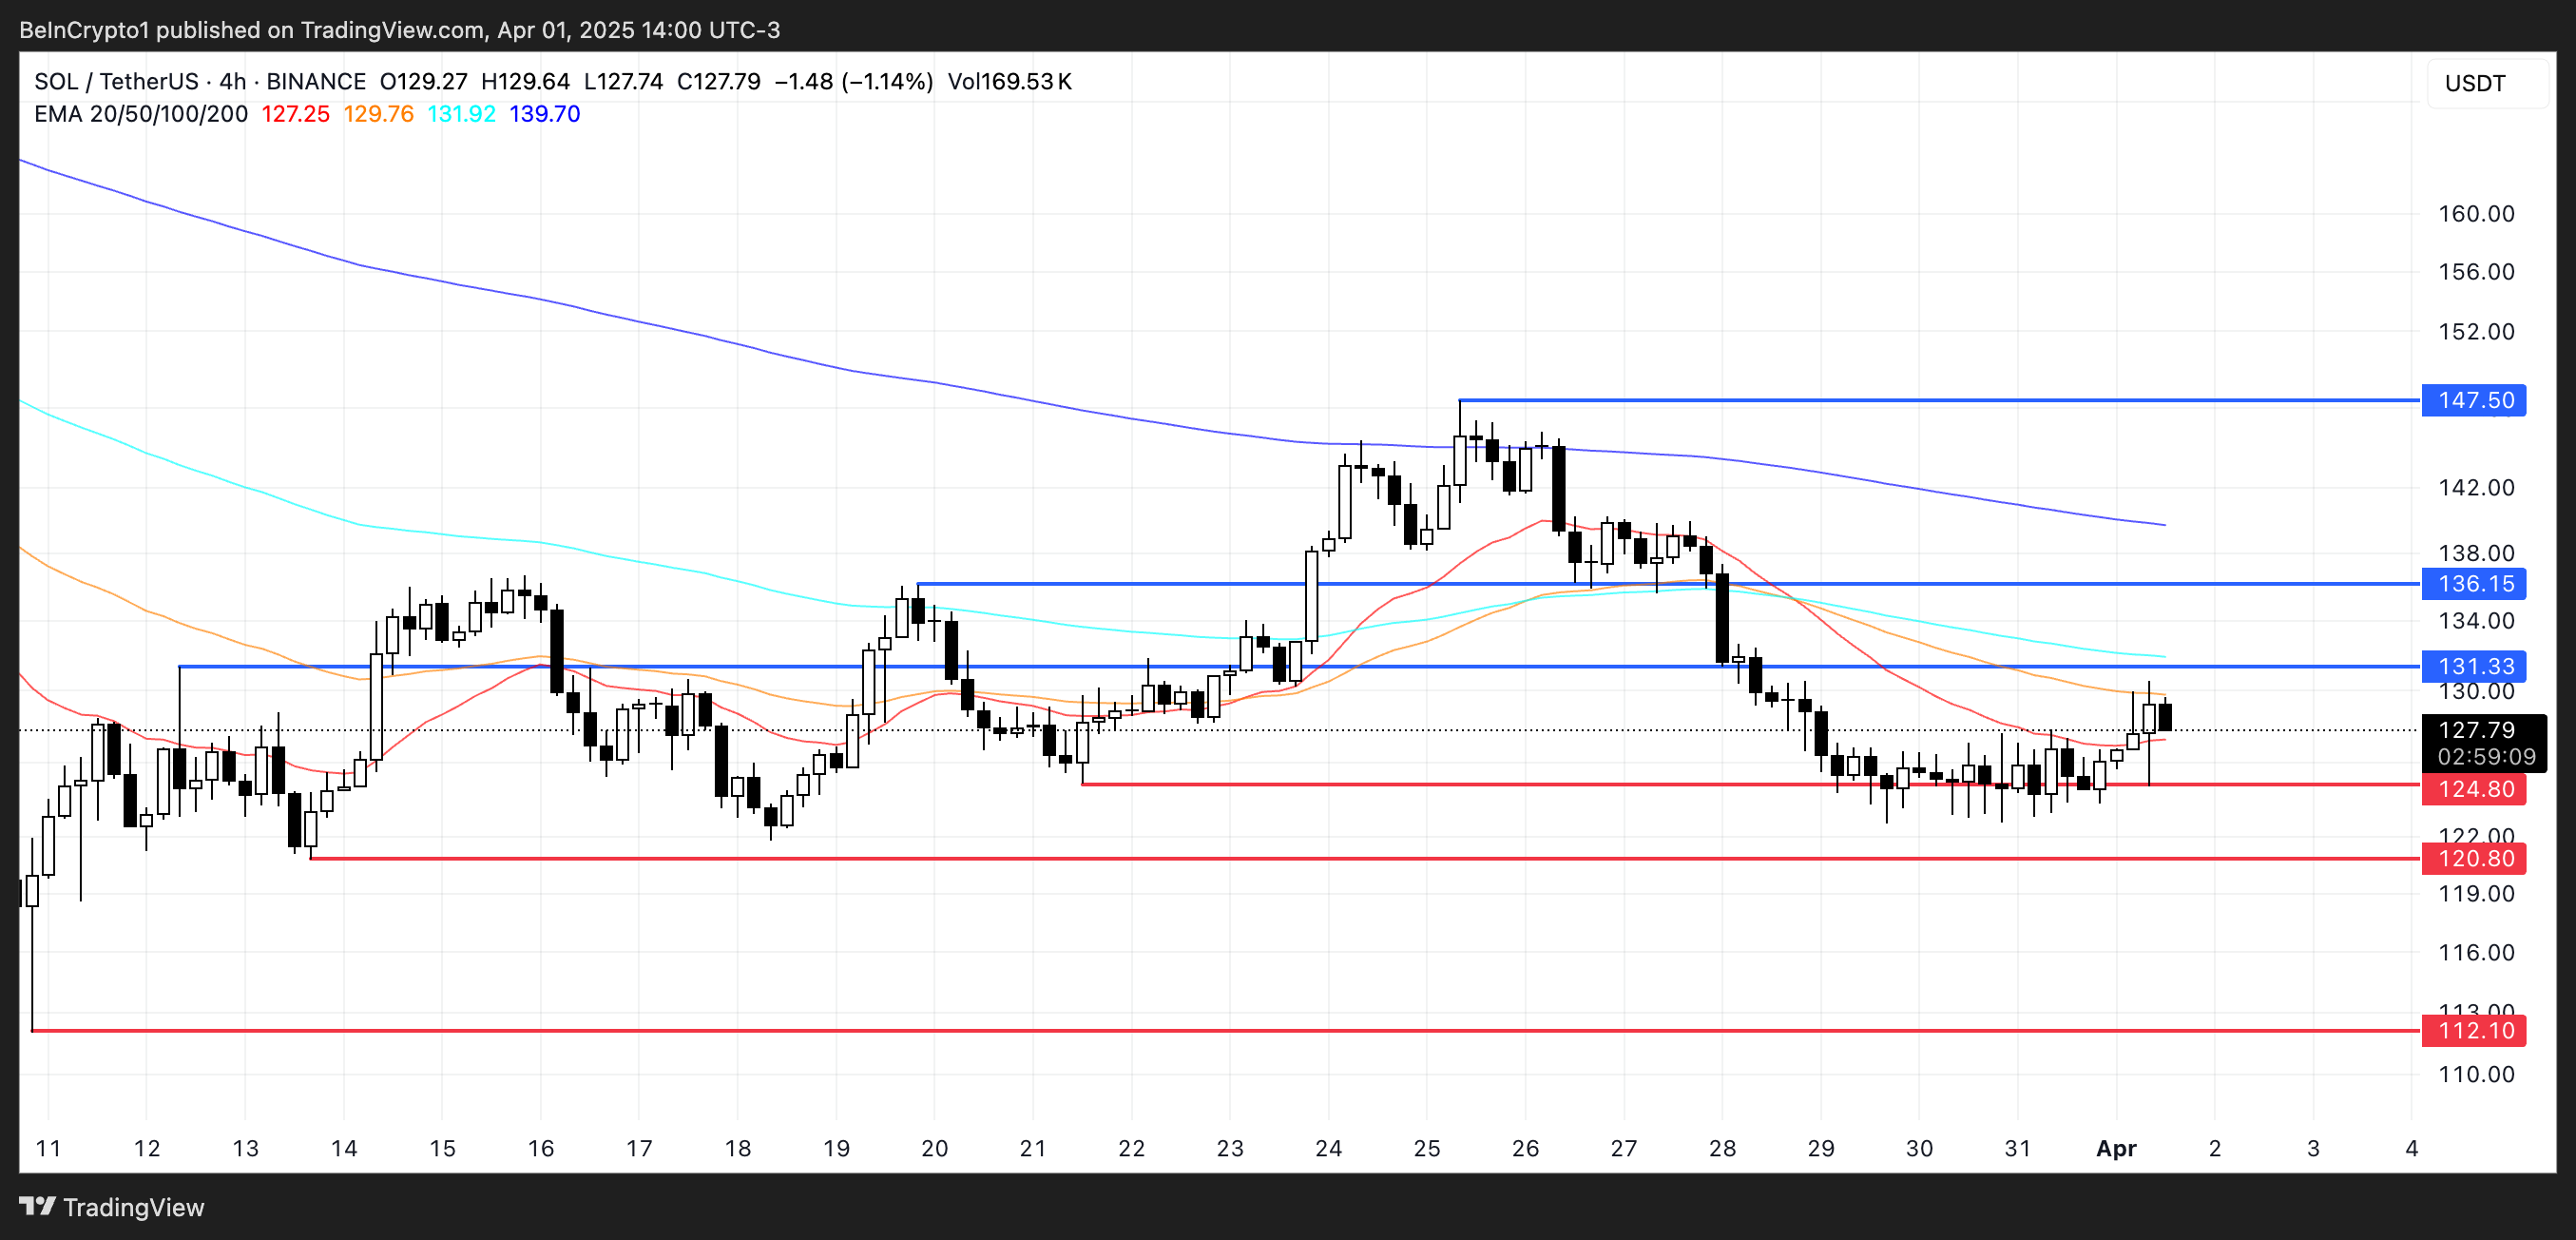
However, downside risks remain if buyers fail to hold recent gains.
If SOL pulls back and loses the key support at $124, it could trigger further selling pressure, pushing the price down to $120.
Should the downtrend gain strength from there, SOL might revisit deeper support levels around $112.
Disclaimer
In line with the Trust Project guidelines, this price analysis article is for informational purposes only and should not be considered financial or investment advice. BeInCrypto is committed to accurate, unbiased reporting, but market conditions are subject to change without notice. Always conduct your own research and consult with a professional before making any financial decisions. Please note that our Terms and Conditions, Privacy Policy, and Disclaimers have been updated.
SUI Price Stalls After Major $147 Million Token Unlock

Bitcoin Could Serve as Inflation Hedge or Tech Stock, Say Experts

Circle Files for IPO

Solana Faces Resistance While ETH Sees DEX Volume Boost

Hill Rejects Interest-Bearing Stablecoins Despite Armstrong’s Wish

How Did UPCX Lose $70 Million in a UPC Hack?

2.52 Million Altcoins Are Ruining Crypto’s Future

Animoca Brands Valuation Tanks 75% In Two Years, Here’s Why

Crypto exchange BingX hacked for $43 million

Are The Big Players Losing Interest?

Hong Kong’s Securities Association Tips Authorities On Crypto Self-Regulation

Coinbase cbBTC Set to go Live on Solana
2.52 Million Altcoins Are Ruining Crypto’s Future
Animoca Brands Valuation Tanks 75% In Two Years, Here’s Why
Crypto exchange BingX hacked for $43 million
Are The Big Players Losing Interest?
Hong Kong’s Securities Association Tips Authorities On Crypto Self-Regulation
Coinbase cbBTC Set to go Live on Solana
-

 Market23 hours ago
Cardano (ADA) Whales Hit 2-Year Low as Key Support Retested
-
 Altcoin18 hours ago
A Make or Break Situation As Ripple Crypto Flirts Around $2
-

 Market17 hours ago
XRP Bulls Fight Back—Is a Major Move Coming?
-
 Market16 hours ago
Is CZ’s April Fool’s Joke a Crypto Reality or Just Fun?
-

 Market15 hours ago
Bitcoin Price Battles Key Hurdles—Is a Breakout Still Possible?
-

 Bitcoin13 hours ago
Big Bitcoin Buy Coming? Saylor Drops a Hint as Strategy Shifts
-

 Market22 hours ago
Top 3 Made in USA Coins to Watch In April
-

 Market20 hours ago
Ethereum Price Faces a Tough Test—Can It Clear the Hurdle?