
Market
5 Meme Coins to Watch in April 2025

With the end of March, Q1 2025 is also coming to a conclusion. This quarter was not the best for the crypto market, with its excessive losses and extreme volatility, similar to how meme coins operate.
Discussing the bane of the meme coin market, Harrison Seletsky, the Director Of Business Development at Digital Identity Platform SPACE ID, talked about the role of a strong investor base.
“Hype can move the price of a memecoin up, but they also collapse just as fast if there is no interest to sustain them, which is usually the case. That’s why it’s so important to filter out the noise as much as possible,” Seletsky noted.
Thus, BeInCrypto has analyzed five meme coins that have stood the test of time and volatility and are preparing for further gains in April.
Fartcoin (FARTCOIN)
FARTCOIN has emerged as one of the top-performing meme coins this month, rising 107% to trade at $0.61. This impressive increase has allowed the meme coin to recover all the losses it faced in March and February.
To recover its January losses, FARTCOIN will need to continue its upward momentum. The key resistance level to watch is $0.69. A successful break above this level and a move toward $1.00 could signal the beginning of a sustained rally, potentially pushing the price higher in the coming days.
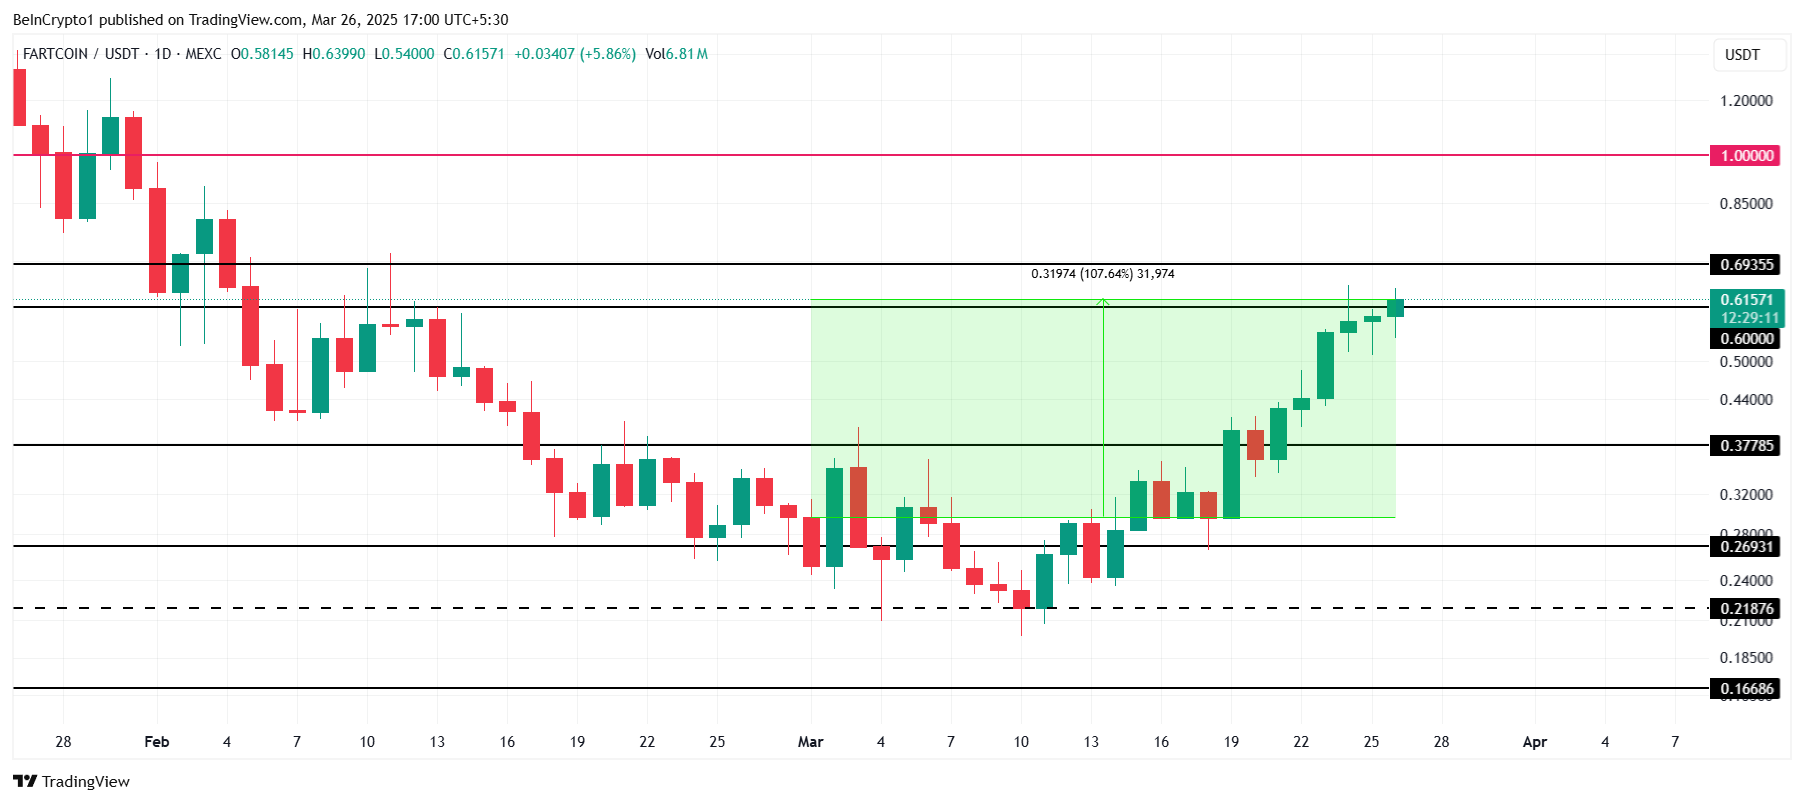
However, if FARTCOIN fails to hold $0.69 as support and misses the $1.00 target, it could face a sharp decline. A drop back to $0.37 would erase much of the recent gains, invalidating the bullish outlook. This pullback could shift investor sentiment towards caution, stalling further growth.
Cheems (CHEEMS)
CHEEMS has emerged as one of the top-performing meme coins this month, rising 130% since the beginning of March. Currently trading at $0.000001927, the altcoin has also posted a new all-time high (ATH) of $0.000002179.
The shift in broader market cues toward recovery has likely sparked newfound interest among CHEEMS investors. If the positive trend continues, the meme coin could push toward $0.000002500, further fueling its rally.
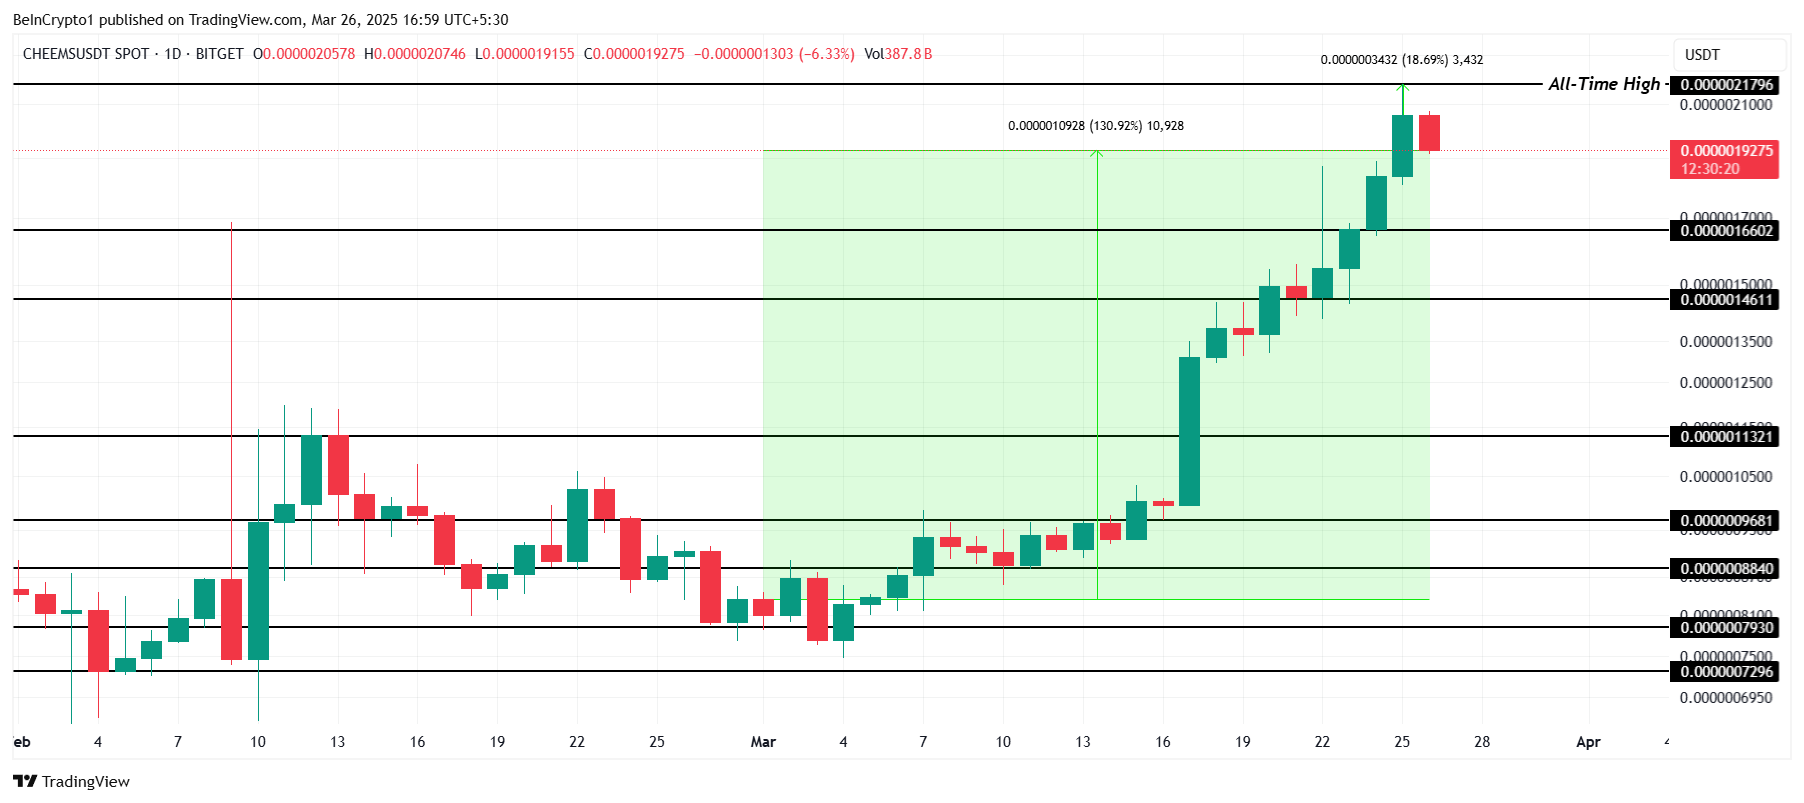
However, if the bullish signals begin to fade or if investors start selling their holdings, CHEEMS could face downward pressure. A fall toward the support level of $0.000001660 or lower would invalidate the bullish outlook. This potential decline could halt the altcoin’s growth and shift market sentiment.
Mubarak (MUBARAK)
MUBARAK launched this month and has already experienced notable volatility. The meme coin is up 95% since its launch, with the current all-time high (ATH) at $0.221. This strong early performance reflects investor optimism and a positive market reception for altcoin’s entry into the crypto space.
Currently trading at $0.145, MUBARAK is aiming to break through the resistance levels at $0.149 and $0.173. Successfully clearing these levels would likely lead to a new ATH beyond $0.221. Such a breakthrough would demonstrate continued bullish momentum and attract more investors to the altcoin.
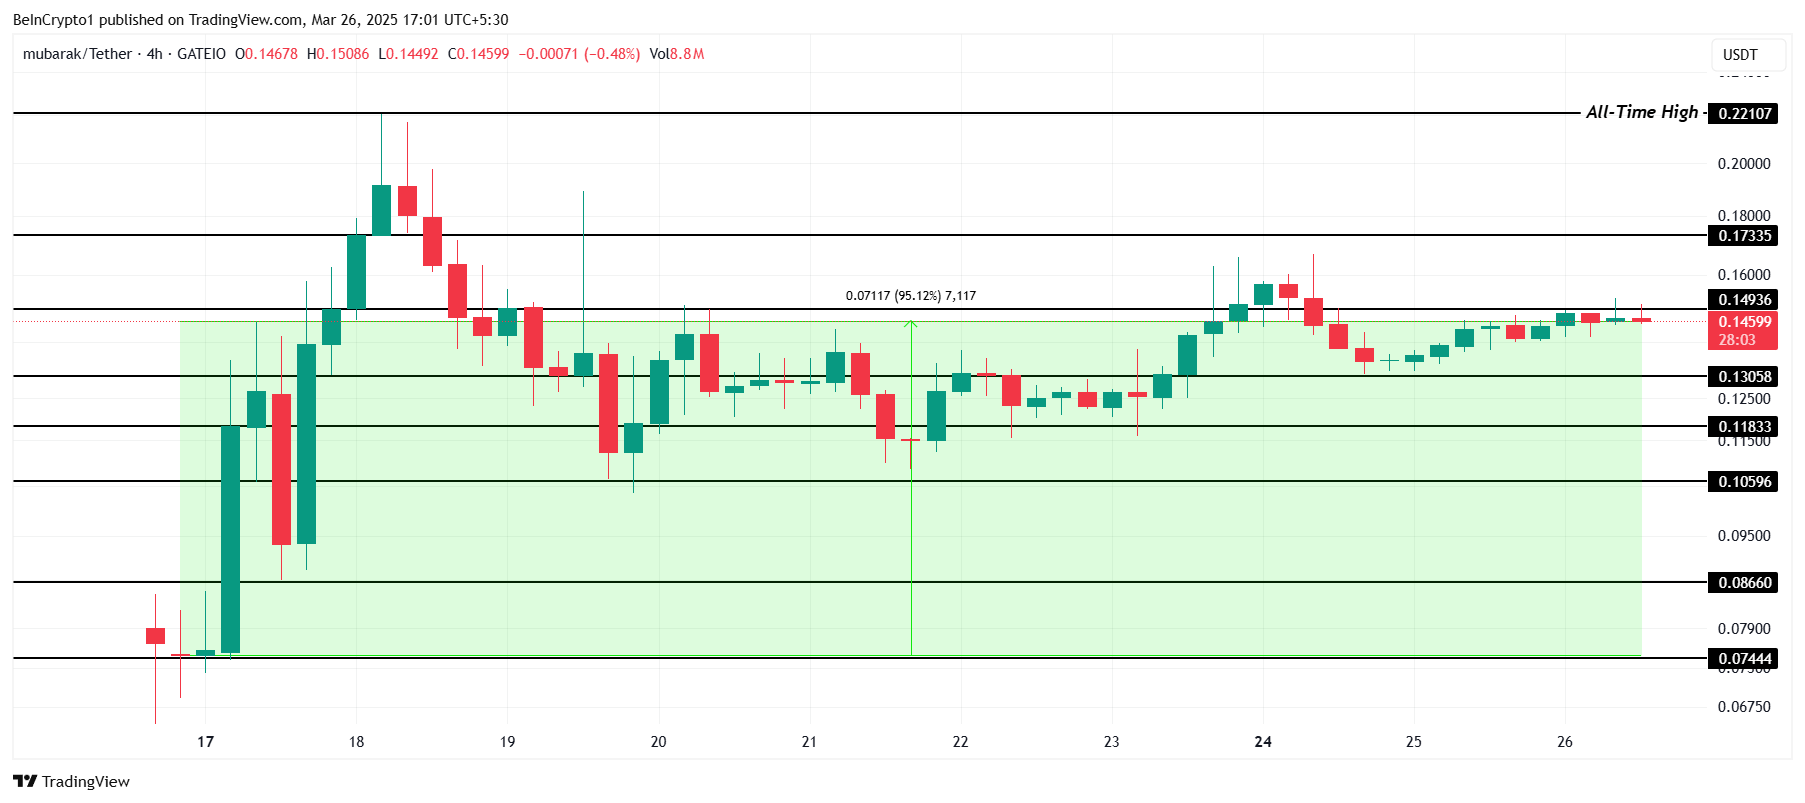
However, if MUBARAK fails to capture sufficient investor attention, the price could dip to $0.130. A further decline could push the altcoin down to $0.118 or $0.105, invalidating the bullish outlook. Such a drop would signal weakening market sentiment and potential setbacks for MUBARAK’s growth.
Dogecoin (DOGE)
Dogecoin has not registered exceptional gains this month but managed to break out of a two-month downtrend. The altcoin rose 22% in a week, trading at $0.203. This recent upward movement signals a potential shift in market sentiment, suggesting that Dogecoin could see more positive momentum.
Given the current market conditions, Dogecoin is likely to continue its gradual uptrend. This momentum could help the altcoin breach the $0.220 resistance and move toward $0.267. If this upward trend continues, Dogecoin could see sustained growth and attract additional investor interest.
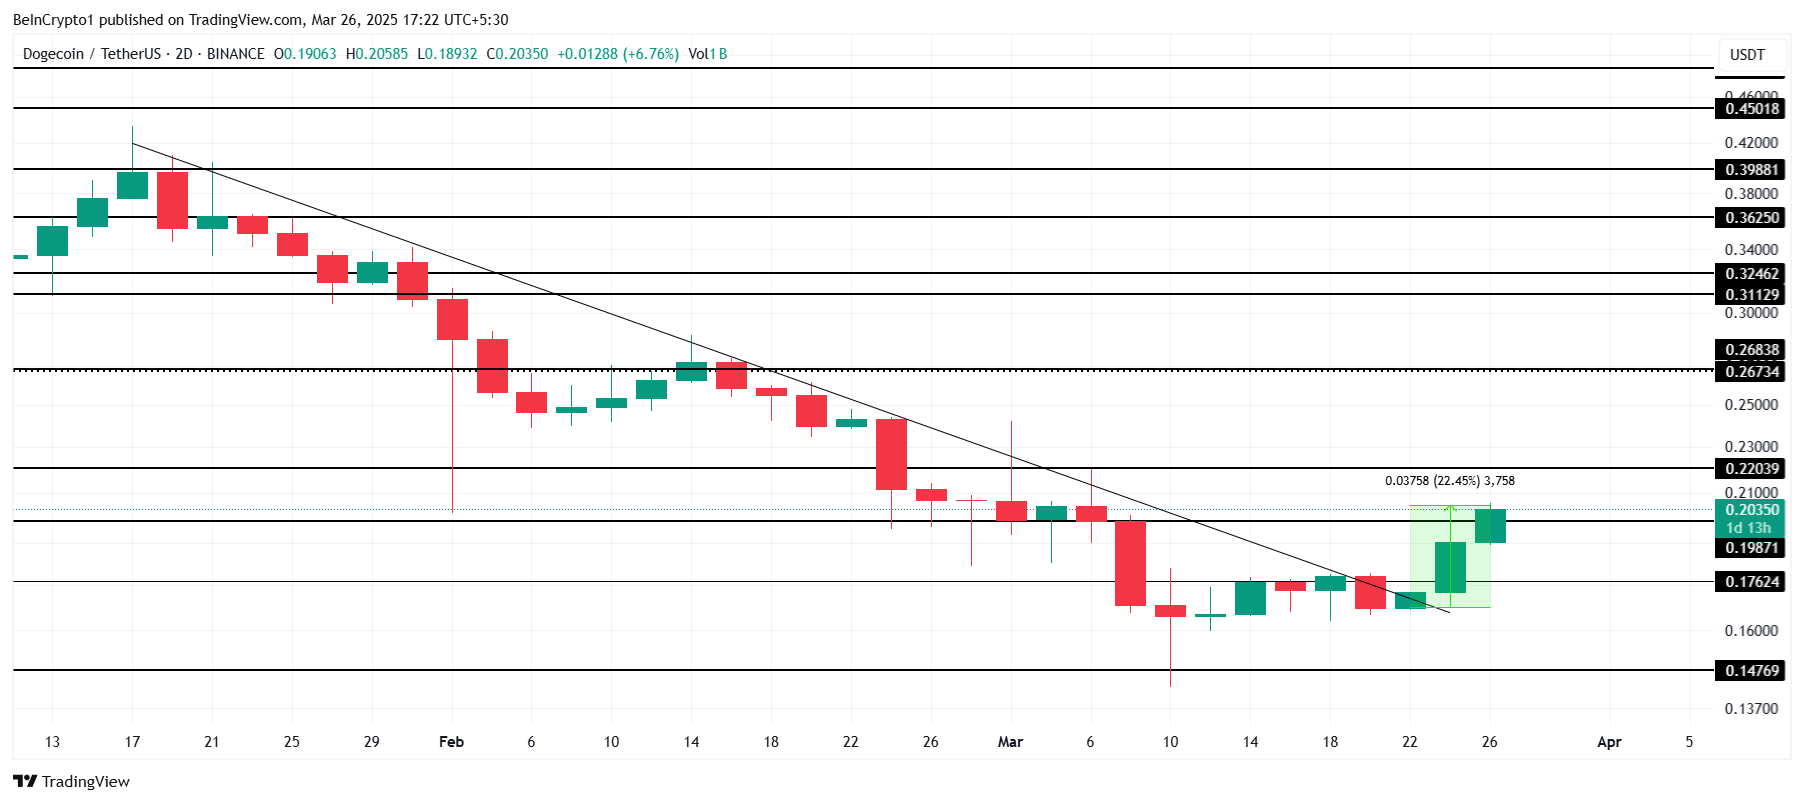
However, if Dogecoin fails to breach the $0.220 level, the price may struggle to maintain its upward movement. A failure to hold above this level could lead to a drop toward $0.176 or even $0.147, invalidating the bullish outlook and potentially extending the losses experienced by the altcoin.
Peanut The Squirrel (PNUT)
PNUT has experienced a 17% loss this month but is closer to recovering its losses. Currently trading at $0.221, the meme coin is beginning to show signs of recovery. The altcoin’s recent price movement signals that it may be positioned for potential growth if market conditions improve.
The primary target for PNUT is to breach the $0.260 resistance and flip it into a support level. If successful, this would pave the way for the meme coin to reach the next key resistance at $0.330. A move above $0.260 would signal further bullish momentum for PNUT.
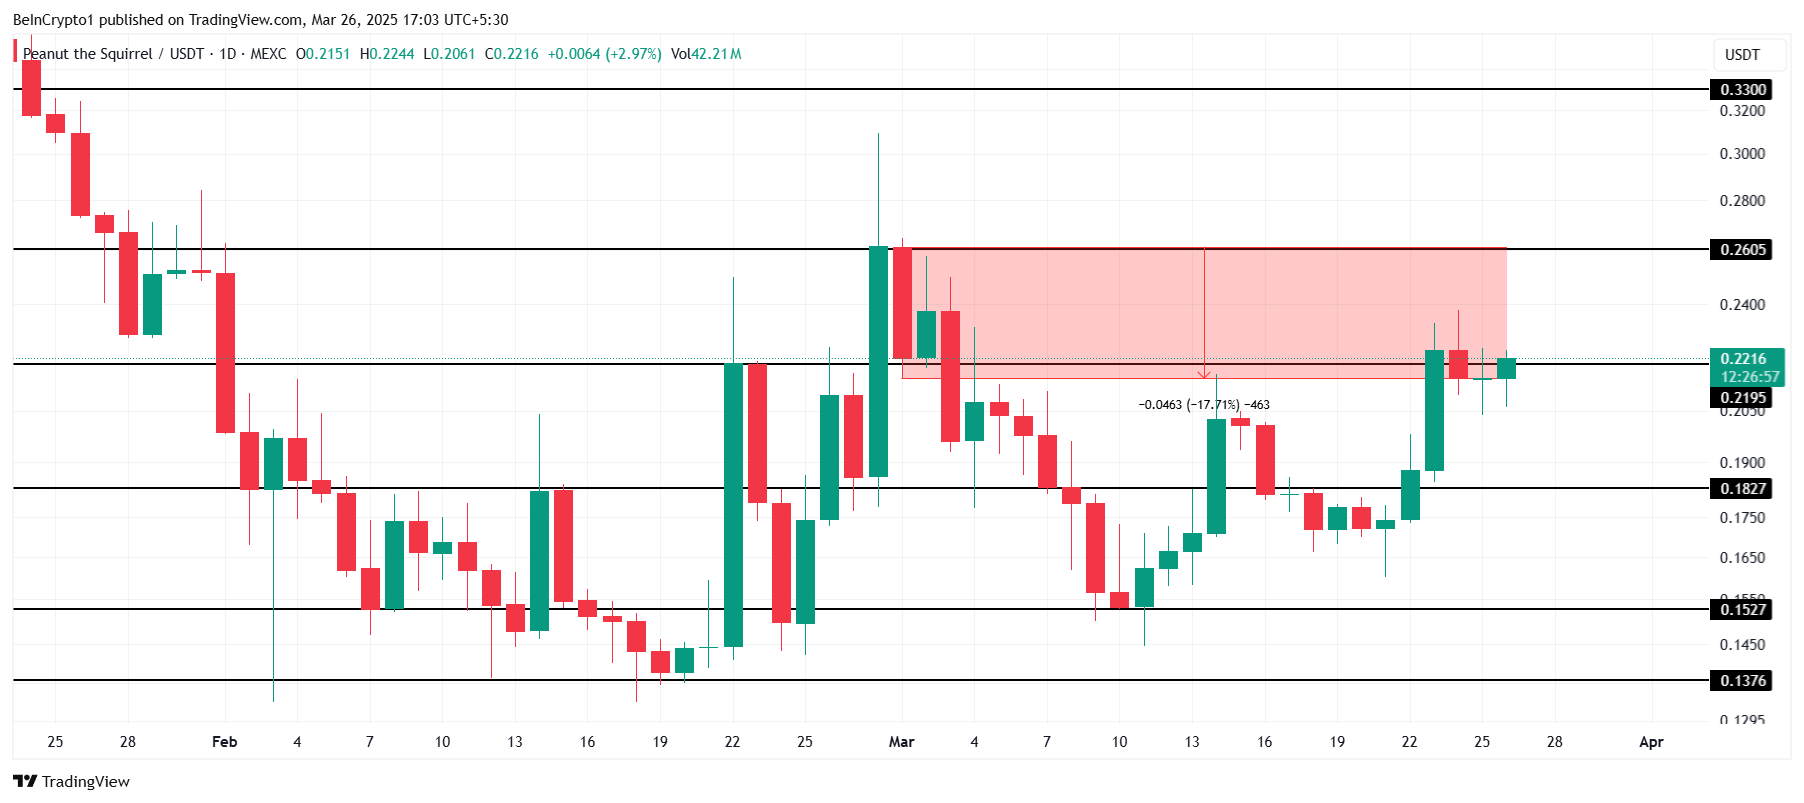
However, if PNUT fails to breach $0.260 and the price struggles to hold, it could fall back to $0.219. A further drop to $0.182 would invalidate the bullish outlook, erasing recent gains and potentially setting the stage for a prolonged downtrend.
Disclaimer
In line with the Trust Project guidelines, this price analysis article is for informational purposes only and should not be considered financial or investment advice. BeInCrypto is committed to accurate, unbiased reporting, but market conditions are subject to change without notice. Always conduct your own research and consult with a professional before making any financial decisions. Please note that our Terms and Conditions, Privacy Policy, and Disclaimers have been updated.


Cardano (ADA) is facing mounting pressure as its price corrects by 10% over the past seven days, continuing a broader downtrend that has kept it trading below the $1 mark for nearly a month. With technical indicators flashing warning signs and large holders exiting their positions, concerns around ADA’s short-term stability are growing.
The recent rejection at higher resistance levels and a strong directional trend signal suggest that bearish momentum is far from over. As the $0.64 support level is tested once again, ADA’s next move could determine whether a rebound is possible—or if further downside is ahead.
Cardano ADX Shows The Downtrend Is Very Strong
Cardano’s Average Directional Index (ADX) is currently at 40.19, rising sharply from 15.83 just four days ago. This steep increase suggests a rapid strengthening in the trend’s momentum.
Given that ADA is currently in a downtrend, the rising ADX indicates that bearish momentum is intensifying and the current downward move is gaining traction.
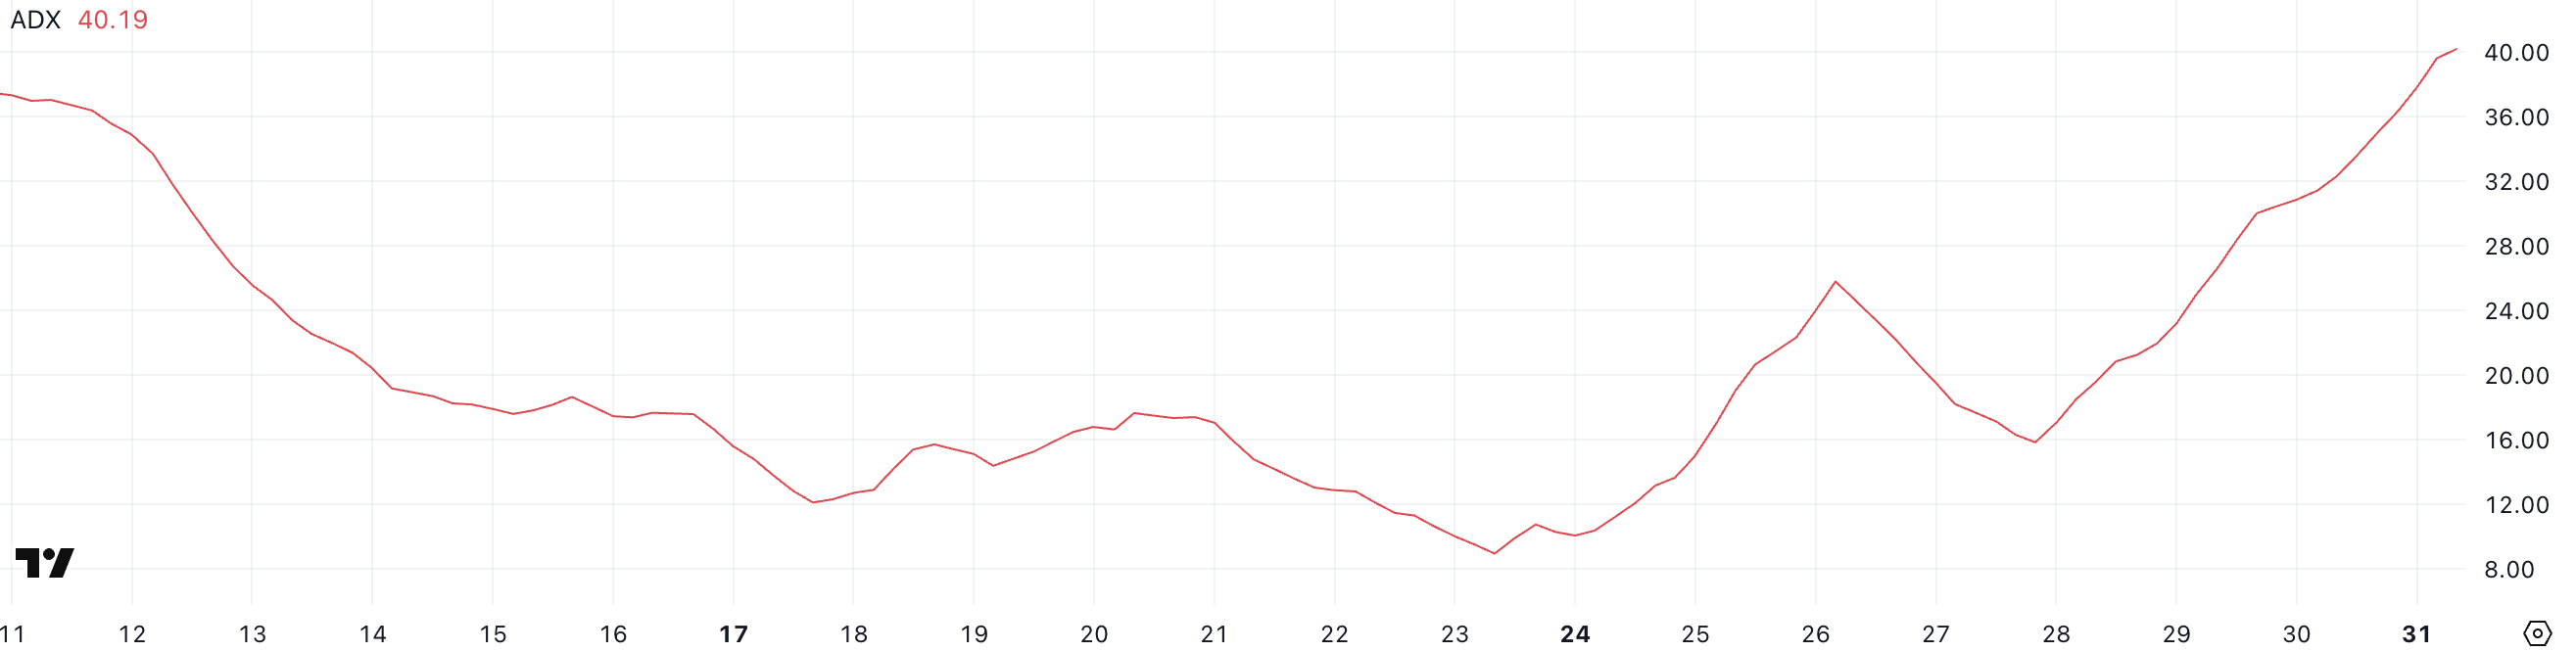
The ADX is a trend strength indicator that measures how strong a trend is, regardless of its direction. It ranges from 0 to 100, with readings below 20 typically indicating a weak or non-existent trend, while values above 25 suggest a strong trend is in place.
Cardano’s ADX climbing above 40 confirms that the current downtrend is active and becoming stronger. If this trend continues, it may point to further downside pressure unless a shift in momentum begins to build from the bulls.
ADA Whales Dropped To Their Lowest Level Since February 2023
The number of Cardano whales—wallets holding between 1 million and 10 million ADA—has dropped to 2,406, down from 2,421 just four days ago.
This decline brings the whale count to its lowest level since February 2023, marking a potentially meaningful shift in large-holder behavior. These movements are worth paying attention to, as changes in whale holdings often precede broader market trends.
Tracking whales is important because these large holders can significantly influence price action through their buying or selling decisions. A decline in whale numbers can signal reduced confidence or capital rotation into other assets.
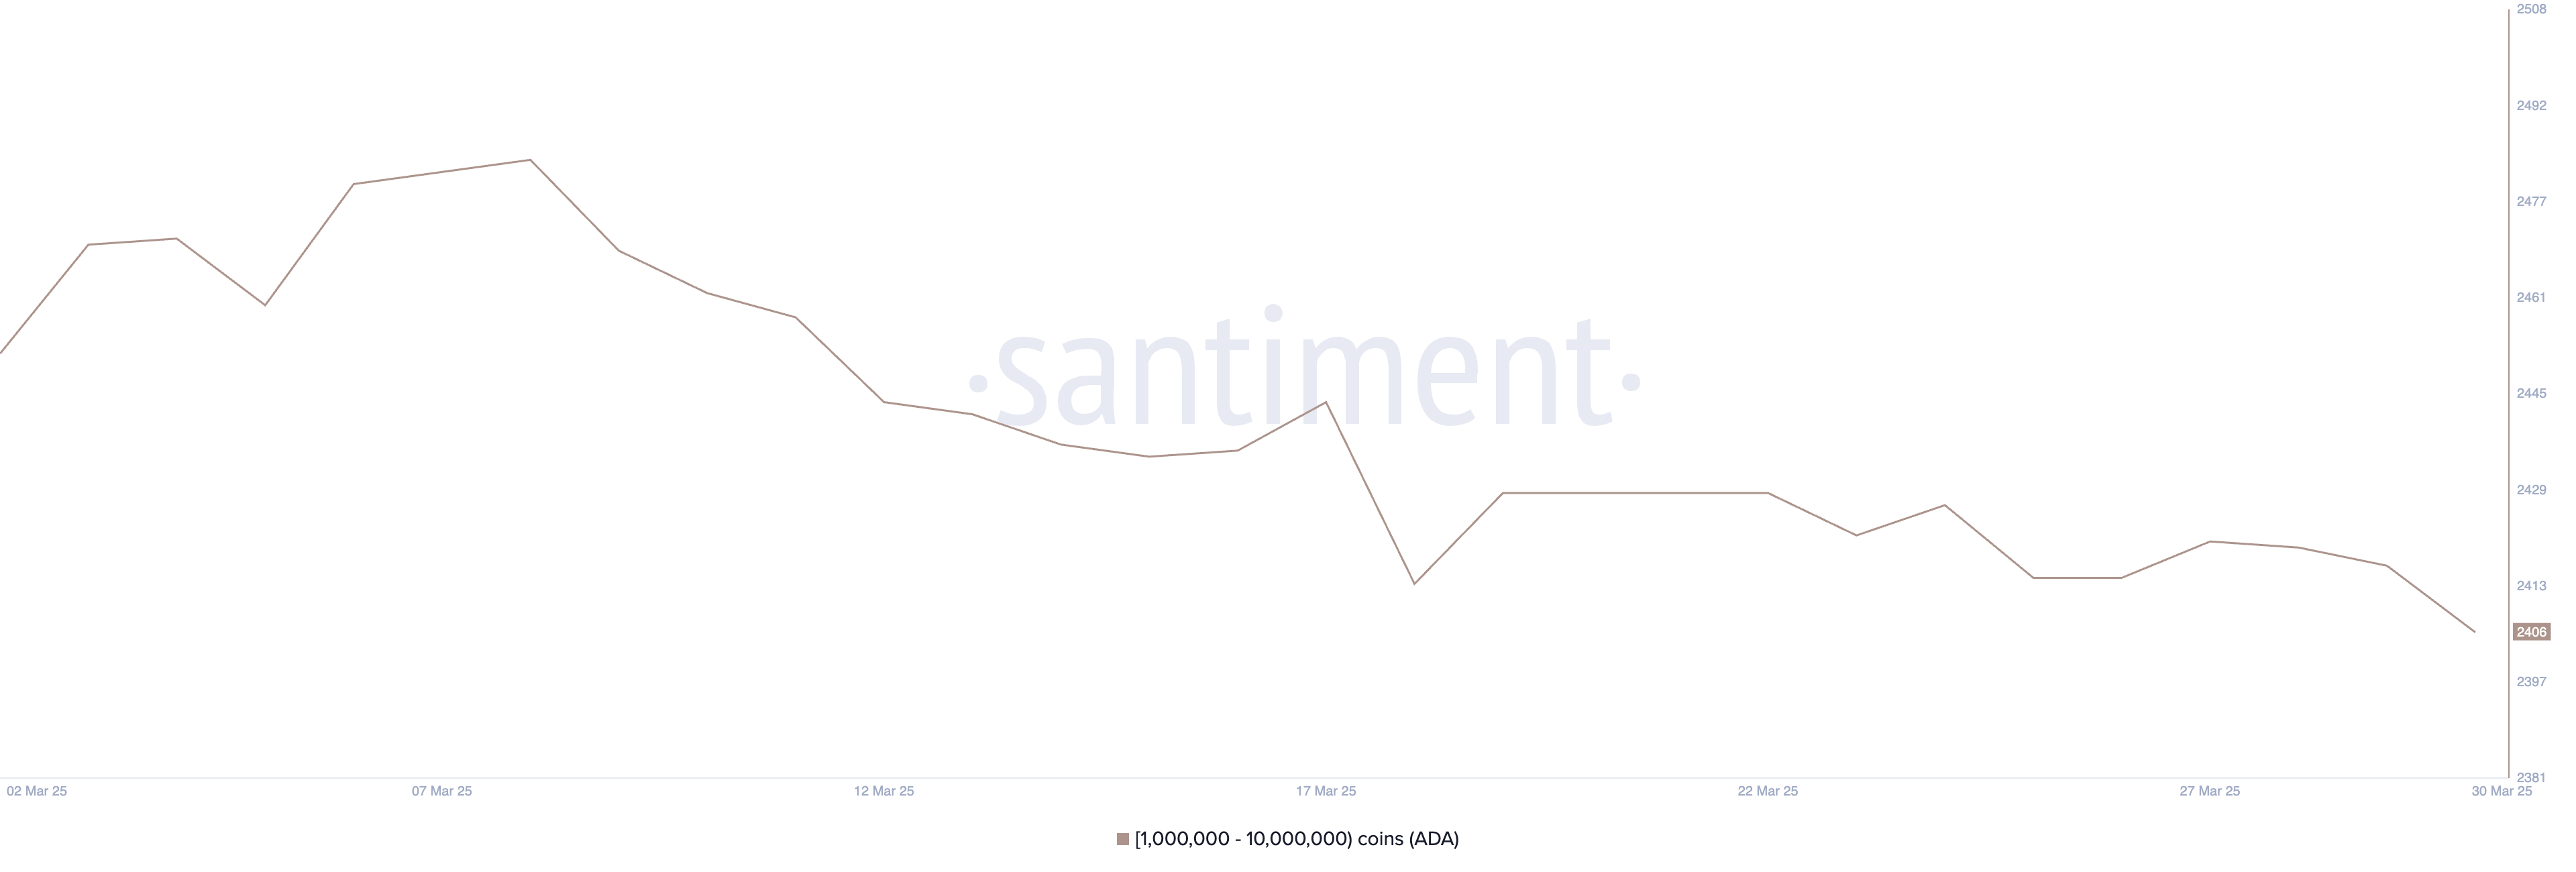
In Cardano’s case, the drop suggests that some major players may be exiting or reducing exposure, which could add downward pressure to ADA’s price.
If this trend continues, it could weaken investor sentiment and make it harder for ADA to recover in the short term.
Can Cardano Sustain The $0.64 Support Again?
Cardano price recently tested the support level at $0.64 and managed to hold, showing that buyers are still defending that zone. This support has become a key line in the sand for ADA’s short-term outlook.
If the current downtrend is reversed and bullish momentum picks up, the next upside target would be the resistance at $0.69. A breakout above that level could open the door for a push toward $0.77.
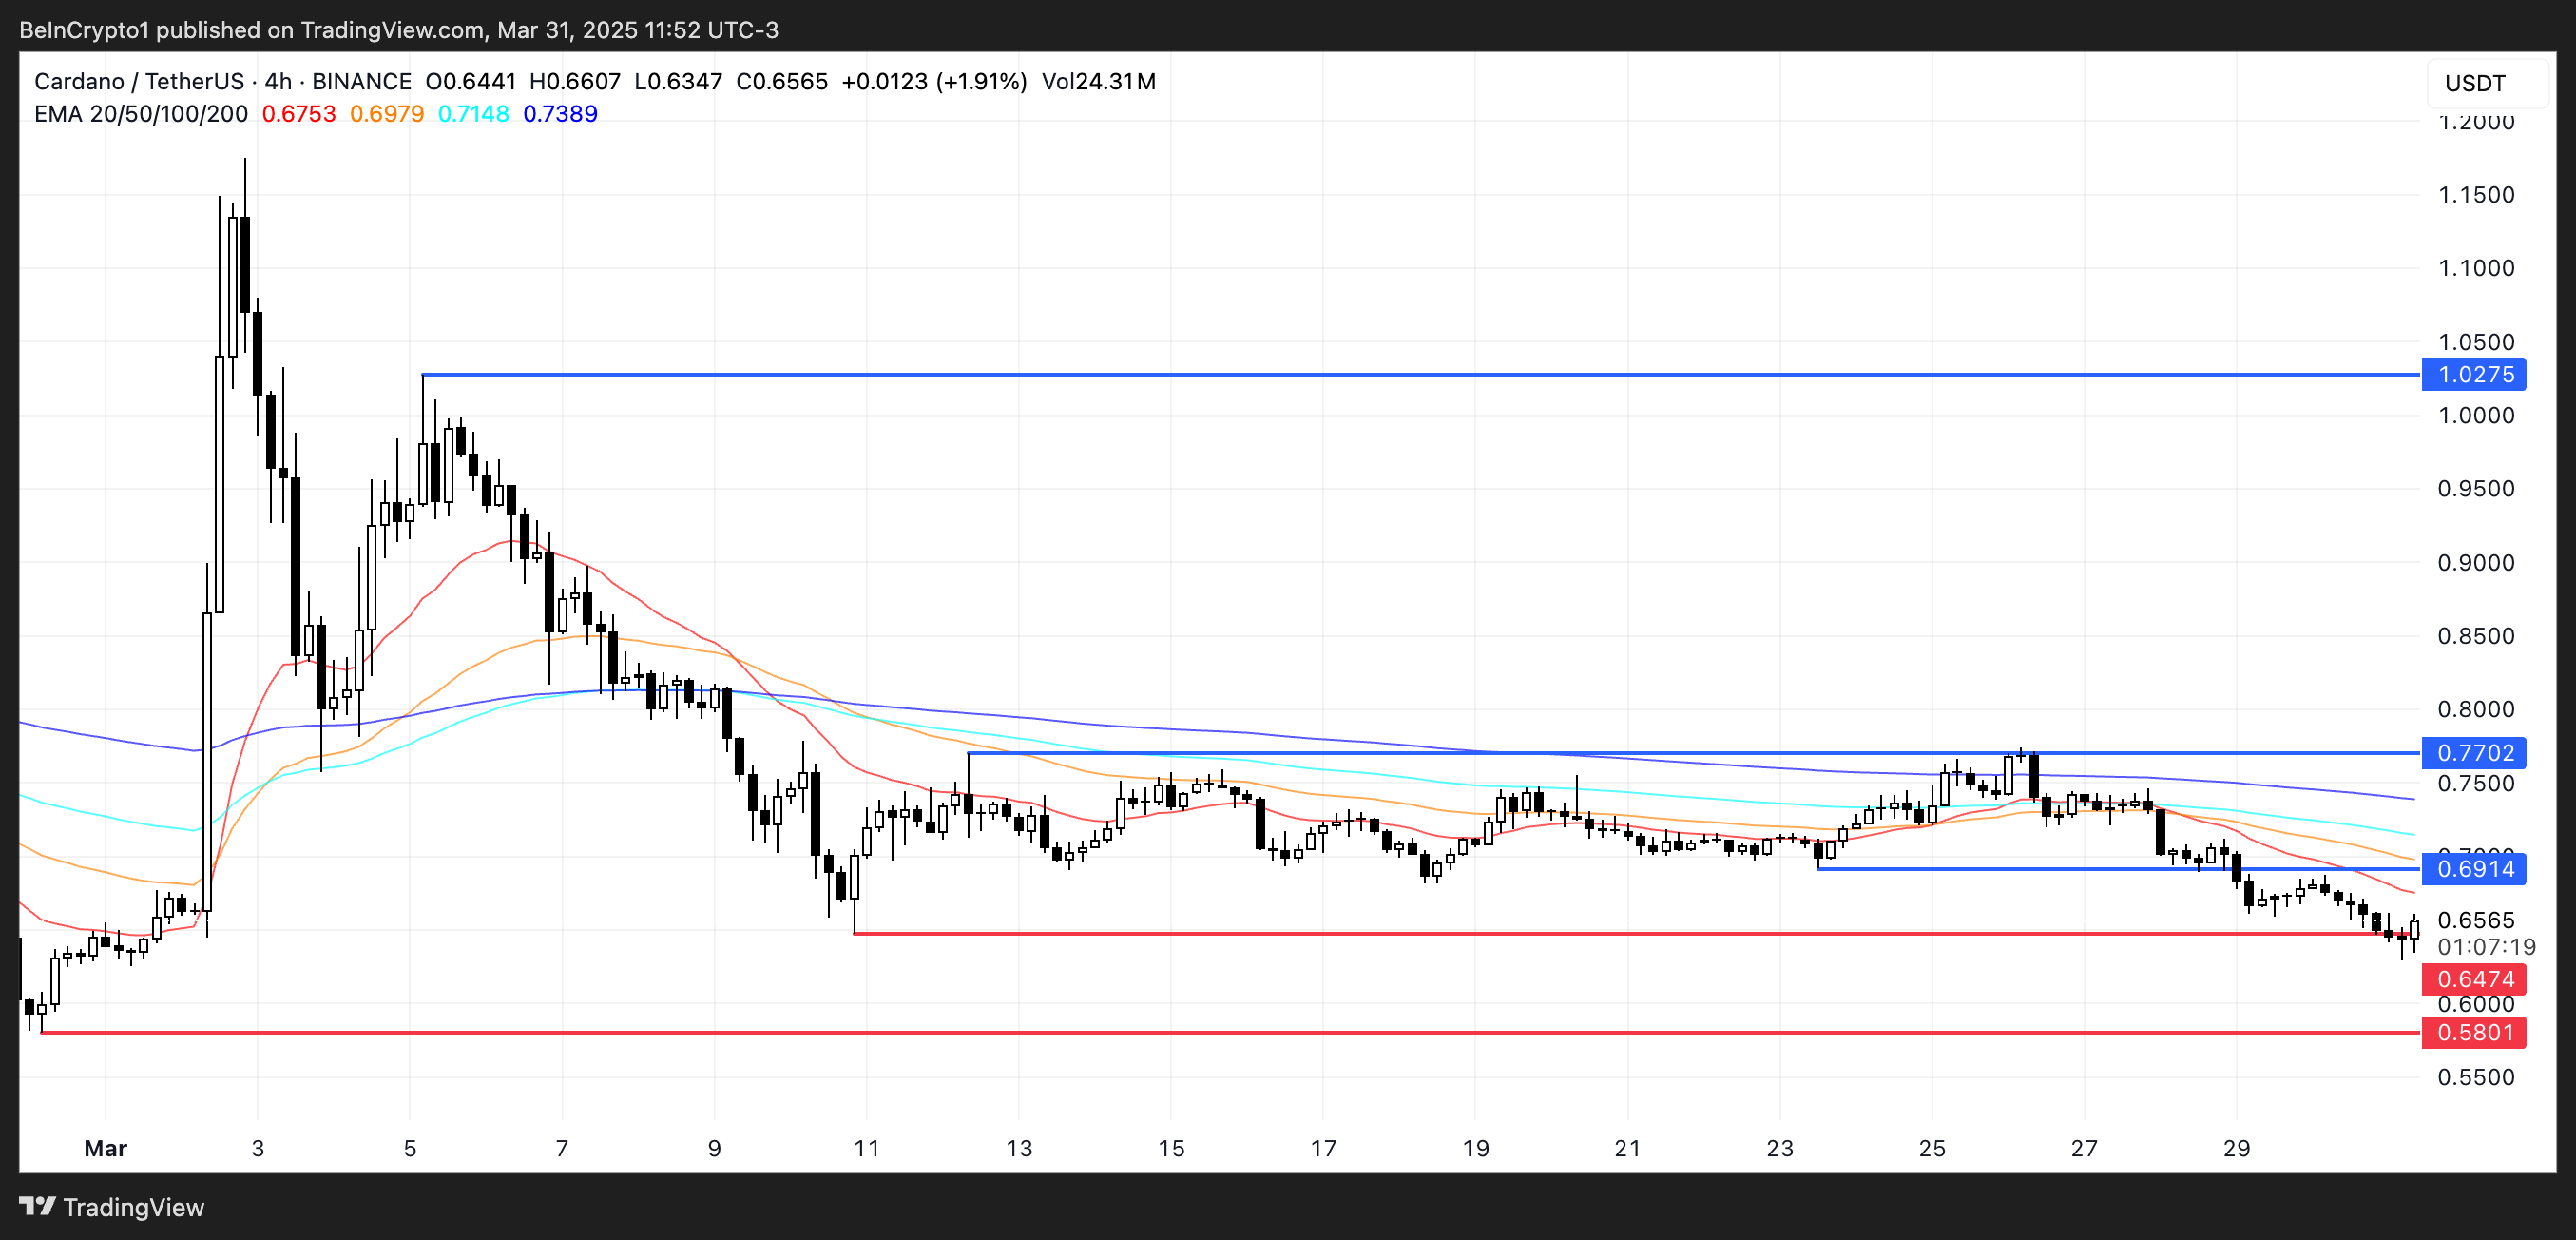
Should the rally continue with strength, ADA could aim for $1.02—marking a return above the $1 level for the first time since early March.
However, the $0.64 support remains a critical level to watch. If Cardano tests it again and fails to hold, it could indicate weakening buyer conviction.
A breakdown below $0.64 would likely send ADA toward the next support at $0.58. This would confirm a continuation of the downtrend and possibly trigger further selling pressure.
Disclaimer
In line with the Trust Project guidelines, this price analysis article is for informational purposes only and should not be considered financial or investment advice. BeInCrypto is committed to accurate, unbiased reporting, but market conditions are subject to change without notice. Always conduct your own research and consult with a professional before making any financial decisions. Please note that our Terms and Conditions, Privacy Policy, and Disclaimers have been updated.

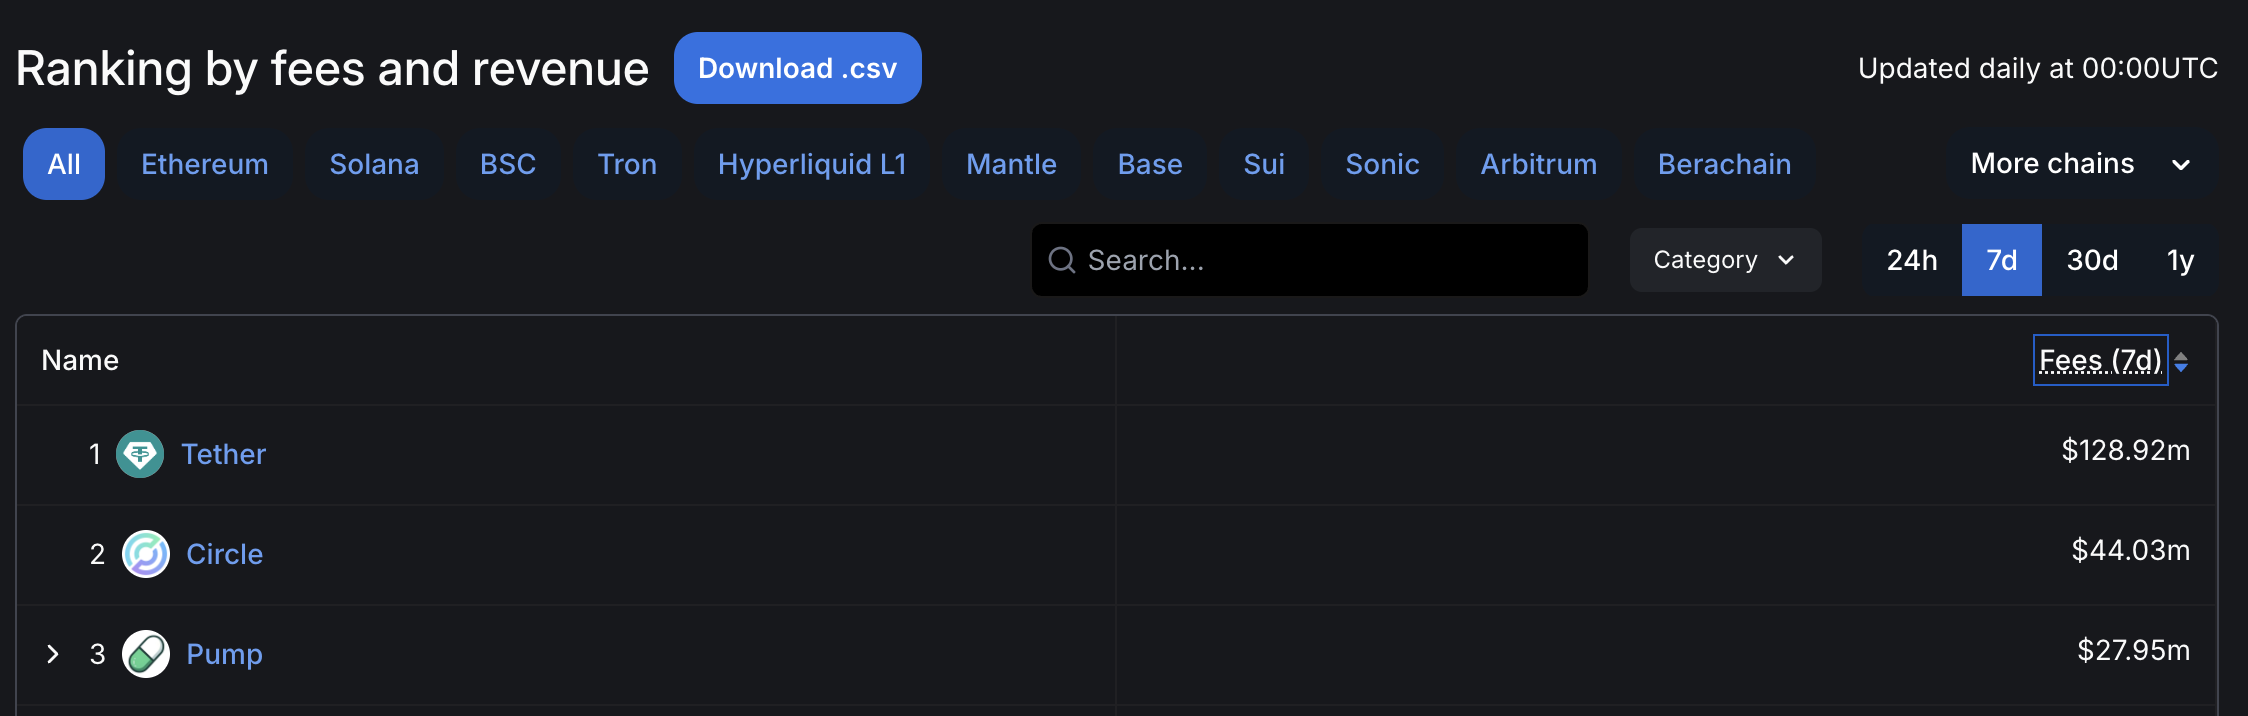
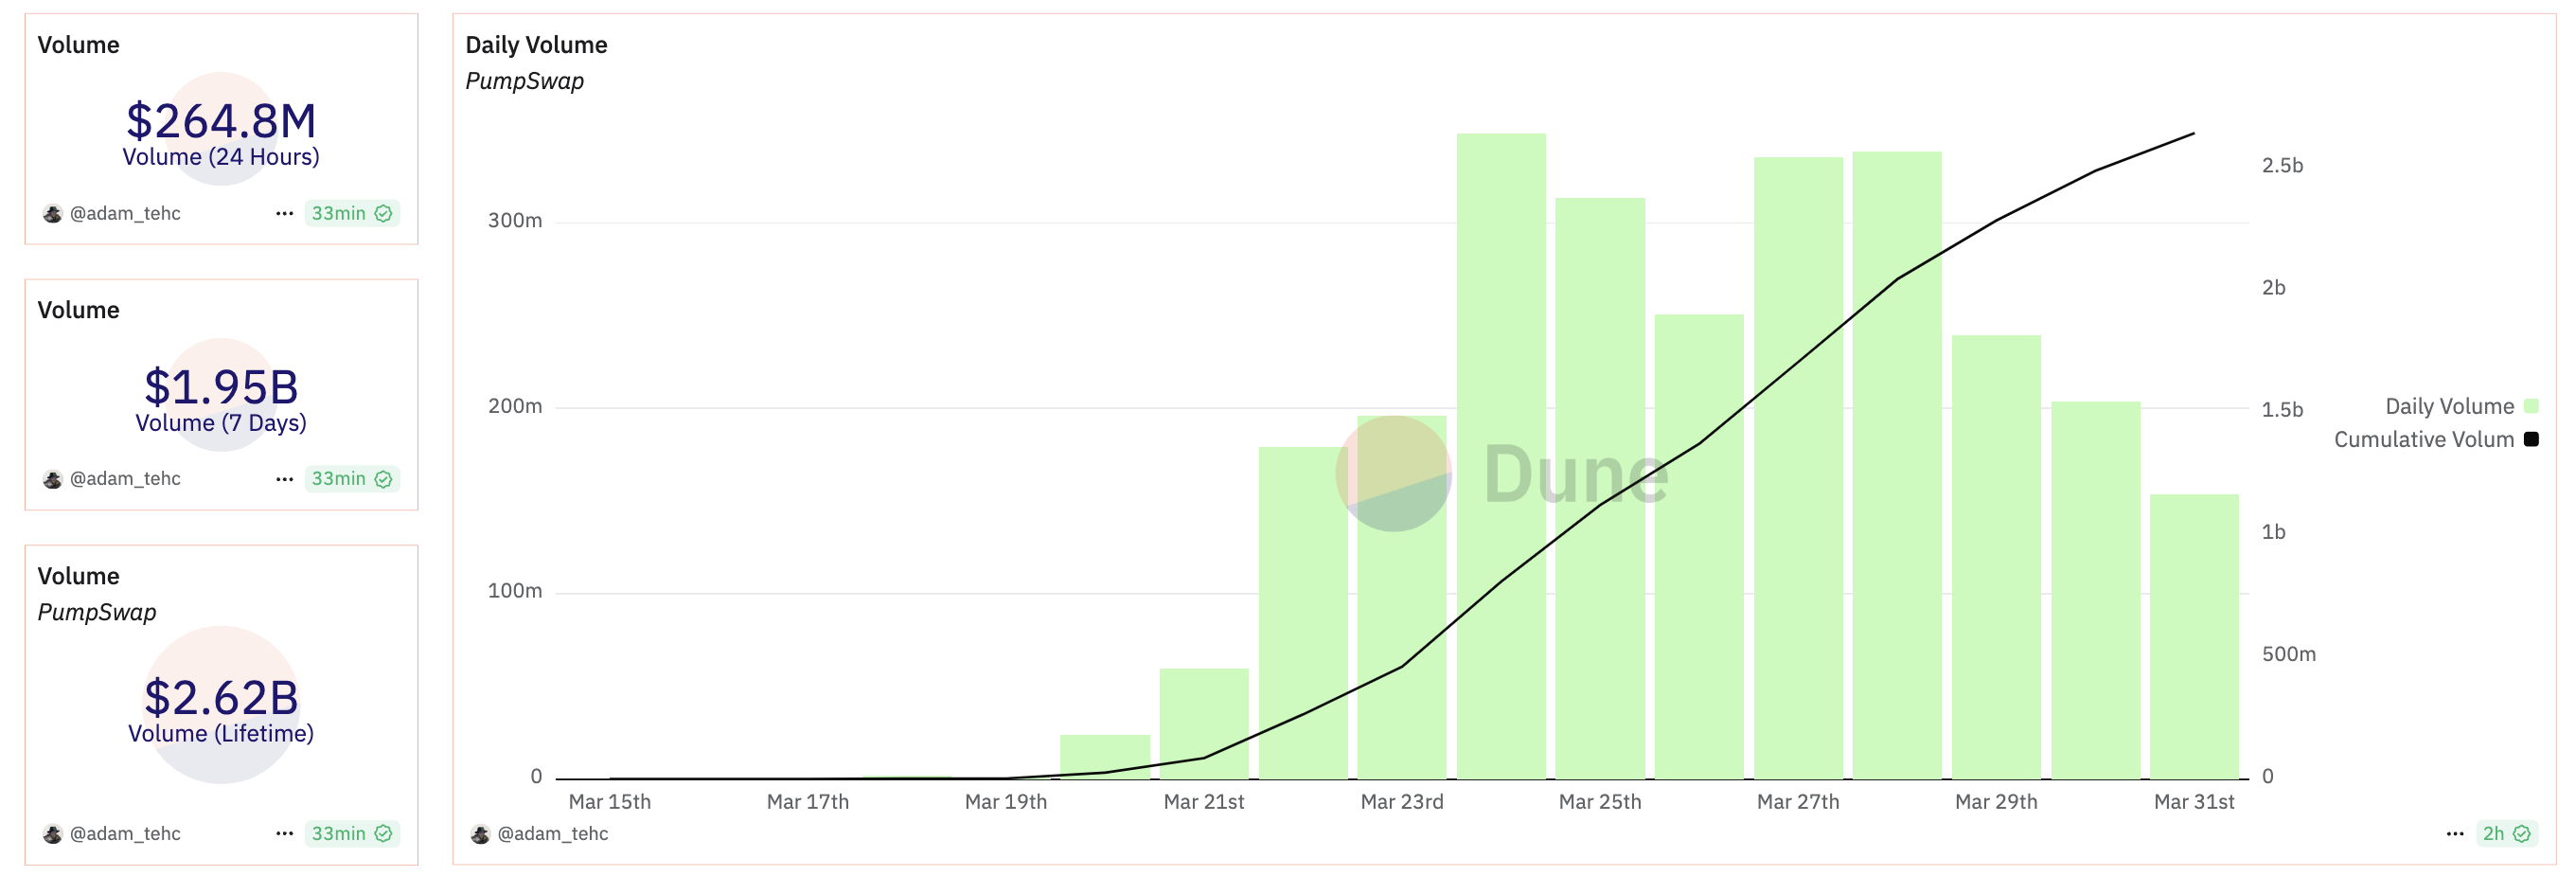
Since launching PumpSwap, token launchpad Pump.fun has resumed its position as a top-level protocol by fees and revenue. It saw over $2.62 billion in volume in less than two weeks, signifying high market interest.
Nonetheless, the meme coin sector as a whole has been more volatile than usual lately. PumpSwap is an attractive new option, but it still needs to stand the test of time.
Pump.fun Surges with PumpSwap
Pump.fun, a prominent meme coin creation platform, recently suffered some difficulties in the market. Facing lawsuits and criticism from the industry, the platform’s revenue had been declining in 2025. However, since launching PumpSwap, Pump.fun’s income has rebounded, making it one of the largest protocols by fees and revenue.
PumpSwap is a decentralized exchange on Solana’s blockchain, and it has grown very quickly since its launch less than two weeks ago. It has already managed over $2.62 billion in trade volume, although its daily volume fell over the weekend. Pump.fun’s cofounder spoke highly about PumpSwap, calling it a “crucial step that will help grow the ecosystem.”
Pump.fun’s overall revenues were declining before it launched PumpSwap, and they have since jumped back up. However, it’s important to not overstate the new exchange’s success. The exchange’s total fees collected have skyrocketed compared to Pump.fun, but the actual revenue growth has been comparatively small.
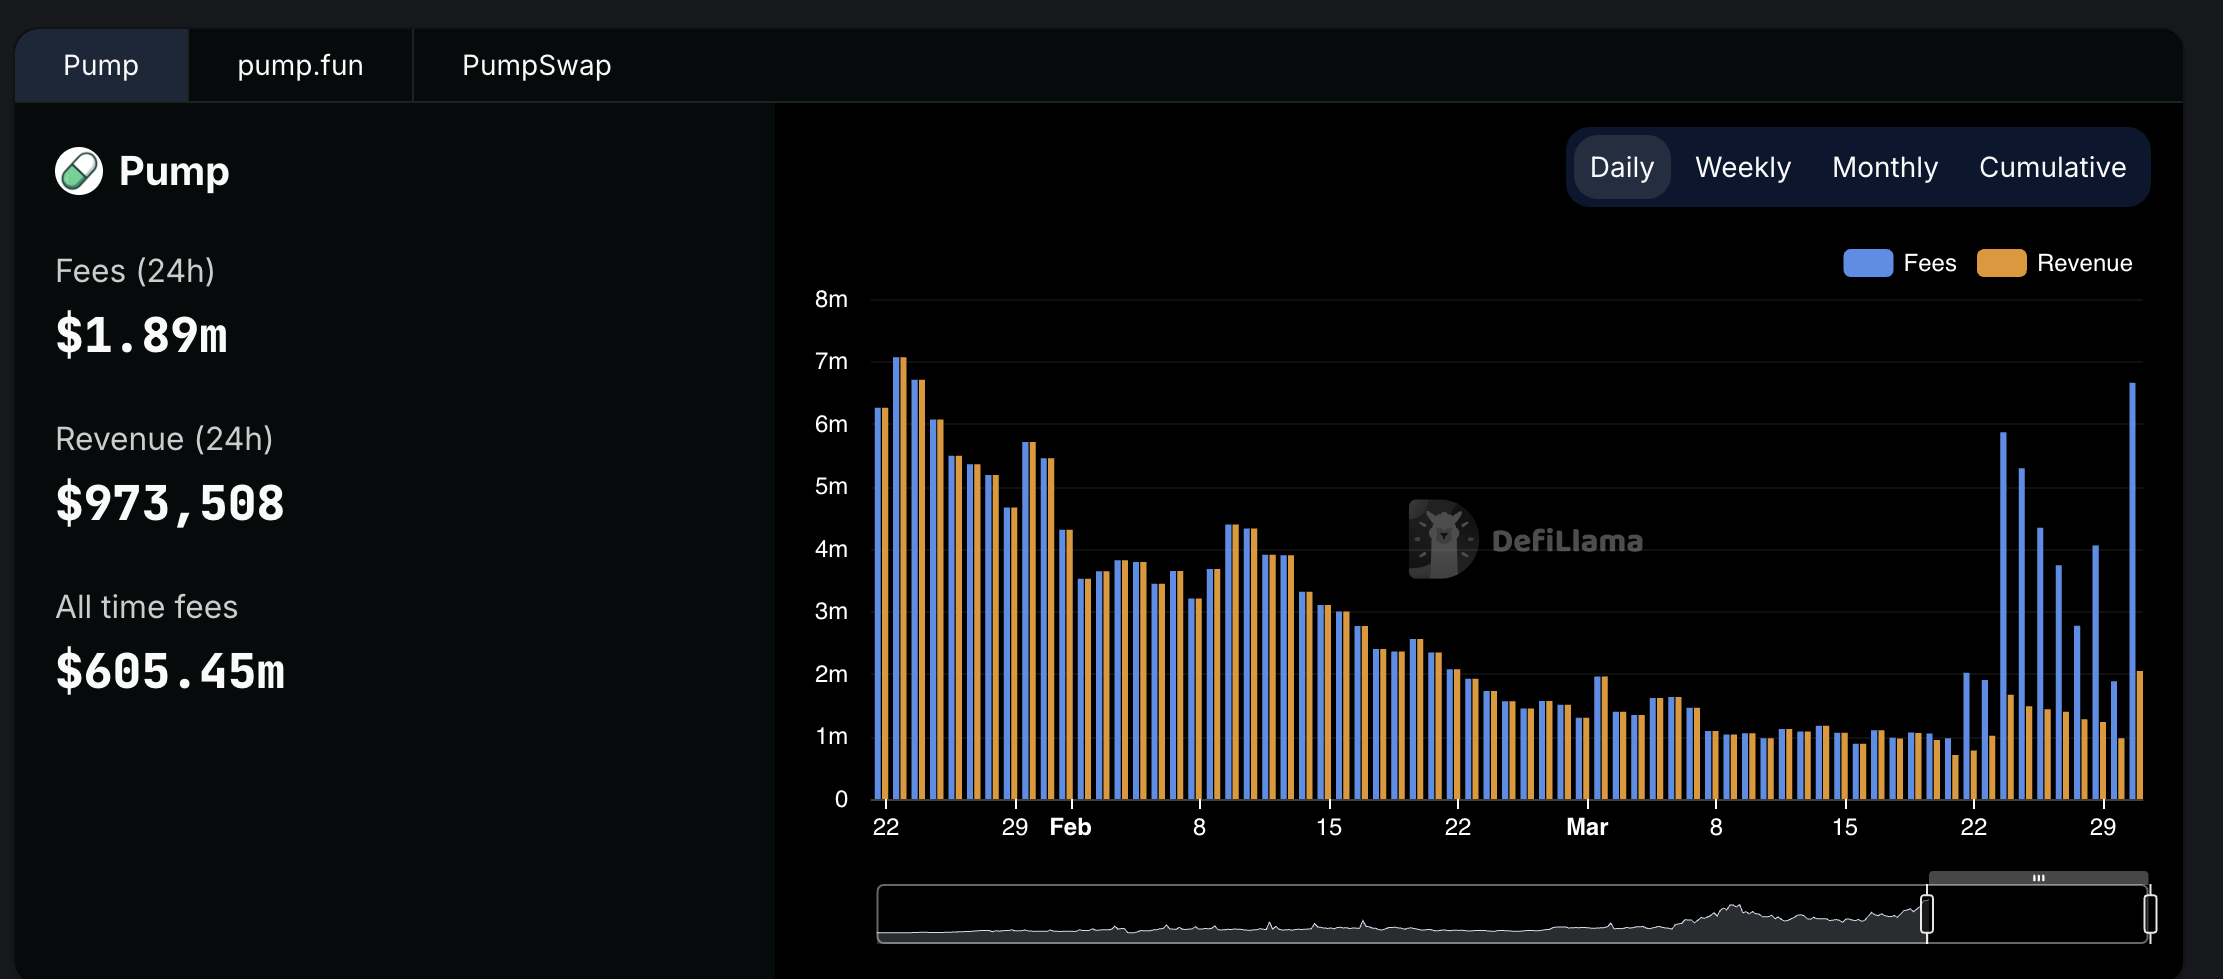
Still, these low fees also have significant advantages. Demand seems to be drying up in the meme coin sector, but Pump.fun faces stiff competition in the form of firms like Raydium, using low fees as a competitive edge. It has also promised things like revenue sharing with token creators to promote ecosystem growth.
Ultimately, the meme coin market as a whole is full of uncertainty. PumpSwap has been able to keep Pump.fun competitive as a top-level platform in this space, giving it a welcome reprieve. The real challenge will come in determining long-term viability.
Disclaimer
In adherence to the Trust Project guidelines, BeInCrypto is committed to unbiased, transparent reporting. This news article aims to provide accurate, timely information. However, readers are advised to verify facts independently and consult with a professional before making any decisions based on this content. Please note that our Terms and Conditions, Privacy Policy, and Disclaimers have been updated.

Hedera (HBAR) is under pressure, down roughly 13.5% over the past seven days, with its market cap holding at around $7 billion. Recent technical signals point to growing bearish momentum, with both trend and momentum indicators leaning heavily negative.
The price has been hovering near a critical support zone, raising the risk of a breakdown below $0.15 for the first time in months. Unless bulls regain control soon, HBAR could face further losses before any meaningful recovery attempt.
HBAR BBTrend Has Been Turning Heavily Down Since Yesterday
Hedera’s BBTrend indicator has dropped sharply to -10.1, falling from 2.59 just a day ago. This rapid decline signals a strong shift in momentum and suggests that HBAR is experiencing an aggressive downside move.
Such a steep drop often reflects a sudden increase in selling pressure, which can quickly change the asset’s short-term outlook.
The BBTrend, or Bollinger Band Trend, measures the strength and direction of a trend using the position of price relative to the Bollinger Bands. Positive values generally indicate bullish momentum, while negative values point to bearish momentum.
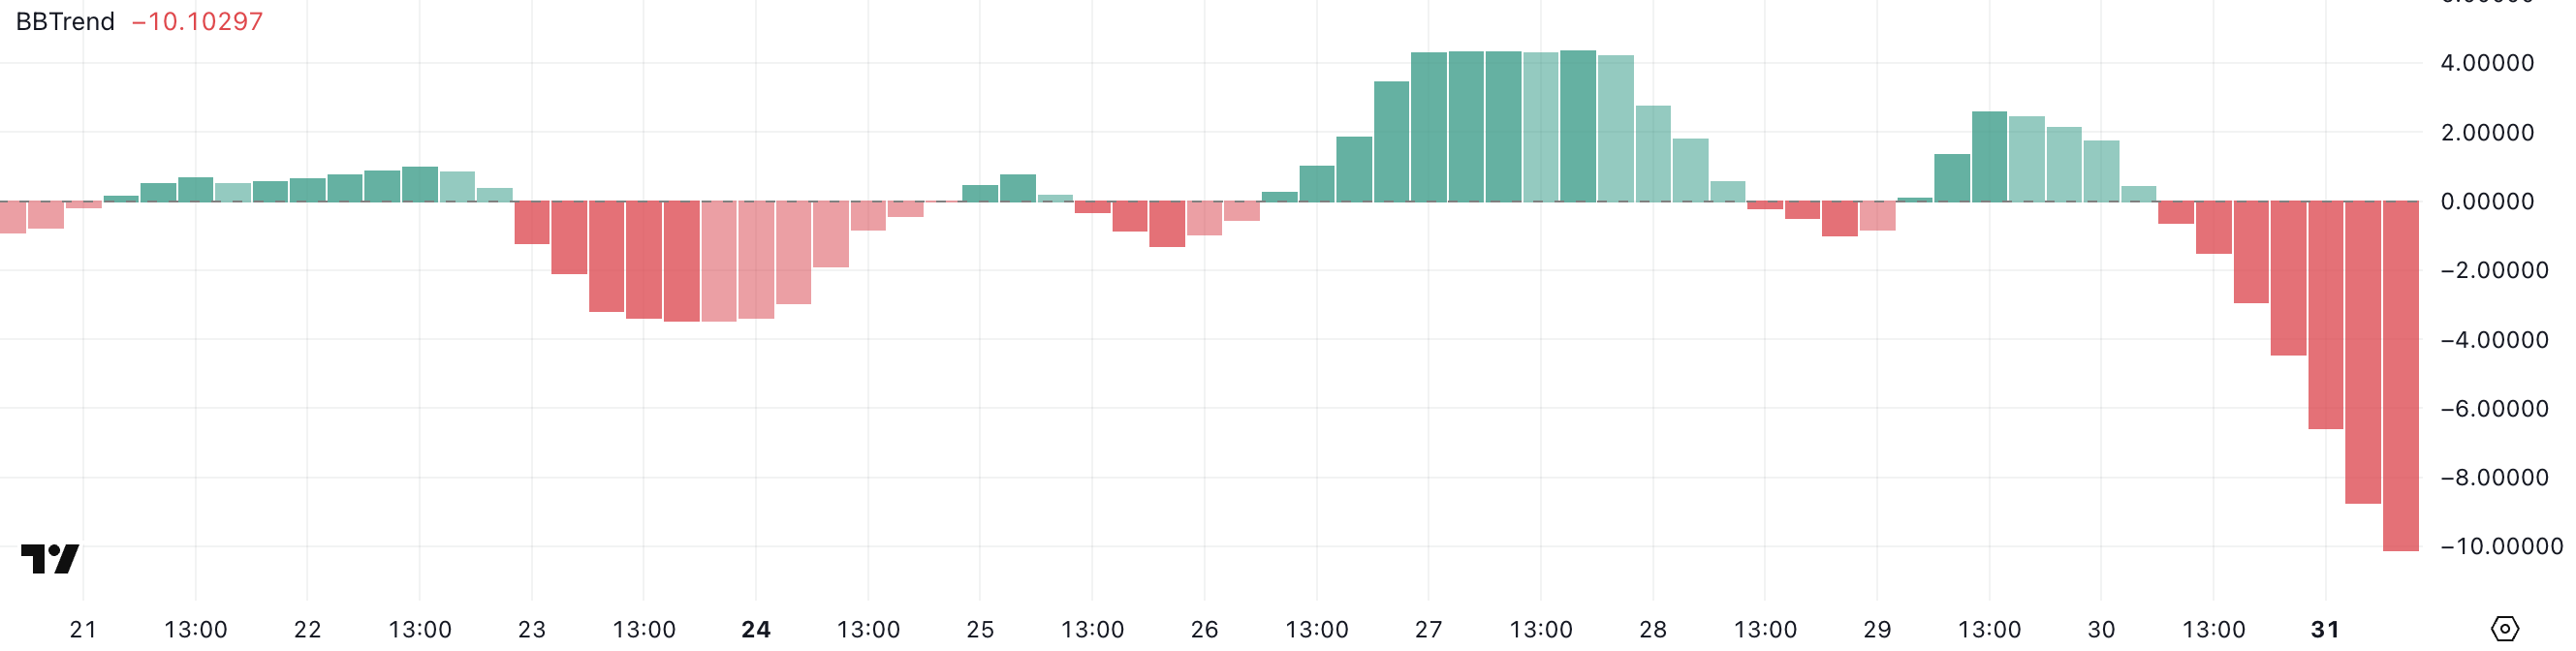
The further the value is from zero, the stronger the trend. HBAR’s BBTrend is now at -10.1, signaling strong bearish momentum.
This suggests that the price is trending lower and doing so with increasing strength, which could lead to further downside unless buyers step in to slow the momentum.
Hedera Ichimoku Cloud Paints a Bearish Picture
Hedera’s Ichimoku Cloud chart reflects a strong bearish structure, with the price action positioned well below both the blue conversion line (Tenkan-sen) and the red baseline (Kijun-sen).
This setup indicates that short-term momentum is clearly aligned with the longer-term downtrend.
The price has consistently failed to break above these dynamic resistance levels, signaling continued seller dominance.
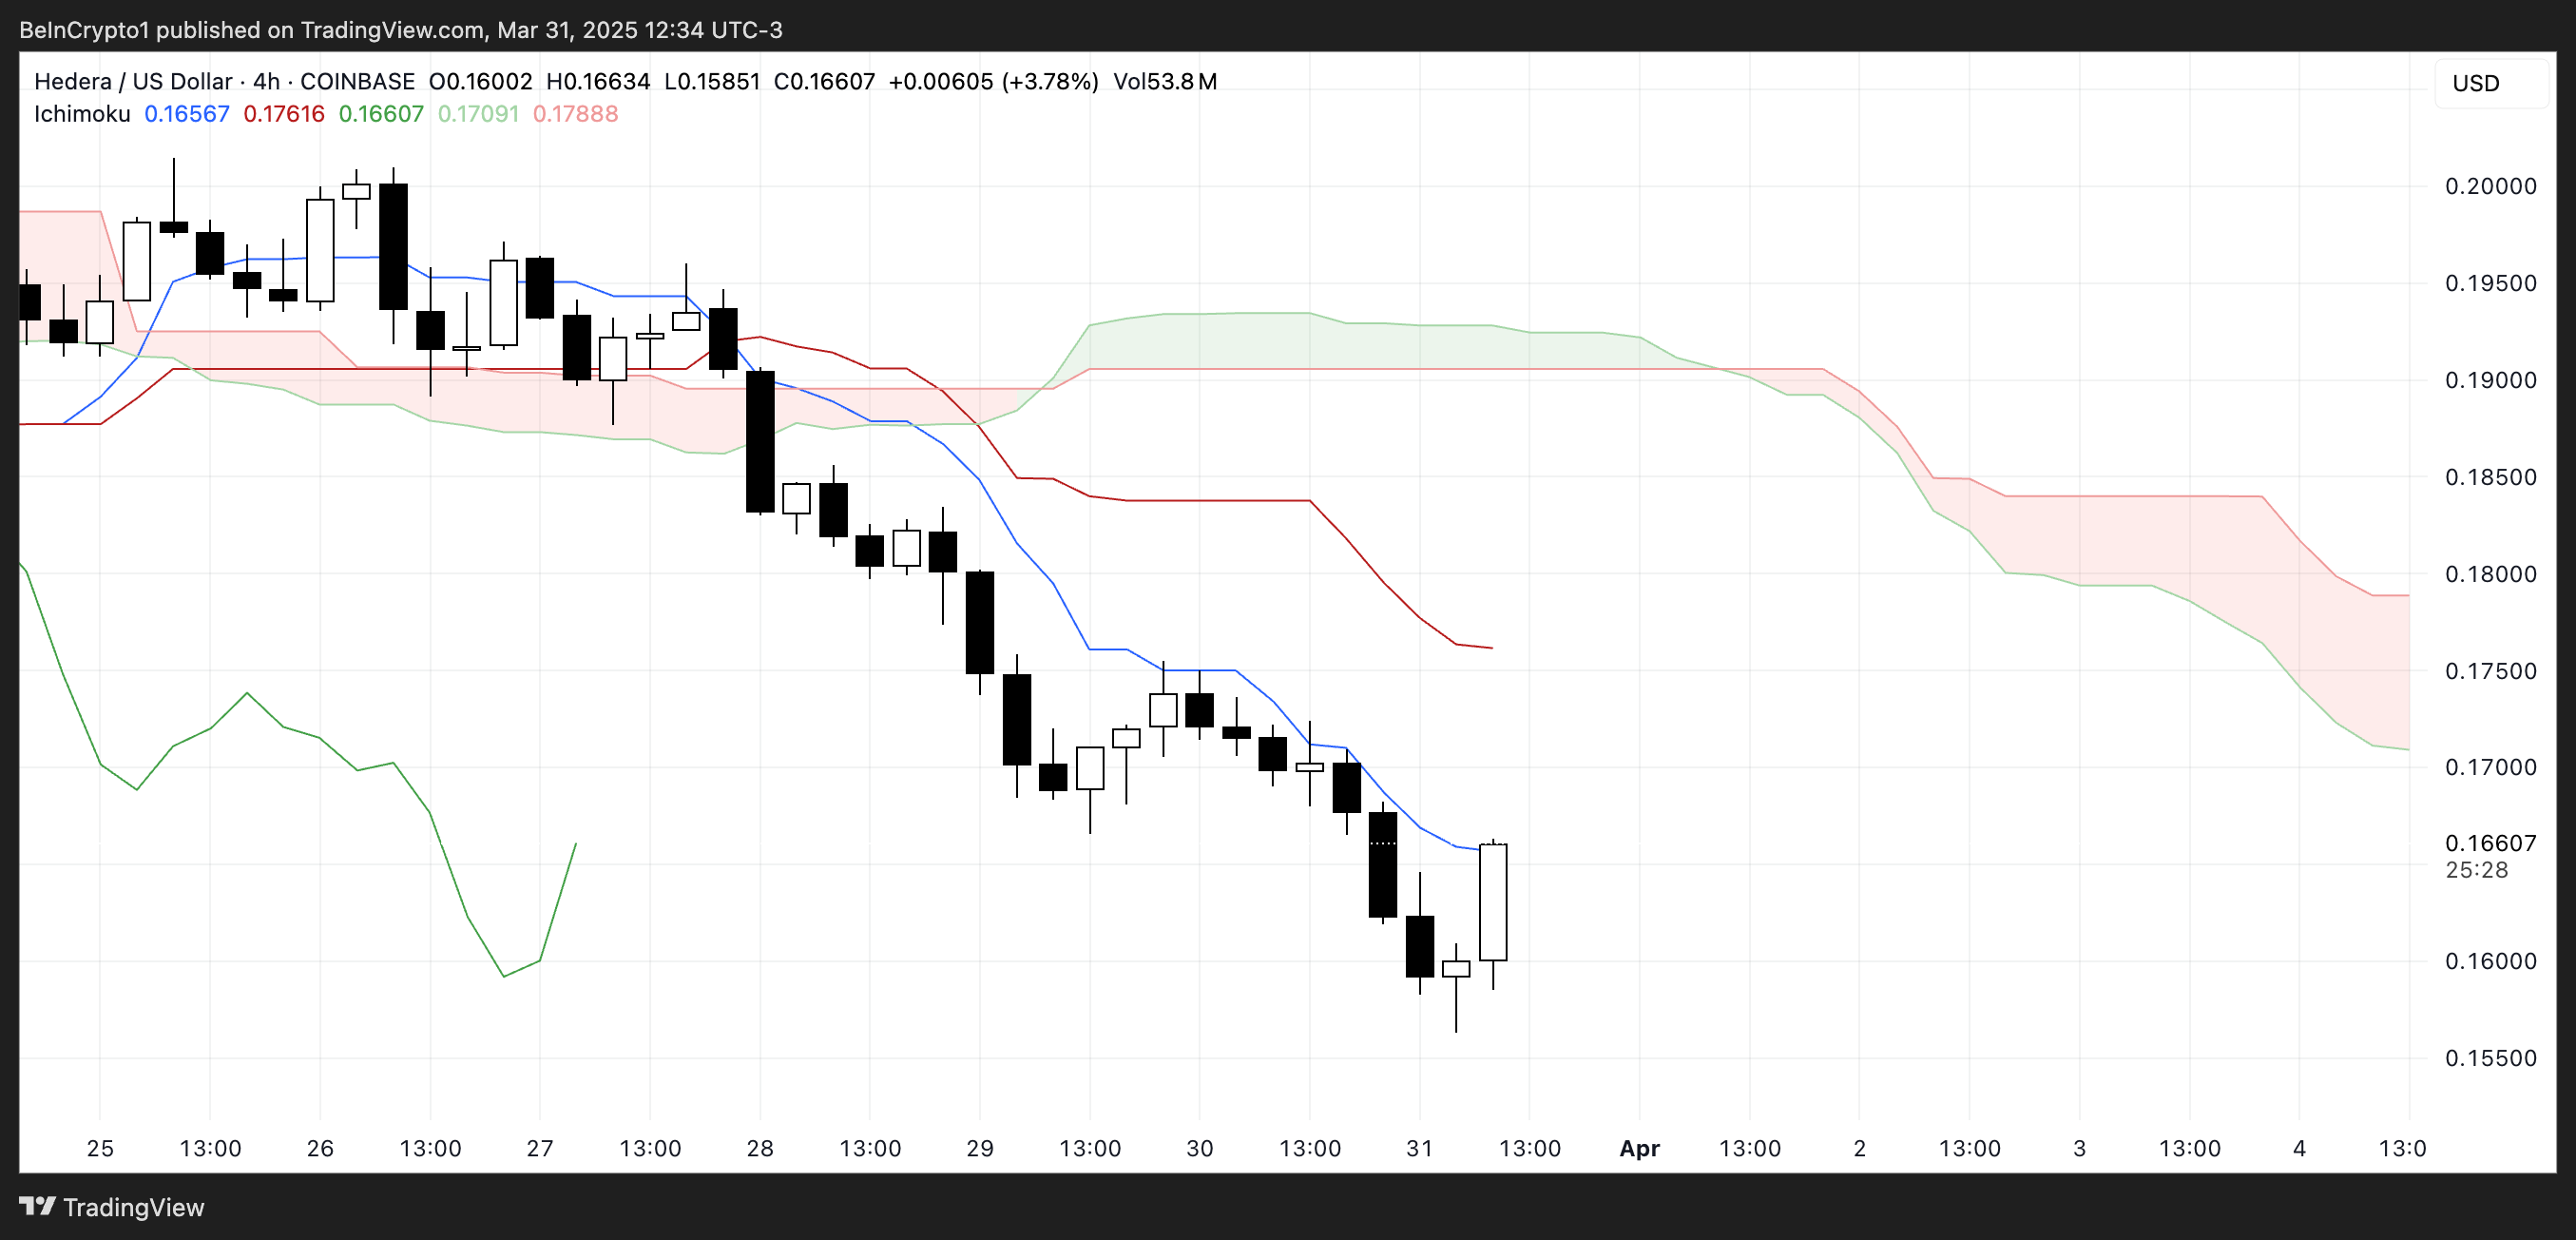
The future cloud is also red and trending downward, suggesting that bearish pressure is expected to persist in the near term.
The span between the Senkou Span A and B lines remains wide, reinforcing the strength of the downtrend. For any potential reversal to gain credibility, HBAR would first need to challenge and break above the Tenkan-sen and Kijun-sen, and eventually push into or above the cloud.
Until then, the current Ichimoku configuration supports a continuation of the bearish outlook.
Can Hedera Fall Below $0.15 Soon?
Hedera price has been hovering around the $0.16 level and is approaching a key support at $0.156.
If this support fails to hold, it could open the door for further downside, potentially pushing HBAR below the $0.15 mark for the first time since November 2024.
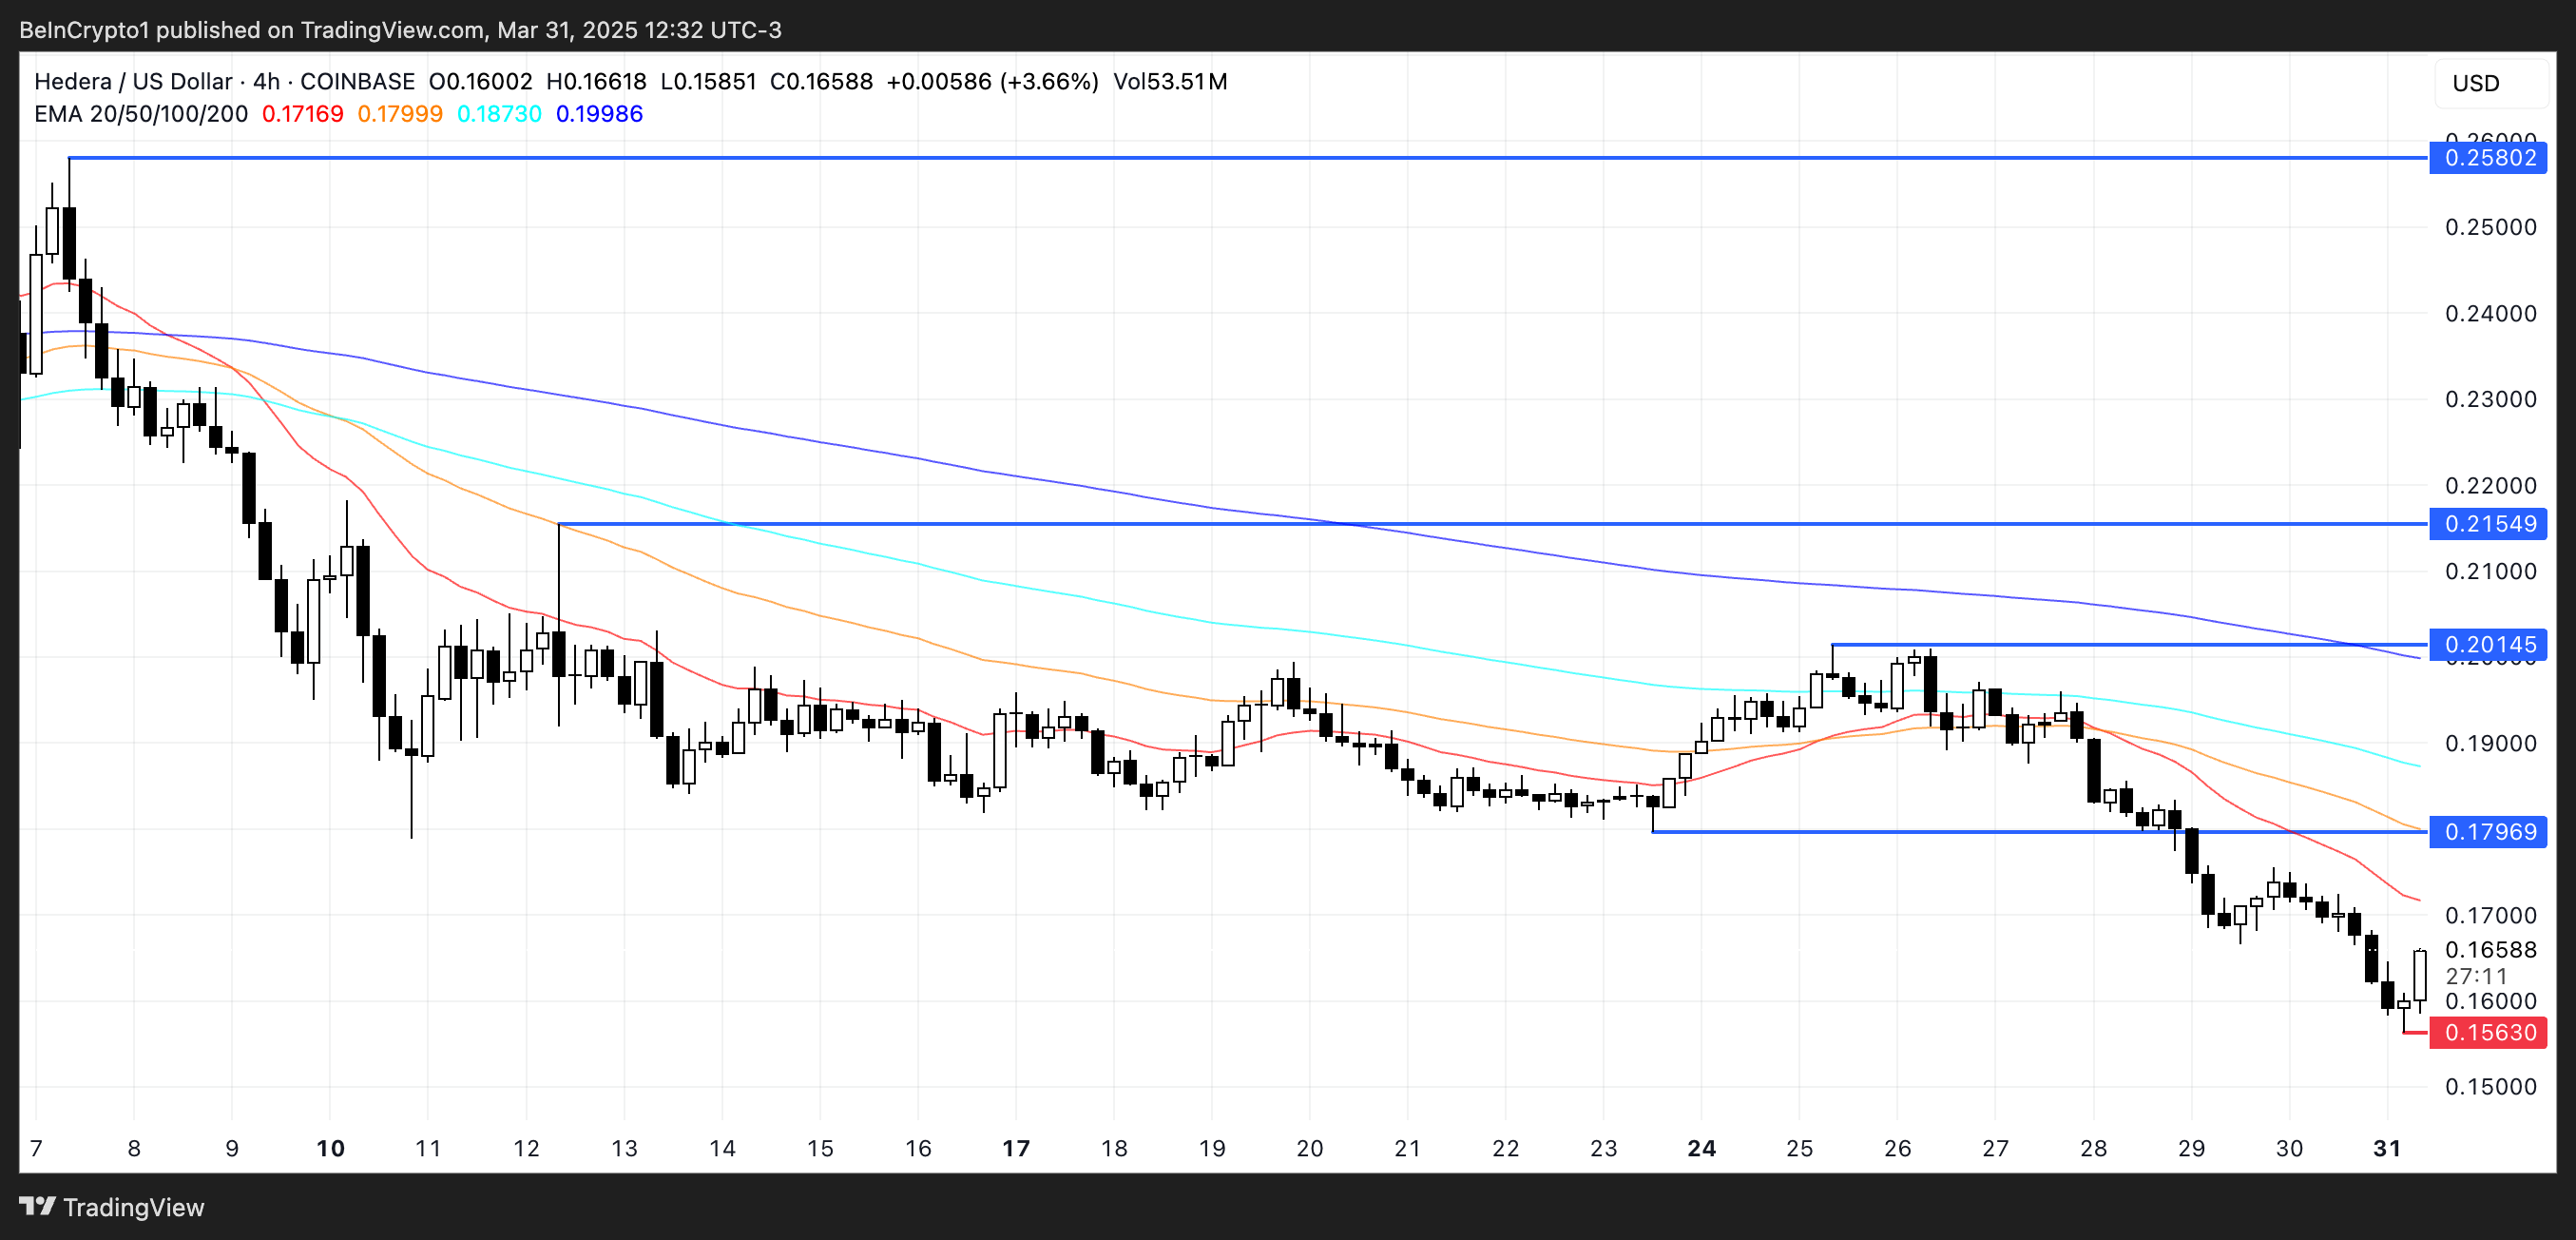
However, if HBAR manages to reverse its current trajectory and regain bullish momentum, the first target to watch is the resistance at $0.179.
A breakout above that level could lead to a stronger rally toward $0.20 and, if momentum continues, even reach $0.215. In a more extended bullish scenario, HBAR could climb to $0.25, signaling a full recovery and trend reversal.
Disclaimer
In line with the Trust Project guidelines, this price analysis article is for informational purposes only and should not be considered financial or investment advice. BeInCrypto is committed to accurate, unbiased reporting, but market conditions are subject to change without notice. Always conduct your own research and consult with a professional before making any financial decisions. Please note that our Terms and Conditions, Privacy Policy, and Disclaimers have been updated.

Cardano (ADA) Whales Hit 2-Year Low as Key Support Retested

This is Why PumpSwap Brings Pump.fun To the Next Level

Hedera (HBAR) Bears Dominate, HBAR Eyes Key $0.15 Level

Charles Hoskinson Reveals How Cardano Will Boost Bitcoin’s Adoption

Coinbase Tries to Resume Lawsuit Against the FDIC

Ethereum Bitcoin Ratio Drops to Record Low, What Next for ETH?

2.52 Million Altcoins Are Ruining Crypto’s Future

Animoca Brands Valuation Tanks 75% In Two Years, Here’s Why

Crypto exchange BingX hacked for $43 million

Are The Big Players Losing Interest?

Hong Kong’s Securities Association Tips Authorities On Crypto Self-Regulation

Coinbase cbBTC Set to go Live on Solana
2.52 Million Altcoins Are Ruining Crypto’s Future
Animoca Brands Valuation Tanks 75% In Two Years, Here’s Why
Crypto exchange BingX hacked for $43 million
Are The Big Players Losing Interest?
Hong Kong’s Securities Association Tips Authorities On Crypto Self-Regulation
Coinbase cbBTC Set to go Live on Solana
-

 Market22 hours ago
Bitcoin Bears Tighten Grip—Where’s the Next Support?
-

 Market21 hours ago
Ethereum Price Weakens—Can Bulls Prevent a Major Breakdown?
-

 Market17 hours ago
This Is How Dogecoin Price Reacted To Elon Musk’s Comment
-
 Regulation11 hours ago
USDC Issuer Circle Set To File IPO In April, Here’s All
-

 Bitcoin16 hours ago
US Macroeconomic Indicators This Week: NFP, JOLTS, & More
-
 Market10 hours ago
Pi Network Struggles, On Track for New All-Time Low
-

 Market16 hours ago
Don’t Fall for These Common Crypto Scams
-

 Ethereum9 hours ago
Ethereum Price Confirms Breakout From Ascending Triangle, Target Set At $7,800