
Altcoin
Expert Gives Reason Why Binance & Bybit Have Not Listed Pi Network

Pi Network’s community members are puzzled by the decision of top cryptocurrency exchanges not to list the asset. However, one crypto expert has waded in to explain the delay behind a potential listing, citing a dire lack of transparency by the Pi Core Team.
Pi Network Needs A High Level Of Transparency
Pseudonymous crypto analyst Dr. Altcoin has explained the reason behind Pi Network’s absence on top cryptocurrency exchanges. According to a post on X, Dr Altcoin noted that the reason may be a lack of transparency by the Pi Core Team.
Dr Altcoin noted that the transparency issue revolves around Pi Network’s tokenomics. Per the analyst, information on the locking mechanism for Pi Network remains shrouded in mystery.
“It is likely that the Pi Core Team has not been transparent enough about the locking and burning mechanism involving the billions of Pi coins currently owned by the PCT,” read the post.
At the moment, Pi Network is not listed on centralized exchanges like Binance, Coinbase, and Coinbase. While whispers of an imminent listing are growing louder, Binance excluded the asset from its Vote To List program.
Decreasing Circulating Supply Leaves Community Scratching Their Heads
A closer look at Pi Network’s tokenomics reveals a decline in its circulating supply to 6.77 billion. The Pi Core Team removed 10 million coins from circulating in what Dr. Altcoin described as an attempt at price control ahead of a token unlock.
“Without transparency, this could easily be misconstrued as potential plans for market manipulation, as we have seen indications of this in recent days,” said Dr Altcoin.
A previous token unlock sent prices cascading to new lows but a burn roadmap is in development for the network. Experts say burning Pi Network tokens will prevent a steep drop in prices.
However, some community members disagree with Dr Altcoin’s theory of a lack of transparency behind Pi Network’s listing delays. The cross-section of community members says the delay stems from the Pi Core Team refusing to pay exchanges for a listing. They argue that the Pi Core Team is seeking a free listing from exchanges, taking the longer route.
Pi is trading at $1 and is down 66% from its all-time high of $2.98 that it set in February.
Aliyu Pokima
Disclaimer: The presented content may include the personal opinion of the author and is subject to market condition. Do your market research before investing in cryptocurrencies. The author or the publication does not hold any responsibility for your personal financial loss.


Dogecoin price is attracting renewed attention from technical analysts, with several chart formations pointing to a meme coin rally. According to multiple analysts, DOGE price is displaying a combination of technical indicators and structures that suggest the potential for a 10X rally. These include a breakout from a triangle pattern, a developing “cup and handle” formation, and historical pattern similarities to the 2017 bull market.
Dogecoin Price Prediction: Chart Patterns Point to 10X Meme Coin Rally
In a recent post on X, analyst Trader Tardigrade shared a chart showing the MACD indicator breaking out from a triangle formation. This setup has historically been linked with strong upward momentum in Dogecoin price. The MACD breakout is accompanied by a rounded bottom pattern, often seen as a preparatory phase before bullish moves.
Notably, during previous instances in September and March, similar MACD triangle breakouts occurred. In both cases, the breakout led to a rapid acceleration in Dogecoin price. These historical movements suggest that the current meme coin rally may lead to a new all-time high.

The MACD lines have crossed again in recent sessions, with the indicator moving above the triangle’s downtrend line. Analysts are observing similar conditions that were present during previous rallies. The upward curl in the price structure reinforces the breakout narrative.
Meanwhile, following the recent move by House of Doge, market analysts are forecasting a 16% rise in Dogecoin price as bullish momentum builds.
Cup and Handle Pattern Suggests Upside Toward $2.00
Additionally, according to Crypto Elites, DOGE price is forming a cup and handle pattern, a technical formation often associated with bullish continuation. The rounded bottom of the cup has already developed, and the handle phase is underway. This formation typically leads to a breakout once the price surpasses the neckline resistance.
The key resistance level is positioned near $0.185. A confirmed break above this threshold could open the door to a sharp upward movement. Based on this chart pattern, the projected target is in the $1.85 to $2.00 range. The projection is calculated using the depth of the cup formation.

However, the analyst noted that the current retracement to the handle’s lower range may act as a support zone. This area has historically been where momentum builds ahead of breakouts.
Historical Behavior Resembling 2017 Cycle
Concurrently, analyst KrissPax has identified similarities between the current Dogecoin price movement and the 2017 bull run. KrissPax posted a chart on X that compares both periods, showing the current phase aligning closely with the structure before DOGE price previous surge. According to the chart, the current meme coin cycle could extend beyond the previous all-time high.
KrissPax projected that the top meme coin could rise to $4 if the second major breakout occurs, similar to the 2017 pattern. While this is a longer-term scenario, it is based on recurring patterns observed in past market cycles.
A recent CoinGape report supports the bullish outlook on DOGE price, noting that a breakout above the $0.18 resistance could ignite a meme coin rally toward the $20 mark.
Ronny Mugendi
Ronny Mugendi is a seasoned crypto journalist with four years of professional experience, having contributed significantly to various media outlets on cryptocurrency trends and technologies. With over 4000 published articles across various media outlets, he aims to inform, educate and introduce more people to the Blockchain and DeFi world. Outside of his journalism career, Ronny enjoys the thrill of bike riding, exploring new trails and landscapes.
Disclaimer: The presented content may include the personal opinion of the author and is subject to market condition. Do your market research before investing in cryptocurrencies. The author or the publication does not hold any responsibility for your personal financial loss.

Ethereum price is attracting renewed market attention as analysts present technical scenarios pointing toward a potential move above the $2100 mark. Recent analyses from experts suggest that Ethereum price behavior is showing both bullish short-term structure and macro-level cyclical patterns, which could support an upward continuation if key levels hold.
Ethereum Price Could Surge Past $2100 on Liquidity Grab
Analyst Crypto Patel shared insight on the X platform, identifying a bullish price setup on the ETH/USDT chart. According to Patel, the top altcoin has shown a strong displacement move to the upside, which has led to a shift in market structure. This move followed a reaction from a previously identified bullish Point of Interest (POI).
Ethereum price is reacting positively from a key mitigation block near $2064.60, indicating strong institutional demand. The mitigation block represents a zone where the top altcoin price retraced after a breakout, often used by institutional traders to mitigate prior orders before continuing the trend. This setup places the entry for a long position within the upper mitigation zone, aligning with smart money principles.

The price target of $2128.12 aligns with a swing high liquidity zone, suggesting a likely smart money-driven move upward. These zones often hold clustered stop-loss orders and pending buy positions. A move into this area could allow investors to capture liquidity before a reversal. Patel sets a stop-loss at $2027.20, just below the mitigation block, providing a defined risk level if the altcoin price structure fails.
Current ETH Cycle Compared to 2018–2020 Pattern
Another analyst, TimeFreedomROB, posted a chart on X comparing Ethereum price weekly structure to its 2018–2020 cycle. The analysis shows ETH breaking below an ascending triangle, mirroring its past breakdown below a descending triangle before its major 2020 recovery. In that prior cycle, ETH price formed a macro bottom and rallied from under $100 to nearly $4800.
According to the chart, Ethereum price is currently trading near $2060. It recently broke below the $2300 psychological level and tested the lower diagonal trendline around $1800. This area corresponds with horizontal demand levels from previous years. The chart implies this could represent a final shakeout phase before a strong upward move, similar to historical cycles.

The support zone between $1800 and $2000 has acted as a long-term base in earlier market periods. A reclaim of the $2200–$2400 range is important for Ethereum price to confirm a shift back into bullish momentum on the weekly timeframe.
Altcoin Price Prediction
Additionally, the macro view provided by TimeFreedomROB outlines possible reversal targets if the price continues to follow historical patterns. In 2020, ETH saw a 40x increase following structure reclaim. While current conditions differ, the projected path includes potential resistance levels at $3600, $4870, and an extended range of $6000–$7500.
Supporting the bullish projections, analyst MAXPAIN noted that ETH price could retrace to the $1,900 zone before a potential rally to $3,000. His analysis, based on the TPO chart, identifies the $1,874–$1,924 range as a key support and accumulation area.
The top altcoin is currently trading at $2,064.98, showing an 8.10% gain over the past 7 days. Its market cap stands at $249.12 billion, with a 24-hour trading volume of $11.71 billion.
Ronny Mugendi
Ronny Mugendi is a seasoned crypto journalist with four years of professional experience, having contributed significantly to various media outlets on cryptocurrency trends and technologies. With over 4000 published articles across various media outlets, he aims to inform, educate and introduce more people to the Blockchain and DeFi world. Outside of his journalism career, Ronny enjoys the thrill of bike riding, exploring new trails and landscapes.
Disclaimer: The presented content may include the personal opinion of the author and is subject to market condition. Do your market research before investing in cryptocurrencies. The author or the publication does not hold any responsibility for your personal financial loss.


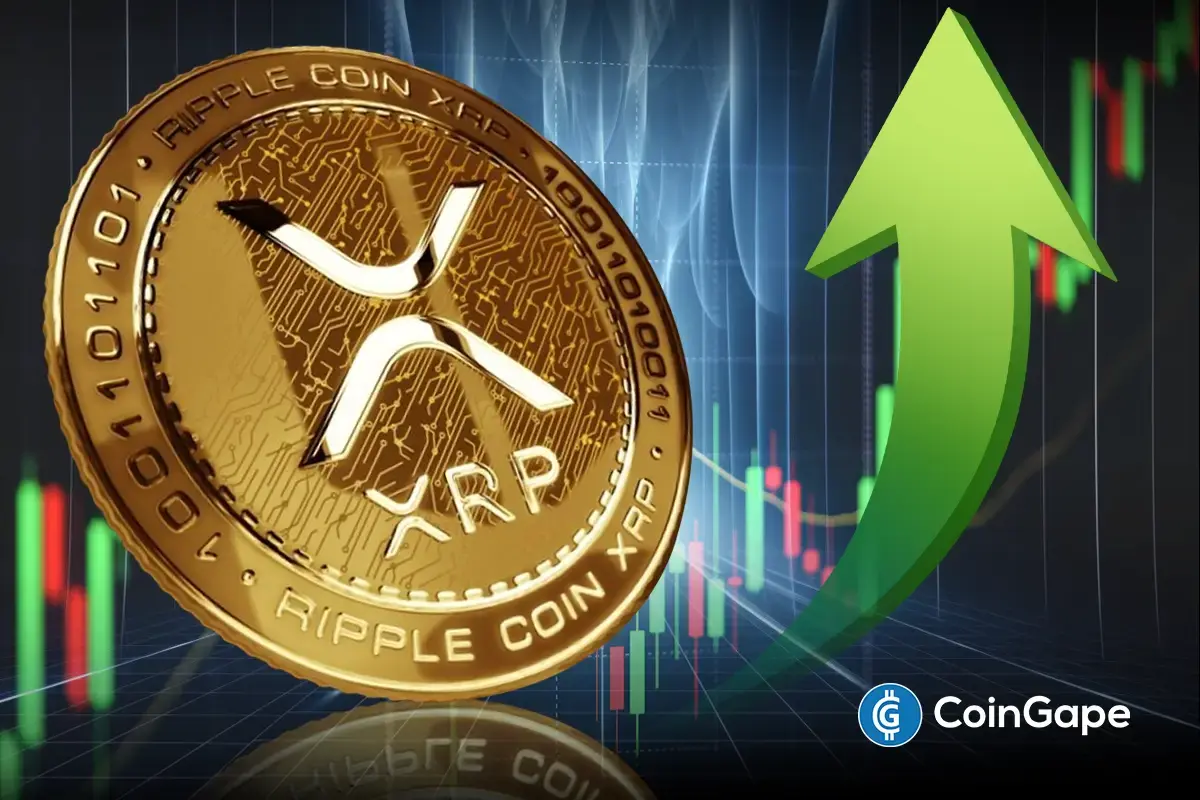
Crypto analyst Dark Defender has issued a bold outlook for XRP, stating on X that the asset is on a clear path toward multiple upside targets. His remarks come at a time when the asset bulls are trying to hold a support level at $2.42, with technical patterns suggesting the asset may be preparing for a significant breakout.
XRP Faces Minor Resistance on the Way to $2.75, $5.85 in Sight
XRP’s price action is starting to see some positive note, recently pushing as high as $2.56 in a 7-day timeframe. Although it met resistance and reversed on a downtrend early last week, it eventually found support at $2.36 and started a fresh uptrend. This up-and-down movement is seemingly an average price action playout, but technical analysis on the daily candlestick timeframe chart shows that the price quietly changed a downward sloping resistance trendline into support at $2.36.
Now, the next outlook for the altcoin is an upward movement after this fresh uptrend above the resistance trendline. With this in mind, crypto analyst Dark Defender predicted that the cryptocurrency is on the road to $5.85. The analyst also highlighted, a closer price target at $2.75, though noting that XRP may experience some difficulty breaking through $2.55.

The predicted difficulty at $2.55 is in response to its rejection last week. However, Dark Defender’s phrasing was straightforward; “XRP looks excellent,” reflecting strong conviction in the token’s current setup after his analysis.
Exponential Fibonacci: $5.85 Isn’t The Limit For The Altcoin
Dark Defender’s prediction of a $5.85 price target for XRP would see the crypto breaking above its current all-time high. However, this pales in comparison to the analyst’s long-term projection.
The projection to $5.85 is only one part of Dark Defender’s broader analysis. In a previous post, he outlined a more ambitious long-term scenario using exponential Fibonacci levels and Elliott Wave theory. According to him, the common belief that XRP cannot exceed $10 is a misunderstanding of exponential modeling. He argued that the altcoin is currently in an impulse wave 3 on a multi-year timeframe. If wave 3 fully extends during this phase, it could reach $77.7, with wave 5 targeting a three-digit price zone.
His roadmap emphasizes staying above the $2.3951 median, a level he says has been in play since November. From there, the chart suggests a run to $8, which could lead the asset toward a new range between $18 and $23. These projections are based not only on wave extensions but also on volume trends, RSI behavior, and repeating historical patterns, which the analyst believes all align to support an incoming rally.
At the time of writing, XRP is trading at $2.42.
Featured image from iStock, chart from Tradingview.com
Editorial Process for bitcoinist is centered on delivering thoroughly researched, accurate, and unbiased content. We uphold strict sourcing standards, and each page undergoes diligent review by our team of top technology experts and seasoned editors. This process ensures the integrity, relevance, and value of our content for our readers.
Dogecoin Price Set To Rally 10X Amid This Bullish Pattern

This is Why Q2 2025 Could Be Bullish for Crypto Markets

Ethereum Forms Complex iH&S Structure, Why $18,000 Is The Possible Target
Ethereum Price Eyes Breakout as Analyst Predicts Next Leg Up Above $2100

Former CFTC Chair Flags Risks in Trump’s Crypto Ventures

Crypto Pundit Says XRP Looks Excellent Here, Gives Reasons Why

2.52 Million Altcoins Are Ruining Crypto’s Future

Animoca Brands Valuation Tanks 75% In Two Years, Here’s Why

Crypto exchange BingX hacked for $43 million

Are The Big Players Losing Interest?

Hong Kong’s Securities Association Tips Authorities On Crypto Self-Regulation

Coinbase cbBTC Set to go Live on Solana
2.52 Million Altcoins Are Ruining Crypto’s Future
Animoca Brands Valuation Tanks 75% In Two Years, Here’s Why
Crypto exchange BingX hacked for $43 million
Are The Big Players Losing Interest?
Hong Kong’s Securities Association Tips Authorities On Crypto Self-Regulation
Coinbase cbBTC Set to go Live on Solana
-
 Market24 hours ago
Hedera (HBAR) Shows Bearish Signals Despite Recovering 5%
-
 Altcoin23 hours ago
Analyst Predicts XRP Price Could Surge Above $1400 as Bull Flag Breaks
-

 Market21 hours ago
Ethereum Price Back Above $2,000—Breakout or Just a Temporary Bounce?
-
 Market20 hours ago
Bitcoin Price Breaks Out with First Spot ETF Inflows in A Month
-
 Altcoin19 hours ago
Is Ethena Price At Risk? Trump’s World Liberty Financial Sells 184K ENA Sparking Concerns
-

 Market19 hours ago
Solana (SOL) Gains Capped—Breaking $150 Won’t Be Easy
-
 Altcoin18 hours ago
Cronos Is Scam Allegations Appear After Trump CryptoCom Deal, Will CRO Price Crash?
-

 Bitcoin18 hours ago
Mt. Gox’s $1 Billion Bitcoin Transfer: Is Liquidation Coming?
✓ Share: