
Ethereum
Exchange Supply Sees Massive 16.4% Drop


On-chain data shows the Ethereum Supply on Exchanges has seen a sharp decline recently, something that could be bullish for ETH’s price.
A Large Amount Of Ethereum Has Left Exchanges Recently
According to data from the on-chain analytics firm Santiment, the ETH Supply on Exchanges has fallen to its lowest point in almost 10 years. The “Supply on Exchanges” refers to an indicator that measures the total amount of Ethereum that’s currently sitting in the wallets of all centralized exchanges.
When the value of this metric observes an increase, it means the investors are depositing a net number of tokens of the asset into these platforms. One of the main reasons why traders transfer to exchanges is for selling-related purposes, and this kind of trend can have a bearish impact on the ETH price.
On the other hand, the indicator going down suggests a net amount of the asset’s supply is leaving the exchanges. Such a trend may be a sign that the investors are accumulating, which can naturally prove to be bullish for the coin.
Now, here is the chart shared by the analytics firm that shows the trend in the Ethereum Supply on Exchanges over the past year:

Looks like the value of the metric has witnessed a plunge in recent days | Source: Santiment on X
As displayed in the above graph, the Ethereum Supply on Exchanges has seen a massive drawdown recently, implying the investors have made a large amount of net withdrawals.
Compared to seven weeks ago, there is now 16.4% less ETH on exchanges. This sharp change has taken the indicator’s value to the lowest level since 2015, nearly a decade ago.
From the chart, it’s apparent that the timing of this latest withdrawal spree has coincided with a plunge in the cryptocurrency’s price. The same graph also shows the data related to the Bitcoin Supply on Exchanges and it would seem that, even though the number one digital asset has seen a decline of its own, the metric has still only continued to move sideways.
It’s possible that this is a sign the whales are making a stronger push to buy the dip for Ethereum, as compared to Bitcoin. However, the more likely explanation may lie in the rich ecosystem of DeFi and staking services that ETH hosts, which may be where this supply is heading off to in this period of market cooldown.
While Ethereum appears positive from an on-chain perspective, the same isn’t true for technical analysis. As analyst Ali Martinez has explained in an X post, the zoomed-out ETH chart may contain a grim picture for the asset.

The TA pattern that ETH has been trading inside for the last couple of years | Source: @ali_charts on X
As is visible in the chart, Ethereum has seemingly been consolidating inside a parallel channel for a while now. Recently, the asset has been on the way down and as the analyst has marked in the chart, a move to the lower level of the channel may be brewing for the coin.
ETH Price
At the time of writing, Ethereum is trading at around $1,960, down more than 3% over the last seven days.
The price of the coin seems to have been moving sideways recently | Source: ETHUSDT on TradingView
Featured image from Dall-E, Santiment.net, charts from TradingView.com
Editorial Process for bitcoinist is centered on delivering thoroughly researched, accurate, and unbiased content. We uphold strict sourcing standards, and each page undergoes diligent review by our team of top technology experts and seasoned editors. This process ensures the integrity, relevance, and value of our content for our readers.


Ethereum (ETH) registered some minor gains in the past week, rising by 2.80%. Nevertheless, the prominent altcoin remains far from breaking out of a downtrend stretching as far back as December. Amid this bearish market state, renowned market analyst Ali Martinez has highlighted critical price levels in deciding if ETH’s correction is over and suitable for a market entry.
Ethereum: A Buying Opportunity Or More Downside Ahead?
In a detailed analysis post on X, Martinez explains that Ethereum has crashed by 57% from its local peak of $4,100 in December. This decline has been attributed to a widespread distribution by large Ethereum holders, especially the whales. Over the past four months, wallets holding 10,000 ETH have declined by 80. Meanwhile, ETH whales i.e. wallets holding 100,000 ETH and above, have offloaded 130,000 ETH within this period.
During ETH’s decline, the Ethereum Spot ETFs have also suffered massive withdrawals as indicated by a net outflow of $760 million in just the last month. Furthermore, investors have transferred 100,000 ETH to investors with intentions to sell in fear of a price loss.
Looking forward, Martinez notes several technical indicators further suggest a downside for Ethereum amid this intense selling pressure. For example, a breakdown from an ascending triangle on the 3-day charts suggests ETH may be headed for a price target of around $1,000.
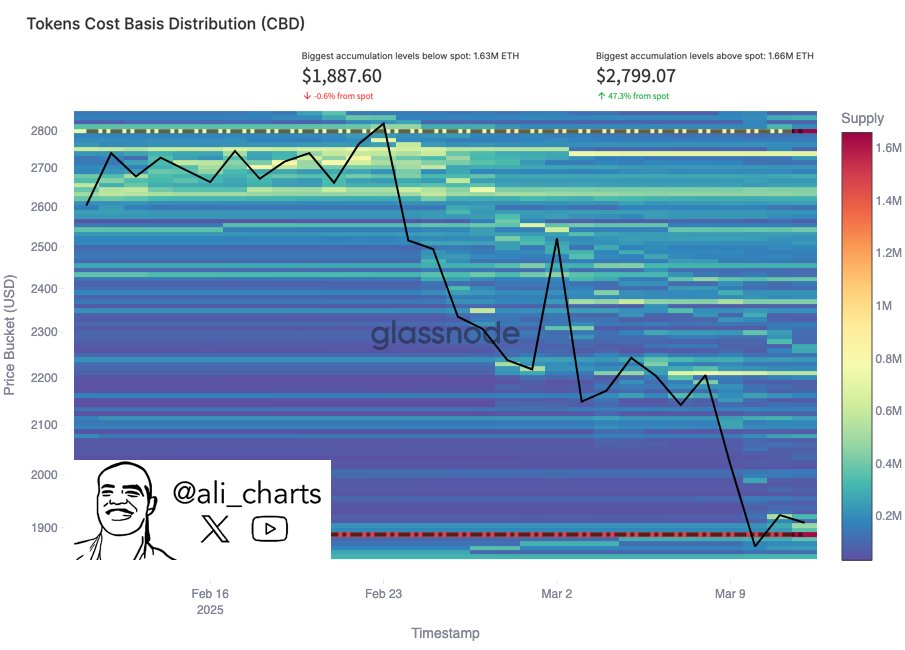
Meanwhile, the ETH pricing bands have also highlighted $1,440 as another downside target indicating a potential 27.4% decline from current market prices. Interestingly, data from the Cost Basis Distribution correlates with both bearish projections as Ethereum is currently above key support at $1,887. However, a price fall below this level will result in a further decline to lower targets such as $1,440, $1250, and $1,000.
Albeit, Martinez notes there is potential for an ETH market recovery. By analyzing the amount of ETH acquired at each price level, the analyst notes that ETH bulls are facing a serious resistance between $2,250-$2,610. If ETH bulls can push past this resistance, it would invalidate the current bearish market outlook.
Ethereum Price Overview
At the time of writing, Ethereum was trading at $1,985 reflecting gains of 1.10% in the past day and 2.10% in the past seven days. However, the altcoin is down by 27.32% in the last month. Being the largest altcoin in the market, Ethereum boasts a market cap of $239 billion representing 8.7% of the total crypto market.
Featured image from Ledger Insights, chart from Tradingview
Editorial Process for bitcoinist is centered on delivering thoroughly researched, accurate, and unbiased content. We uphold strict sourcing standards, and each page undergoes diligent review by our team of top technology experts and seasoned editors. This process ensures the integrity, relevance, and value of our content for our readers.

Ethereum’s price action has been one of the most disappointing features of 2025. The “king of altcoins” recently slipped below $2,000 for the first time in over a year. However, the latest on-chain data shows that the fortunes of the second-largest cryptocurrency might be about to change.
Here’s Why ETH Price Could Rebound From Current Lows
In a recent post on the X platform, popular YouTuber Crypto Rover revealed that significant amounts of Ethereum have been flowing out of cryptocurrency exchanges in the past few weeks. This on-chain observation is based on changes in the “Ethereum Exchange Reserve” metric, which tracks the total amount of ETH tokens on all centralized exchanges.
An increase in the value of the Exchange Reserve metric suggests that investors are moving their assets to wallets affiliated with these centralized platforms. This is usually considered a bearish signal for the asset, as selling is one of the main reasons investors send their coins to centralized exchanges.
On the other hand, when the metric’s value declines, it implies that more assets are flowing out of the centralized exchanges. This trend could signal fresh buying from investors or renewed interest in long-term holdings, which could be bullish for the asset price.
Interestingly, a separate on-chain revelation shows that Ethereum whales have been loading their bags in the past few days. Data from Santiment shows that whales holding between 1,000,000 and 10,000,000 tokens have purchased over 120,000 ETH tokens in the last 72 hours.

Source: @rovercrc on X
As shown in the CryptoQuant chart above, the Ethereum Exchange Reserve has fallen to a new all-time low of 18.3 million ETH tokens. This is a positive sign for the Ethereum price, as increased allocation to self-custodial wallets signals an elevated confidence in the asset’s long-term potential.
Crypto Rover noted that if the Ethereum reserves on centralized exchanges continue to dwindle, the altcoin could experience a “supply shock” — or more fittingly a supply crunch. For context, a supply crunch refers to a decline in the amount of an asset available for purchase, leading to a jump in prices.
Ultimately, this fall in Ethereum supply on centralized exchanges could act as a significant catalyst for ETH’s price recovery.
Ethereum Price At A Glance
As of this writing, the price of Ethereum stands at around $1,990, reflecting a 0.6% increase in the past 24 hours.
The price of ETH on the daily timeframe | Source: ETHUSDT chart on TradingView
Featured image from iStock, chart from TradingView
Editorial Process for bitcoinist is centered on delivering thoroughly researched, accurate, and unbiased content. We uphold strict sourcing standards, and each page undergoes diligent review by our team of top technology experts and seasoned editors. This process ensures the integrity, relevance, and value of our content for our readers.

Reason to trust
![]()
Strict editorial policy that focuses on accuracy, relevance, and impartiality
Created by industry experts and meticulously reviewed
The highest standards in reporting and publishing
Strict editorial policy that focuses on accuracy, relevance, and impartiality
Morbi pretium leo et nisl aliquam mollis. Quisque arcu lorem, ultricies quis pellentesque nec, ullamcorper eu odio.
A crypto analyst has predicted that the Ethereum price could be gearing up for an additional 13% crash to new lows. Currently, the cryptocurrency is hovering near the crucial $2,200 resistance, where a rejection could fuel further volatility and trigger a significant decline.
Ethereum Price Set For $1,700 Crash
In a recent technical analysis published by MadWhale, a TradingView crypto expert, the Ethereum price is projected to experience a severe price breakdown, declining by 13% to reach $1,700. The analyst attributes this bearish outlook to the cryptocurrency’s recent price action and chart patterns.
Related Reading
MadWhale shared an Ethereum price chart showing that the cryptocurrency is moving within a Descending Channel. This channel is generally a bearish chart pattern formed when two downward-sloping trend lines connect at lower highs and lower lows. It usually indicates a major downtrend, in which sellers dominate the market rather than buyers.
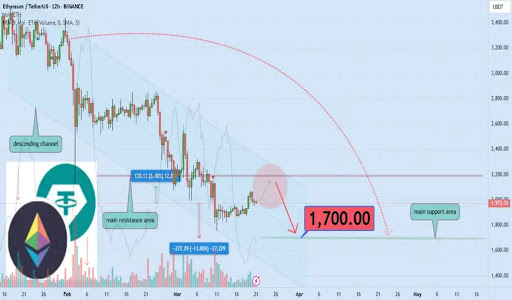
Presently, the Ethereum price is fast approaching a main resistance area at $2,200, situated around the upper boundary of the Descending Channel pattern and marked by the red shaded area on the chart. Historically, when its price reaches this area, it often encounters significant selling pressure that leads to a sharp downward price reversal.
MadWhale’s analysis suggests that the cryptocurrency may fail to break this critical resistance area, triggering his predicted decline to $1,700. This target aligns with a strong support area where the cryptocurrency has previously found buying interest.
Notably, Ethereum’s volume analysis also indicates fluctuating market participation, with no strong signs of bullish drivers or strong momentum. If volume remains low and selling pressure increases, Ethereum is likely to experience further price declines.
Analyst Predicts Three Key Targets For Ethereum
Despite the ongoing selling pressure and decline in the Ethereum price, crypto analyst Patron on X (formerly Twitter) remains optimistic about the cryptocurrency’s future outlook. The market expert has predicted three bullish targets for the Ethereum price, believing that it is only a matter of time before its present downtrend dissipates.
Related Reading
The analyst noted that Ethereum had reached a key support level, where a bounce from this threshold could trigger a surge to his projected targets marked by yellow lines on his price chart. With the Ethereum price trading at $1,989 as of writing, the analyst forecasts that it could reach a first target of $2,296, representing a 15.44% increase.
After this surge, Patron predicted that Ethereum would reclaim previous highs and rally to $2,913, marking a 46.46% gain. For his final target, he projects a surge to $4,000, reflecting a 101% jump to a new ATH. Notably, the analyst claims that if Ethereum can reach these bullish targets, it could yield a significant 100% profit for investors.
Featured image from Unsplash, chart from Tradingview.com

Crypto Tycoon Drops $1 Billion On Private Space Station

Time To Buy Ethereum (ETH)? Here’s What This Analyst Thinks

Number of New XRP Investors Drop to a 4-Month Low

Ethereum Exchange Reserve Hits New All-Time Low — Bullish For ETH Price?

Fidelity Files For Tokenized US Dollar Money Market Fund On Ethereum

Shiba Inu (SHIB) Might Rally Likely If Bitcoin Breaches $90,000

2.52 Million Altcoins Are Ruining Crypto’s Future

Animoca Brands Valuation Tanks 75% In Two Years, Here’s Why

Crypto exchange BingX hacked for $43 million

Are The Big Players Losing Interest?

Hong Kong’s Securities Association Tips Authorities On Crypto Self-Regulation

Coinbase cbBTC Set to go Live on Solana
2.52 Million Altcoins Are Ruining Crypto’s Future
Animoca Brands Valuation Tanks 75% In Two Years, Here’s Why
Crypto exchange BingX hacked for $43 million
Are The Big Players Losing Interest?
Hong Kong’s Securities Association Tips Authorities On Crypto Self-Regulation
Coinbase cbBTC Set to go Live on Solana
-

 Bitcoin24 hours ago
Bitcoin STH Realized Losses Far From 2021 Levels — Is The Bull Run Still On?
-
 Altcoin24 hours ago
Ethereum Price Eyes Key Resistance as Analysts Warn of Drop to $1,700
-
 Altcoin22 hours ago
Expert Gives Reason Why Binance & Bybit Have Not Listed Pi Network
-

 Altcoin19 hours ago
Shiba Inu Burns Slow To A Crawl With Only 2 Transactions In 24 Hours, What’s Happening?
-

 Market17 hours ago
XRP Flashes Descending Trendline, Why A Surge To $4 Is Still In The Cards
-
 Altcoin17 hours ago
US FOMC, XRP Lawsuit, & Pi Network In Spotlight
-

 Blockchain17 hours ago
Trump Administration Push for Blockchain-Powered USAID Overhaul—Here’s What Could Change
-

 Market16 hours ago
PEPE Bulls Regain Control As Price Stays Above Moving Average